NQ Power Range Report with FIB Ext - 11/4/2025 SessionCME_MINI:NQZ2025
- PR High: 25574.25
- PR Low: 25501.75
- NZ Spread: 161.75
Key scheduled economic events:
09:15 | ADP Nonfarm Employment Change
10:00 | ISM Non-Manufacturing PMI
- ISM Non-Manufacturing Prices
10:45 | S&P Global Services PMI
Session Open Stats (As of 12:45 AM)
- Session Open ATR: 401.88
- Volume: 92K
- Open Int: 290K
- Trend Grade: Long
- From BA ATH: -3.5% (Rounded)
Key Levels (Rounded - Think of these as ranges)
- Long: 26636
- Mid: 25410
- Short: 24039
Keep in mind this is not speculation or a prediction. Only a report of the Power Range with Fib extensions for target hunting. Do your DD! You determine your risk tolerance. You are fully capable of making your own decisions.
BA: Back Adjusted
BuZ/BeZ: Bull Zone / Bear Zone
NZ: Neutral Zone
Trade ideas
2 losses, could've gone full out. Could've made profit on the day but I saw a different narrative, we go again tomorrow.

Nasdaq - potential trigger Break for a long targetNasdaq - potential trigger Break for a long target
We are at final point of rebound
We can have a potential 5 wave so, if price will break trigger zone we can have final long wave.
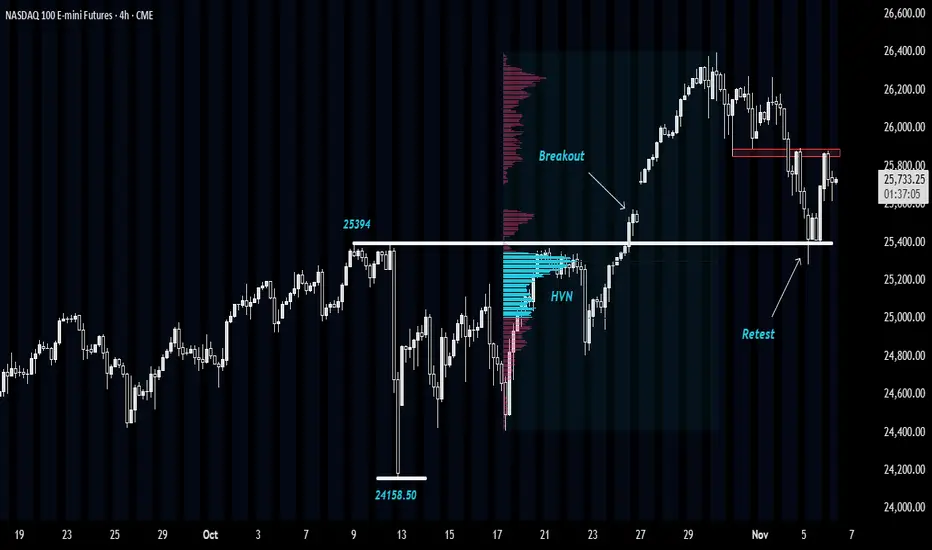
NASDAQ: Retesting Breakout ZoneThis idea is based upon successful Breakout Retest scenario near a High-Volume Node (HVN).
Let's first get to the basics:
A successful Breakout Retest -
A breakout retest scenario occurs when the price breaks through a key level of support or resistance and then returns to test that same level before continuing in the breakout direction.
For example, if the price breaks above a resistance zone, traders wait to see if the price comes back down to that zone. If it holds as new support and shows rejection candles or strong buying, that’s called a successful retest.
At a successful retest, several things typically happen:
➡The old resistance acts as new support (or vice versa in case of breakdown).
➡Traders who missed the initial breakout enter the trade, adding momentum.
➡Weak hands or short-term traders exit, cleaning up the order flow.
➡The price often accelerates in the direction of the breakout with stronger conviction and volume.
In simple terms, a successful retest confirms that the breakout was genuine and not a false move.
High Volume Node -
HVN is a price level or zone on a volume profile where a large amount of trading activity has occurred. It represents an area where buyers and sellers actively agreed on price, leading to high transaction volume.
These zones usually act as balance areas- price tends to pause, consolidate, or even reverse near them because many traders have open positions there. When price revisits an HVN, it often encounters strong support or resistance, as market participants react to protect or exit their earlier trades.
In short, an HVN marks a fair value area on the chart where market consensus was strongest.
NASDAQ Analysis -
In the Nasdaq E-mini chart, we can observe a sharp decline from 25,394 to 24,158, but without any meaningful follow-through on the downside.
Subsequently, the price reacted once again from this same zone on 21st and 22nd October, before eventually breaking above 25,394 with strong momentum to form new highs.
At present, the market has pulled back to the 25,394 level, which previously acted as resistance. This area is now holding as support, suggesting a successful retest and presenting a potential buying opportunity.
Moreover, this retest is aligning with a HVN around 25,300, further reinforcing the support zone.
In the short term, the price is facing resistance near 25,900. A conservative long entry could be considered after a sustained move above 25,900, while an aggressive low-risk entry could be initiated around 25,500, closer to support.
📣Disclaimer:
Everything shared here is meant for education and general awareness only. It’s not financial advice, nor a recommendation to buy, sell, or hold any asset. Do your own research, manage your risk, and make sure you understand what you’re getting into.
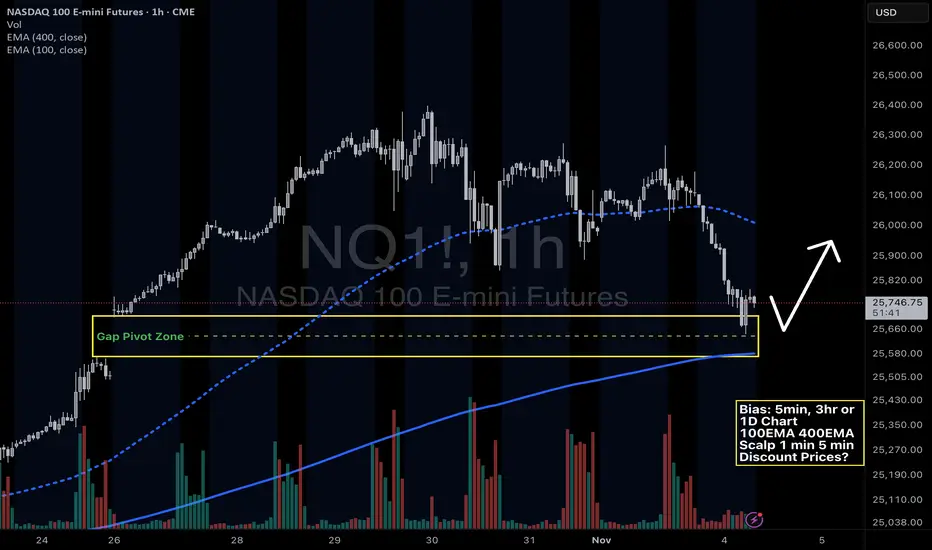
NQ - LONG SETUPAfter a rally, I waited the price comes back to the gap. After the rejection, I executed the trade and used the same gap to protect my stop loss. It was a 50% retracement.

Nasdaq NQ - tapping into previous Gap Pivot ZoneNQ -Nasdaq Futures- pulled all the way back to the previous Gap up zone from October 26, 2025. Also, confluence with the 1 hour 400 EMA. Does this signal a bounce opportunity? Or does this signal that there will be a major news event that will occur? Is the market predictive of real life?
3rd trade of the day.3rd trade, just seeing stuff as it comes up. It looked bullish and made sense so we excecute.

AMP Futures - How to create alerts for News Flow filtersIn this idea we will demonstrate how to enable alerts for your News Flow Filters using Tradingview.

NASDAQ 100 (NQ1!): Bullish! Buy The Dips!Welcome back to the Weekly Forex Forecast for the week of Oct. 27 - 31st.
In this video, we will analyze the following FX market: NASDAQ (NQ1!) NAS100
The NASDAQ closed last week at ATHs. I expect more of the same next week.
Look for valid dip buying opportunities, my friends.
If the market disrespects the +OB, then buys become invalidated.
Enjoy!
May profits be upon you.
Leave any questions or comments in the comment section.
I appreciate any feedback from my viewers!
Like and/or subscribe if you want more accurate analysis.
Thank you so much!
Disclaimer:
I do not provide personal investment advice and I am not a qualified licensed investment advisor.
All information found here, including any ideas, opinions, views, predictions, forecasts, commentaries, suggestions, expressed or implied herein, are for informational, entertainment or educational purposes only and should not be construed as personal investment advice. While the information provided is believed to be accurate, it may include errors or inaccuracies.
I will not and cannot be held liable for any actions you take as a result of anything you read here.
Conduct your own due diligence, or consult a licensed financial advisor or broker before making any and all investment decisions. Any investments, trades, speculations, or decisions made on the basis of any information found on this channel, expressed or implied herein, are committed at your own risk, financial or otherwise.

NQ UpdateI totally forgot about the Fed meeting this week.
NQ melting up like I suspected that it would even with two open gaps below. My guess here is that either Powell says something to tank the market or Trump does Friday, lol. Usually what happens when it climbs too high too fast. Or maybe it's buy the rumors, sell the news event.
The market will probably pump right up to the meeting. No point in buying puts until then. I might just stay out of it since the whipsaw is gonna be HUGE. There will be China trade news on Friday too.
RSI and MFI overbought, typical of a melt up, but something always ends a melt up.

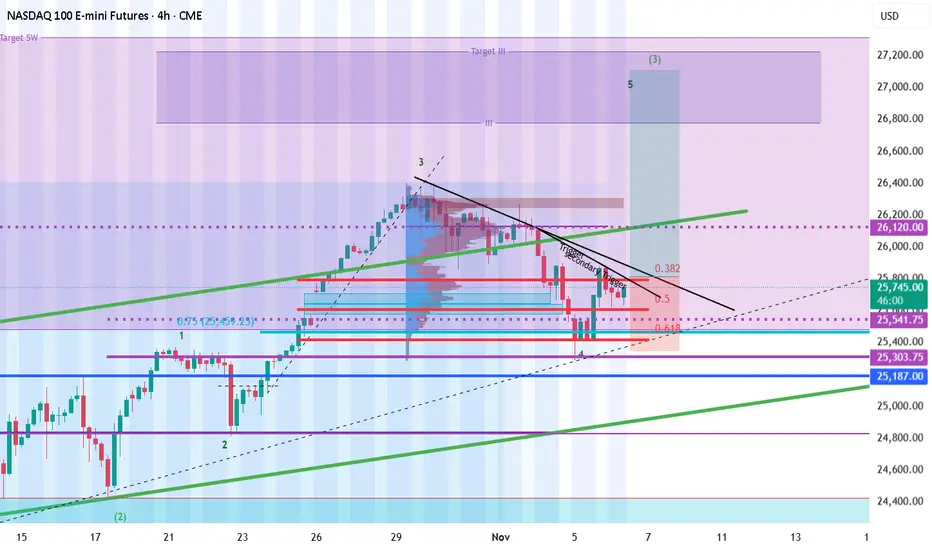
Is Nasdaq Set for a Pullback? | Fibonacci Resistance Zone ahead!In this video I map out the idea of the Nasdaq being over extended and on route to approaching a key Fibonacci resistance level 27000 ,
This may set up a potential correction in the week ahead."
This is a counter-trend setup within a larger uptrend, so risk management is key. I'm not calling a top to the entire rally, but rather a healthy pullback to bring in new buyers."
I demonstrate how i see the price action moving forward over the course of the month ahead with valuable insights.
Tools used in this video Standard Fib , Fib Expansion, Fib extension + Anchored vwap and Volume profile and TPO chart

NQ = week 44T.A explained -
BS & FS levels are expected support when dashed lines, tested when dotted and resistance when solid lines.
The inverse is true for the Inv. BS Inv. FS levels, they are resistance as dashed lines, tested as dotted and support as solid lines.
Monthly timeframe is color pink
weekly grey
daily is red
4hr is orange
1hr is yellow
15min is blue
5min is green if they are shown.
strength favors the higher timeframe.
2x dotted levels are origin levels where trends have or will originate. When trends break, price will target the origin of the trend. its math, when the trend breaks, the vertex breaks too so the higher timeframe level/trend that breaks, the more volatility there could be as strength in the orders flow in to fuel the move.


NQ OUTLOOK FOR UP COMINGWe broke an all-time high last week, and we are currently above the 50/200 EMA. A fair value gap is present on the one-hour/4-hour time frame that is close to the previous resistance or break of structure, and TP2 is in play. If it breaks and closes above the last week high, look for the fair value gap to touch for an buy entry. If the market close above the previous 4-hour candle from last week, look for it to take out the current month high, technically it works OK, but if the president says or does something, throw the technicians out the window, stop your loss, and don't be greedy.

NQ Range (10-20-25, Week 4)NAZ is traveling within the Churn Zone, looking for a Breakout. Favoring a lower move prior to an upside Breakout. Scalping Shorts to KL's until "all hell breaks loose". Lower CZ currently is providing U Turns with the BTD/FOMO's redirecting the NAZ. The O/N, Dead Zone Lifting while the Open Drive continues to sell off. We have seen double Pump/Dumps after any O/N drop or Open Drive sell off. Will update as we go.

HEY NAZ, WHATS NEWS GONNA MAKE YOU DO?! NAZ Bias-Bearish(personally) HOWEVER-----
Let price show us the way. I believe that price will be looking for key levels to bounce around on before making its true climb or decline. The reason I am bearish this week is the belief that negative news is coming and a lack of pullbacks on daily/HTF charts. So sauce.... Im looking for price to come down and hit a fibs retracement at this FVG for a
GOOD BUY bounce! Around 25,428-25,394! First, setup; after that, the IPP (important price point) to look at will be how price interacts with 25,509-25,491. If it doesn't break above on a higher time frame, I believe we push LL to hit BIG FVG 25,214!! which i really want to buy from there but if it breaks above we can see a strong retest of SOB and HH's! Either way, WE GET PAID! Sitting on my hands until the price shows me where we're riding! GDluckThisWeek and happy hunting!

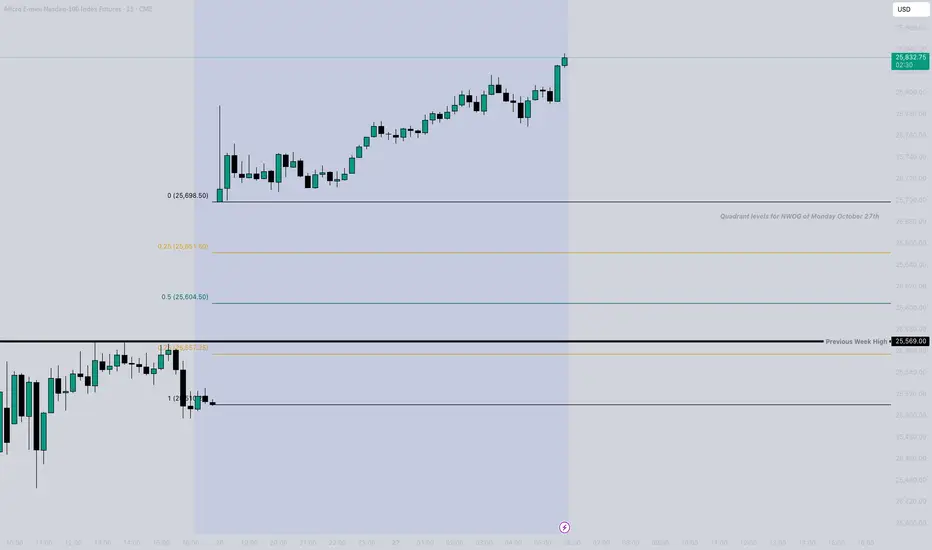
Monday October 27th New Week Opening Gap! Price created a huge gap this week that I will be shifting my attention to going into this weeks trading. I want to keep an eye for how price will likely use this NWOG with lots of medium and high impact news coming into this week as well. No news today so I won't be expecting anything extreme for a casual Monday trade but more focusing on what clues price can leave us that will give us a clear direction for the remainder of the week.
NQ Week 43Updated levels for week 43
BS & FS levels are expected support when dashed lines, tested when dotted and resistance when solid lines.
The inverse is true for the Inv. BS Inv. FS levels, they are resistance as dashed lines, tested as dotted and support as solid lines.
Monthly timeframe is color pink
weekly grey
daily is red
4hr is orange
1hr is yellow
15min is blue
5min is green if they are shown.
strength favors the higher timeframe.
2x dotted levels are origin levels where trends have or will originate. When trends break, price will target the origin of the trend. its math, when the trend breaks, the vertex breaks too so the higher timeframe level/trend that breaks, the more volatility there could be as strength in the orders flow in to fuel the move.

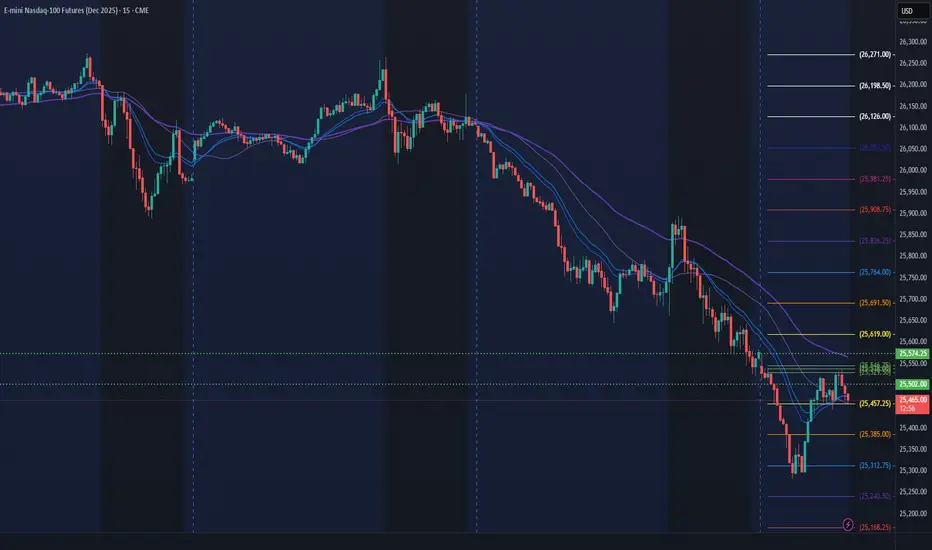
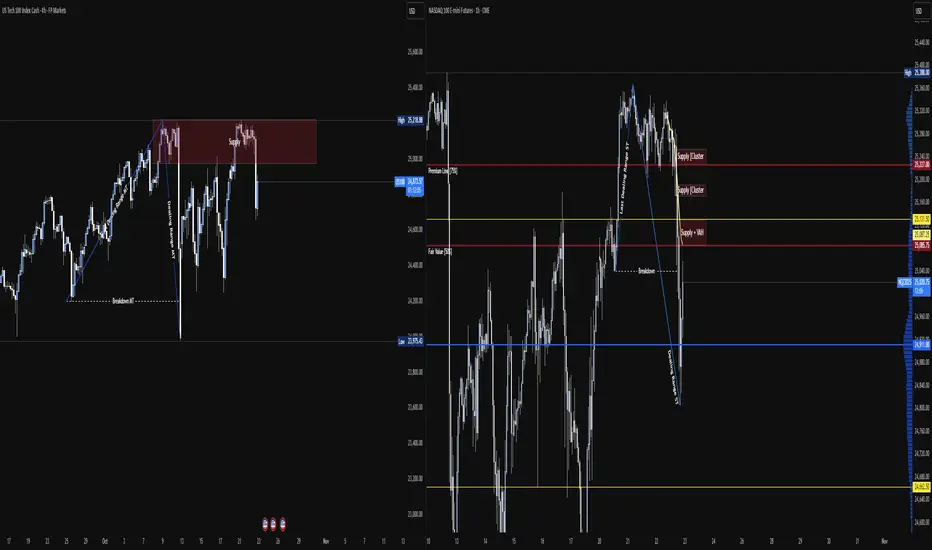
NASDAQ 100 - US100 // Short Setup Macro Overview
After the daily structure break, the market retraced into the origin supply zone, confirming the redistribution phase.
Today, price re-entered the macro Value Area and is now approaching the VAH, where institutional activity may lead to a new redistribution cycle toward the lower value edge (VAL).
The medium-term bias remains bearish — the short-term structure has realigned with it.
Context Summary
– Daily: confirmed bearish structure after origin breakdown.
– Re-entry into macro VA after short-term extension.
– VAH at 25,130–25,227 aligns with supply + negative delta clusters.
– Fibonacci 0.75 level (25,228.50) marks the center of premium liquidity.
– Bias remains short below VAH.
Execution Plan
Bias: Short
Entry Zone: 25,087.50 → 25,228.50 (Supply + VAH + 0.75 Fib)
Stop Loss: 25,370
TP1: 24,800.00
TP2: 24,650.50 (VAL)
Trigger: Redistribution on negative delta cluster near VAH.
Charts for Friday! Good Luck, Trade in between the lines!Price on the 1H has already closed about midpoint of the 4H zone. In this case we have a break out up to the previous trendline to either retest or reject... We also can have price comeback and retest the level it just broke and either go up or down from there... Be aware of the pullbacks!
I will post a updated chart for the week on Saturday night.

Bullish continuation for NASDAQ?
📊 CME_MINI:NQZ2025 Analysis – Oct 18, 2025
🧠 Market Context:
Price recovered back into Premium of range (the upper part of the current weekly range) after the drop to 24,158. Creating an inside week that managed to provide a Bullish close.
Inside Week consolidated in an 1H frame.
Price currently upper band (Premium) of 1H consolidation.
Trapped Sellers at discount of 1H range which happens to be previous week Opening
Gap High area.
Lack of US scheduled Red Folder news until Friday morning.
8:30am
📕 Core CPI m/m
📕 Weekly wick 50% at 25196
📕 CPI y/y
9:45am
📕 Flash Manufacturing PMI
📕 Flash Services PMI
Price referencing areas between 25,050–25,210. Premium of a weekly range.
🔼 There are several thing to note here:
🎯 Daily wick 50% at 25121.75
🎯 Weekly wick 50% at 25196
🎯 A Daily REQ Close and Open ( Origin of Weekly Short) at 25354.00
🎯 And REQ (Relative Equal) Highs and ATHs (All Time Highs) at 25394.00
Price can continue to explore Premium of weekly range using these as targets but keep in mind the potential for weakness and reversal formations along these levels.
High timeframe bias as well as structure still Bullish, keeping in mind that Price is currently within a Bearish Range (Friday October 10, 2025) Mondays PA and range might clarify wether Bias will remain Bullish, or if there will be any more signs of weakness and reversal formations.
🔻 There are several thing to note on the short side here:
🙁 Trapped Sellers ( Passive Liquidity) at discount of 1H Range and accumulation or Lower Band.
📉 Week Opening Gap (Reference partially) at discount of bigger range
📉 Weekly Low at 24410.00
📉 Previous Weekly Low at 24158.50
🧩 Context: Still questioning whether Fridays drop could be labeled as Price displacement and considered signal, or Rebalance. The difference will be noticed Mon-Tues.
Still uncertain on 💲 Dollar TVC:DXY Pending Bullish continuation confirmation or reversal back into chop.

NQZ2025 Return to Wick 50% then liquidity purgeOn the 4h chart, I see price close above the 50% of a 4h Order Block and above a 1h gap. I think the market has a high probability of treating the gap as an inversion, that, with the confluence of DXY purging shorts and the weekly wick 50%.
Therefore, the next likely target is the liquidity resting above.

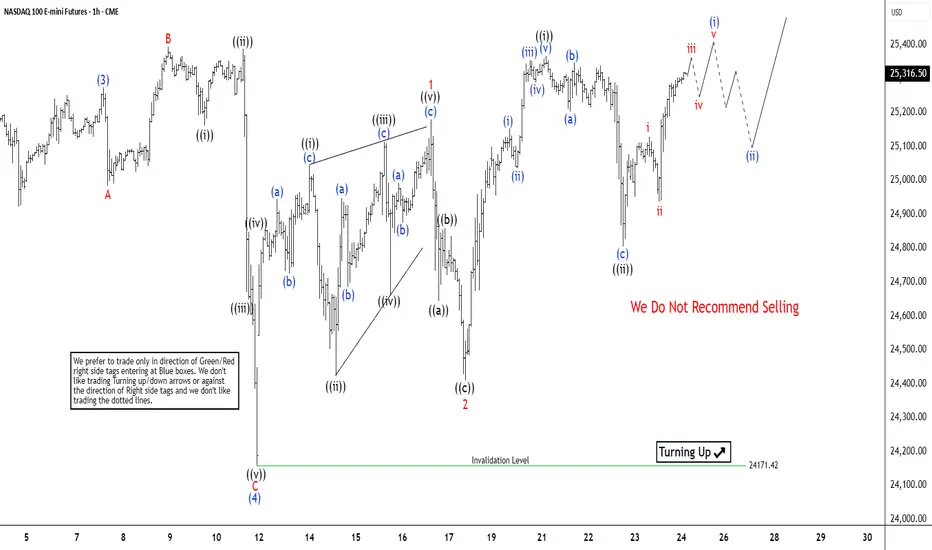
Nasdaq Futures (NQ) Targeting Wave (5) Upside Nasdaq Futures (NQ) advances steadily toward completing the cycle that originated at the April 7, 2025 low. The index targets a fresh all-time high. This rally develops as a textbook impulsive structure. Wave (3) culminated at 25,275. Wave (4) then corrected lower and finished at 24,166.26. The 1-hour chart captures this progression clearly.
The internal structure of wave (4) took the form of an expanded flat. Wave A ended at 24,984.75. The Index then rallied in Wave B to 25,394. Wave C completed the pattern with a decline to 24,166.26. Wave (5) now drives the index higher. From the wave (4) low, wave 1 rose to 25,179.5 and formed a leading diagonal. Wave 2 pulled back to 24,410. The advance then nested with wave ((i)) peaking at 25,368 and wave ((ii)) finding support at 24,804.75. This nesting confirms the underlying bullish trend.
Provided prices hold above 24,166.26, any near-term dip should attract buyers at the 3, 7, or 11 swing levels, aligning with structural support zones. Upside momentum remains intact. The minimum target extends from the October 21, 2025 high. An inverse Fibonacci retracement of 123.6% to 161.8% yields a range of 25,490 to 25,701, consistent with classic wave extensions.