Trade ideas

NQ UpdateI noticed this morning that MFI actually went down, not up.
I bought ALB in the morning and flipped it for $1 per share profit. That stock moves well.
NQ 10/30lets see where this goes today. the lines are color coded and they mean things. go to other posts to see what that means.


Heads Up!!!!5m chart, 09:45 candle is a Heads Up!!!! candle. Volume, Long Lower Wick, ~High Wave Doji on a strong support
If you had waited for the 10:05 close and deployed the following plan:
1.-1 Pawn @ 26084.50
2.+2 Kings @ 26085.00
3. MNQ Ladder of Success
You would have traded this like a true champion.
Make this plan your own. Adapt it to your account size and your risk tolerance.


NQ Nasdaq Trade Set Up for NY session Price breakout from intradayPRIMARY: Bearish Setup #2 (Conservative Retest Entry)
Why:
✅ Aligns with your 10+ hour analysis
✅ Best risk/reward (8:1 potential)
✅ Waits for confirmation
✅ Tighter stop = better position sizing
✅ Matches your patient discipline
Execution:
Watch NY open for break below 26,150
Don't chase - wait for retest of 26,150-26,170
Enter on rejection confirmation
Stop at 26,205 (60pt risk)
Target 500pts = 25,650-25,670
ALTERNATIVE: If no break by 23:00 JST → Wait for H4 close and use Bearish Setup #3 reach 26200 in Asian session but

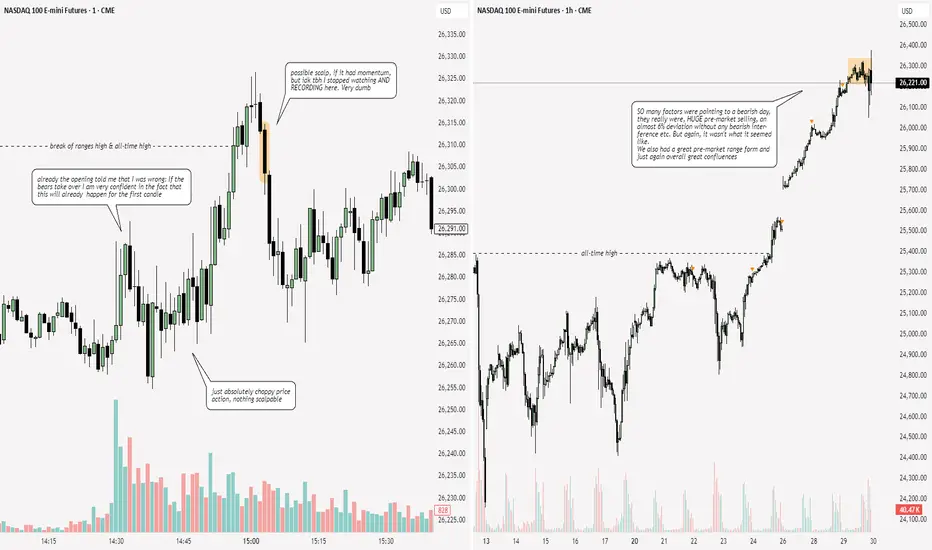
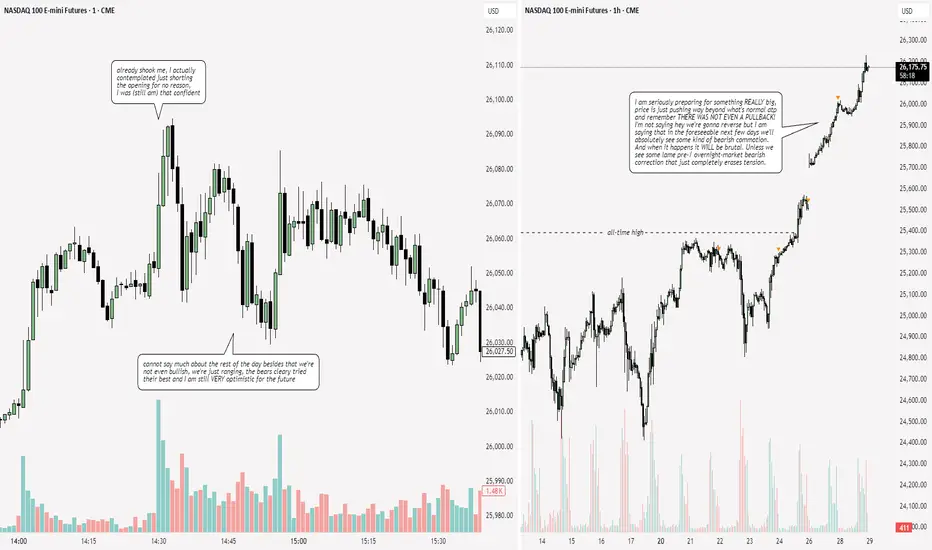
NQ: 279th trading session - recapPretty sad that I won't be here tomorrow but its fine ig, next weeks a holiday. I can trade all 5 days long.


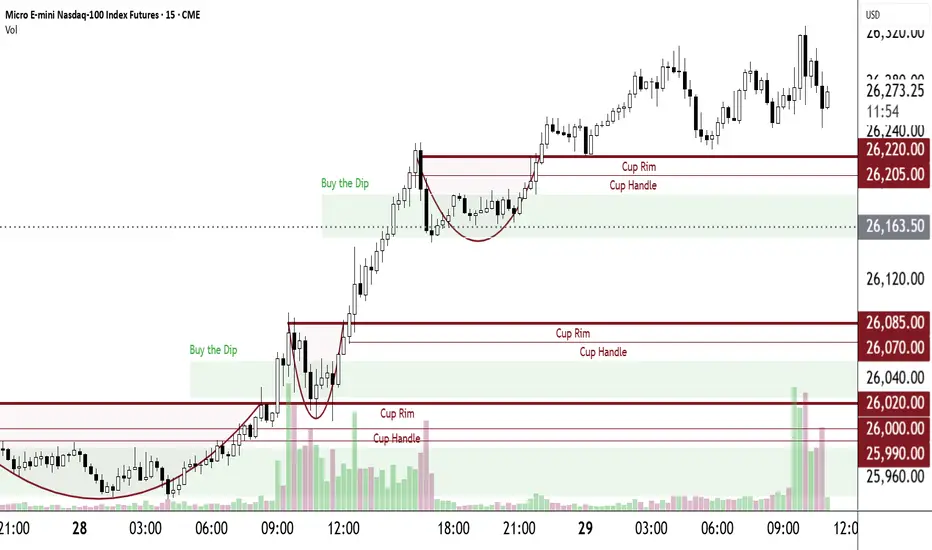
morning shortLooking for a 9:30 AM opening trade for a push-up to 26,145. And to short down to 26,020.

NQ: 278th trading session - recapGood session today, I'm just completely surprised again that we didn't get a single taste of bearish strength. I find it still very strange.
what if that was the meltup?think we get something like this going into Q1 '26
so many potential headwinds out there with the big boys priced for EXCEEDINGLY GOOD OUTCOMES...
lotta risk out there right now.
GOOD LUCK

MNQ Ladder of SuccessEntries: every ought and every five. i.e. every number divisible by 10 and every number divisible by 5.
Exits: 19 points for each and every entry.
Stop Loss: none
Entry type: stop market
Exit type: stop limit
Example
Let's say this bounces on 26220 with a high of 26243.
Entries will start @ 26245 and every 5 points thereafter.
Exits will start @ 26264 and every 5 points thereafter
You are now on The MNQ Ladder of Success. Once you reach the fourth rung you will have a revenue stream every 5 points. Until you don't i.e. after a pullback. When there is a pullback, wait for a bounce and start the process all over again.
If you combine this with A Pawn for a King trading plan your first entry will be -1 @ 26244.50. Beginning @ 26245 and every 5 points thereafter you will buy 2 contracts.
Raw numbers on a page can be confusing and intimidating. Demo trade this and you will see its simplicity.
Don't forget the Pawn is redeemable after a pullback.
Simple short Idea on NQOnce we didn't have much speed after respecting 1st P.FVG and broke below the OB- I was short, watch and see how I managed the trade and my thoughts.

Short Analysis for the NQ ft. ES, DOW & DXYNQ: Range bound , 50/50 as of the time posting this; due to the discrepancies in the 3 sisters and the unreliability of the DXY.
ES: Same situation as the NQ
DOW: Potentially pursuing higher highs with a probability of dragging the NQ and the ES along with it. Although they do not show such interests for now.
News: CPI, PPI, Non-Farm and other market drivers coming up in the next few weeks, which might provide some clarity on the mid to short-term. Calling a top now would be equivalent to gambling, in my opinion.

NQ: 277th trading session - recapVery interesting day today. I will be here tomorrow, but probably not on friday. I just really have to hope the bearish increase happens tomorrow or the day after that.
Pop Quiz5m chart. Which candle is shouting "I want to bounce!''? Correct - the 09:55 candle.
Where is it most likely to bounce? Correct once again - the Buy the Dip area especially at prior day's close.
Will it bounce here? Now that's the $64,000.00 question. Therein lies the challenge. As long as you manage your margin and as long as you have one or more Pawns in your pocket, you'll be fine. Prior posts go into both subjects in detail.

"Duct Tape" RallySo says Brian Brenberg of Fox Business's The Big Money Show.
Hopeful news over the weekend about a possible easing of U.S.- China trade tensions gave us today's rally. It's just another duct tape patch. Communism is based on a lie. No matter how cleverly designed and alluring, a lie is still a lie.
"Rob, Replicate and Replace" is a term commonly used when referring to Communist China's Trade policy. Thankfully, for now, we have an administration that knows this and knows how to handle this. Of course, China will continue to lie, obfuscate and delay, delay and delay some more, waiting for a new administration that won't be wise.
Despite this ongoing tension that gives us "duct tape" rallies and volatility, we do have an historical bull market built upon the bedrock of The Fourth Industrial Revolution, strong earnings, an administration that is peace minded and has cut taxes and red tape resulting in powerful economic growth and we have several trade plans that give stellar profits in such an environment. This bull market should last for quite some time.
If you have been following prior posts you would have had your Breakout Trades stacked to the ceiling, ready and waiting for the gap up we had on the 10.26 open. You would have made a pretty good day's pay.
Here is another trade plan I use frequently. I call it a Joker. As with all prior posted trade plans, there's no brilliance here - just common sense. It's a combination of a pivot trade and a Buy the Dip trade. At or near the low of a Buy the Dip area I buy 1 or more MNQ contracts with a profit taker of 101 points. The extra point gives a solid $200.00 profit. I usually get several every week. As usual, I don't use a stop loss. Make sure you manage your margin with this and every prior posted trade plan.
"Behold, I send you forth as sheep in the midst of wolves: be ye therefore wise as serpents, and harmless as doves." Mt. 10:16

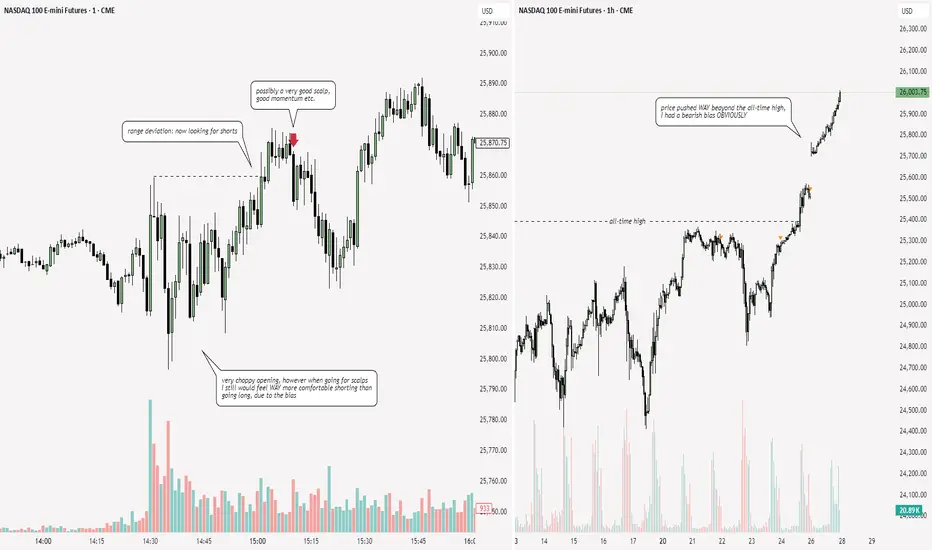
NQ: 276th trading session - recapI'm still contemplating whether I should focus on immediate price reversals when going for scalps that are primarily based off of structure...
AMD Model 2025The AMD model in trading stands for Accumulation, Manipulation, and Distribution. It describes how institutional traders, often called smart money, move the market to collect liquidity and position themselves before the real trend begins.
In the accumulation phase, the market moves sideways and builds liquidity above and below the range. This phase is used by smart money to quietly enter positions while retail traders get impatient, waiting for a breakout. Liquidity builds up at both ends of the range, creating potential stop zones for future manipulation.
Next comes the manipulation phase, which is when the market makes a false move. Price breaks out of the range, sweeping liquidity and triggering breakout traders who believe a new trend has started. In reality, this move is designed to trap traders and collect their stop losses. Once that liquidity is taken, the market usually reverses in the opposite direction — this is where smart money starts positioning for the true move.
Finally, the distribution phase is the real directional move after manipulation. Here, the market shows a clear break of structure, and momentum shifts strongly in one direction. This is when smart money distributes their positions for profit, while late traders are often caught on the wrong side.
The AMD model repeats across all timeframes — from daily to one-minute charts — and helps traders understand the logic behind market moves. To trade using AMD, you identify the range (accumulation), wait for the liquidity sweep (manipulation), and then enter after confirmation of the new trend (distribution). This model is simple but powerful, as it shows how liquidity, structure, and market psychology combine to create the rhythm of price movement.

Target areas - NQ price for Market open.10/27/25 - These are the target areas - NQ price for Market open depending if price moves up or down. Will look for trades into these areas.

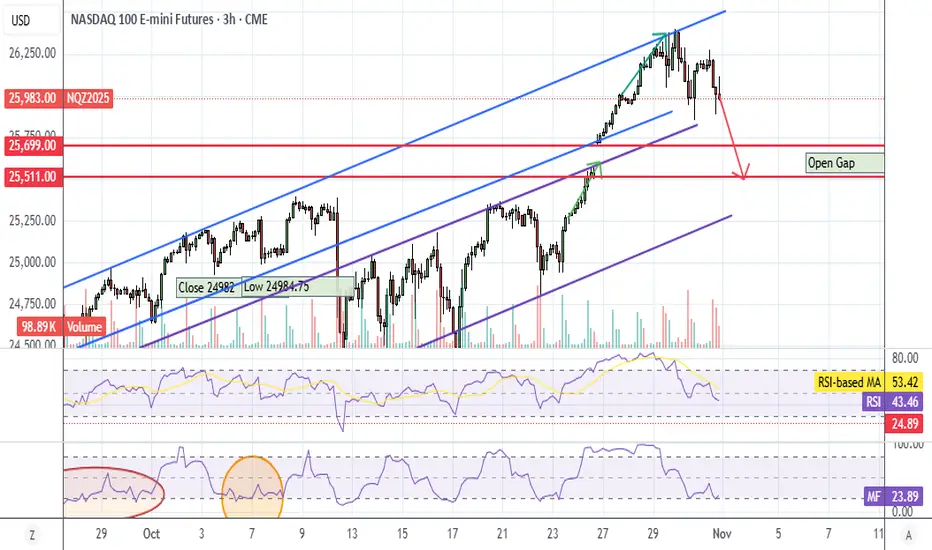
PRICE FLOW MNQZ2025This week, the price flow, for this week we are going to look for a rebalance and we will have sales. First, we expect the price to reach the level of $25,788, then we will look for sales down to 25,290. Be attentive to the economic calendar, which can cause significant distortions in the price path performance.

NQ: 275th trading session - recapNothing happened yet again, just another session just for the books here. I will trade tomorrow hopefully, I've been sick
