NQ & ES Premarket Comment Tuesday 21-10-2025We’re currently trading in a zone where long setups are off the table, even if some appear to form. Unless clear short opportunities emerge, we’ll stay completely out of the market — because this is what builds discipline and consistency, the core pillars of longevity in this industry.
After the market open, we’ll be patiently waiting to identify strong resistance levels and potential SMT reversal signals before taking any engagement.
PF
Disclaimer: This analysis reflects personal market observations and is for educational purposes only. It does not constitute financial advice.
Trade ideas

Shorting NQ (overbought)?It's reached 4h support, and appears to be dropping slowly. Let's watch and see how it goes as I'm also managing my position. 😉

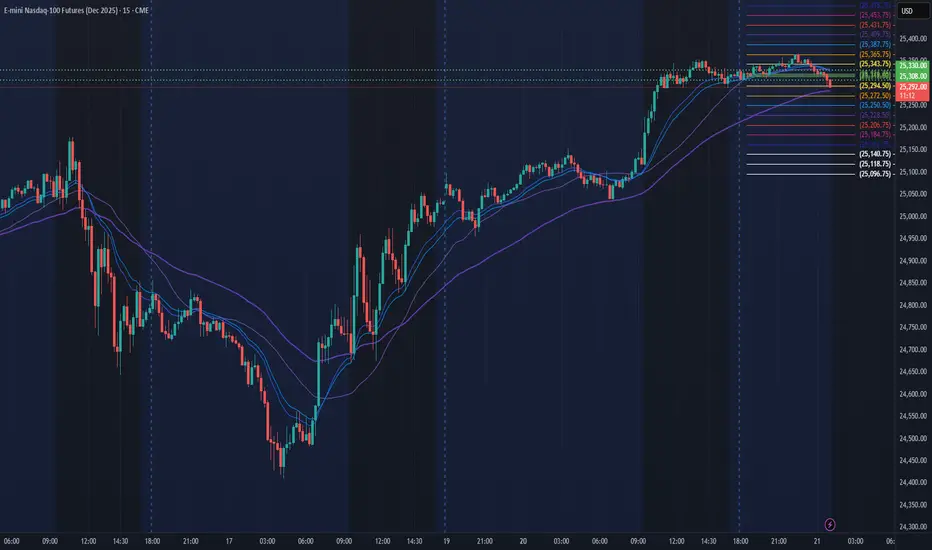
NQ Power Range Report with FIB Ext - 10/21/2025 SessionCME_MINI:NQZ2025
- PR High: 25330.00
- PR Low: 25308.00
- NZ Spread: 49.0
Re-approaching ATH
No key scheduled economic events
Session Open Stats (As of 12:35 AM)
- Session Open ATR: 398.28
- Volume: 21K
- Open Int: 292K
- Trend Grade: Long
- From BA ATH: -0.2% (Rounded)
Key Levels (Rounded - Think of these as ranges)
- Long: 26020
- Mid: 23571
- Short: 21939
Keep in mind this is not speculation or a prediction. Only a report of the Power Range with Fib extensions for target hunting. Do your DD! You determine your risk tolerance. You are fully capable of making your own decisions.
BA: Back Adjusted
BuZ/BeZ: Bull Zone / Bear Zone
NZ: Neutral Zone

Target areas - NQ price for Market open.10/20/25 - These are the target areas - NQ price for Market open depending if price moves up or down. Will look for trades into these areas.

Support and ResistanceChoppy markets make messy charts. This is my usual S/R chart. The focus at the moment is the 10/07 prior vpoc. Right now, it is holding up as support. More or less clear sailing to the 25315 vpoc. Everything on here is a support/resistance - BTD areas, vpocs, prior vpocs, pivots, prior day close. Many are predicting choppy markets to continue for a while.
An arsenal of A Pawn for a King trades, Buy the Dip trades, and Pivot trades shine in both a slow grinding up market and in a choppy market.

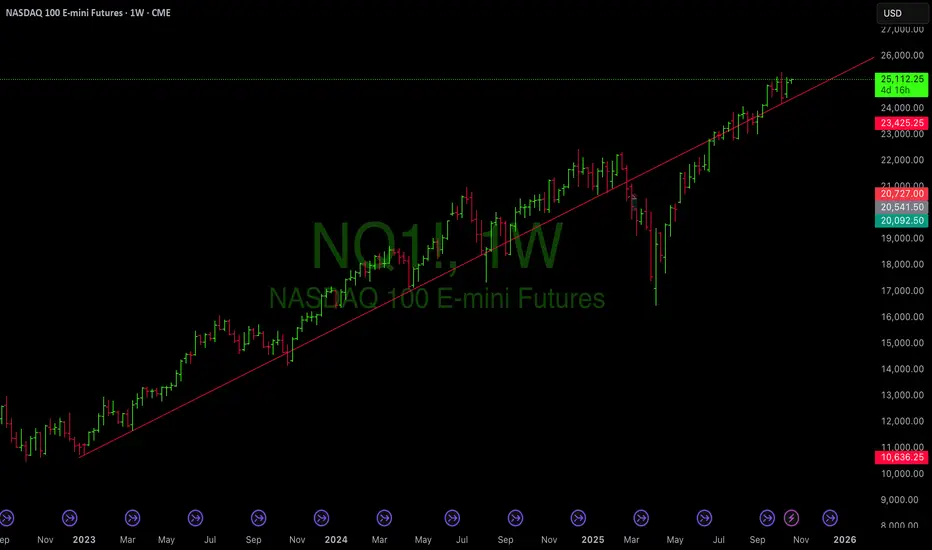
Nasdaq on a Tightrope — Breakdown WatchCME_MINI:NQ1!
Weekly: price keeps hugging the rising trendline; historically it doesn’t get far above it before rolling. Maybe a little upside into the retail box, but I’m be patient for a breakdown weekly close below the trendline = short bias toward 24.0k #NQ #Nasdaq100 #Futures
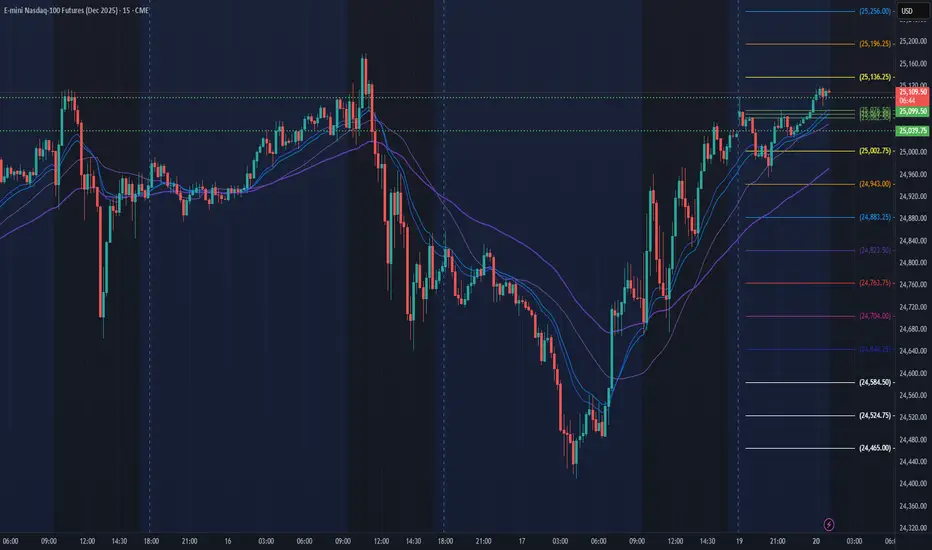
NQ Power Range Report with FIB Ext - 10/20/2025 SessionCME_MINI:NQZ2025
- PR High: 25099.25
- PR Low: 25039.75
- NZ Spread: 133.0
No key scheduled economic events
Session Open Stats (As of 12:45 AM)
- Session Open ATR: 391.21
- Volume: 43K
- Open Int: 283K
- Trend Grade: Long
- From BA ATH: -1.1% (Rounded)
Key Levels (Rounded - Think of these as ranges)
- Long: 26020
- Mid: 23571
- Short: 21939
Keep in mind this is not speculation or a prediction. Only a report of the Power Range with Fib extensions for target hunting. Do your DD! You determine your risk tolerance. You are fully capable of making your own decisions.
BA: Back Adjusted
BuZ/BeZ: Bull Zone / Bear Zone
NZ: Neutral Zone
this my opinion for what happening this weeknq chart I think we will see something like this be safe

#202542 - priceactiontds - weekly update - nasdaqGood Evening and I hope you are well.
comment: Big tails above and below the daily bars last week. Strong reversal on Friday but the move from 25388 down to 24157 is still the dominant feature of the chart. Bulls need to get strong follow-through on Monday to continue with higher highs inside the channel but I do think the odds are good that we print a lower high below 25179 and move lower again. Given that bulls closed the week at the high, I can not go bearish into next week. I need to see big selling pressure first.
current market cycle: bull trend still valid until we break below 24000
key levels for next week: 24000 - 25400
bull case: Bulls want another bullish daily close on Monday and print another ath. Given their amazing close last week, they are favored going in to next week but their problem is that last week had prominent tails above every daily bar since Tuesday. So how confident are the bulls to buy above 25k when the market shows mostly rejections above?
Invalidation is below 24800.
bear case: If bears somehow manage to print a lower high here around 25k and stay below 25179, they have a shot at trading down to <24600 again and we most likely will contract for longer. If they fail, there is no reason we can not print another ath. After Friday’s close, bears do not have many arguments on their side. It’s still overbought and all that but market is refusing to go lower. Every dip is bought with force. For bears to achieve something, we need a big bear gap.
Invalidation is above 24200.
short term: Neutral again. Bearish below 24800 and nothing will make me bullish.
medium-long term - Update from 2024-08-19: 23000 likely to get hit this year gain. (updated from 22000 to 23000 since we are not moving lower and time is not on my side with this)

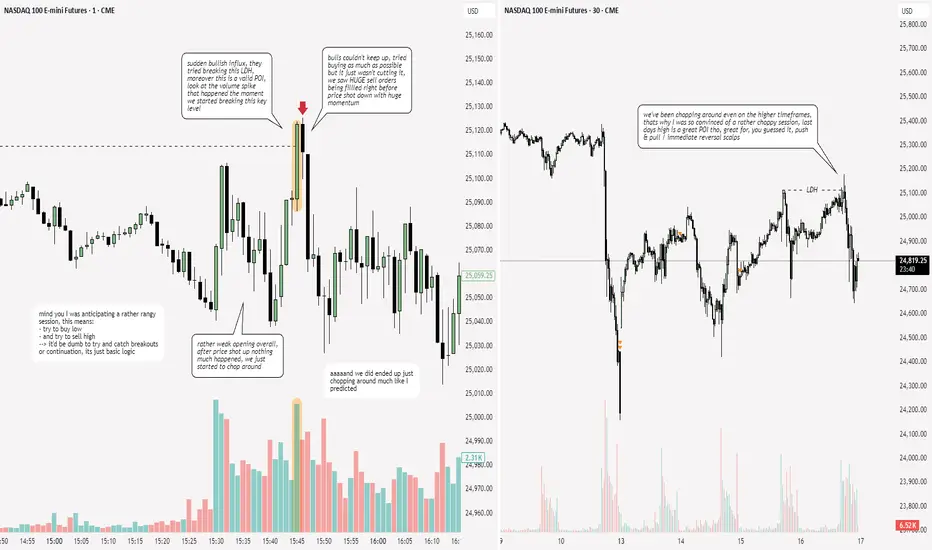
NQ: 272nd trading session - recapJust another session just for the books, absolutely NOTHING happen that was worth mentioning

Competitive Currency War: An In-Depth AnalysisIntroduction
A competitive currency war, often termed a currency devaluation war, refers to a situation where countries deliberately devalue their currencies to gain a trade advantage over others. In essence, nations engage in a race to weaken their currencies to make exports cheaper and imports costlier, thereby stimulating domestic production and employment. However, while it may provide short-term gains to an individual nation, a widespread currency war can destabilize the global economy, heighten financial volatility, and strain international relations.
The term “currency war” became popular after Brazil’s finance minister Guido Mantega used it in 2010 to describe the growing wave of monetary interventions by major economies after the global financial crisis. Since then, the world has witnessed multiple instances of competitive devaluations, especially during times of economic stress—such as the 2008 crisis, the U.S.–China trade war, and the post-COVID recovery phase.
This essay explores the origins, mechanisms, historical examples, implications, and future trajectory of currency wars in an increasingly globalized and digital financial environment.
1. The Concept and Mechanics of Currency War
A currency war typically arises when multiple countries attempt to depreciate their currencies simultaneously to gain a competitive edge. The underlying mechanism involves monetary policy tools, foreign exchange interventions, and fiscal adjustments.
1.1 Key Mechanisms
Monetary Easing:
Central banks reduce interest rates or adopt quantitative easing (QE) to increase liquidity. Lower interest rates tend to weaken the currency, making exports cheaper.
Foreign Exchange Intervention:
Governments or central banks directly buy foreign currencies (like the U.S. dollar) while selling their own currency to suppress its value in the forex market.
Capital Controls:
Some nations impose restrictions on foreign capital inflows to prevent their currency from appreciating excessively.
Fiscal Expansion:
By increasing government spending or subsidies on export sectors, governments can indirectly stimulate output and trade competitiveness.
1.2 The Economic Logic
The basic idea is simple: if a country’s currency is cheaper relative to others, its exports become more competitive globally, while imports become more expensive. This can improve the trade balance, boost GDP, and create employment. However, this logic fails when every nation follows the same strategy — leading to global instability and inflationary pressures.
2. Historical Background of Currency Wars
Currency wars are not a new phenomenon. They have shaped the global economic order for more than a century, reflecting the interplay between national interests and international stability.
2.1 The Interwar Period (1920s–1930s)
Following World War I, countries abandoned the gold standard to devalue their currencies and support domestic recovery. The United Kingdom’s decision to leave the gold standard in 1931 triggered a wave of competitive devaluations, with nations like the U.S. and France soon following. The result was chaotic: trade collapsed, global demand shrank, and the Great Depression deepened.
2.2 The Bretton Woods System (1944–1971)
In response to interwar chaos, the Bretton Woods Agreement established a system of fixed exchange rates anchored to the U.S. dollar, which itself was convertible to gold. This arrangement aimed to stabilize exchange rates and prevent competitive devaluations. However, by the late 1960s, U.S. fiscal imbalances (due to the Vietnam War and social spending) eroded confidence in the dollar, leading President Richard Nixon to end gold convertibility in 1971 — effectively collapsing the system.
2.3 The 1980s: The Dollar and the Plaza Accord
During the early 1980s, the U.S. dollar surged due to tight monetary policy under Paul Volcker and Reagan-era fiscal expansion. This appreciation hurt U.S. exports and created large trade deficits, prompting the 1985 Plaza Accord. Under this agreement, major economies — the U.S., Japan, West Germany, France, and the U.K. — coordinated to weaken the dollar through joint interventions. This is one of the most successful examples of coordinated currency management in modern history.
2.4 The 2008 Global Financial Crisis and Modern Currency Wars
After 2008, central banks worldwide adopted ultra-loose monetary policies, driving down interest rates and flooding markets with liquidity. The U.S. Federal Reserve’s quantitative easing was followed by similar measures in Europe and Japan. Emerging markets, especially Brazil and China, accused developed nations of starting a “currency war” by artificially suppressing exchange rates through excessive money printing.
2.5 The 2010s: U.S.–China Currency Tensions
China was often accused of manipulating its currency, the yuan, to maintain export competitiveness. The U.S. claimed that China’s undervalued yuan hurt American manufacturing. Although China gradually allowed more flexibility in its exchange rate, tensions resurfaced during the Trump administration, when tariffs and currency rhetoric became central tools in the trade war.
3. The Economic Consequences of Currency Wars
While currency devaluation may offer short-term benefits, its long-term consequences are often counterproductive for both domestic and global economies.
3.1 Short-Term Gains
Boost in Exports:
A weaker currency makes exports more affordable in global markets, improving trade balances.
Inflation Control (in Deflationary Contexts):
Devaluation can prevent deflation by raising import prices, stimulating spending and investment.
3.2 Long-Term Costs
Imported Inflation:
Weaker currencies make imports more expensive, leading to rising prices for essential goods such as energy, food, and technology.
Erosion of Investor Confidence:
Persistent devaluation discourages foreign investment, as investors fear currency losses.
Retaliatory Policies:
Competing nations may also devalue their currencies, neutralizing any advantage and sparking global instability.
Debt Burden Escalation:
Countries with high levels of foreign-denominated debt face higher repayment costs when their currencies fall.
Global Imbalances:
Uncoordinated devaluations can distort trade flows and fuel protectionism, undermining international cooperation.
4. Modern Dynamics: Currency Wars in the Digital Era
In the 21st century, currency wars have become more complex, influenced by technological innovation, digital finance, and geopolitical realignments.
4.1 Central Bank Digital Currencies (CBDCs)
The rise of CBDCs — digital forms of fiat currency issued by central banks — could transform how nations compete monetarily. For instance, China’s digital yuan (e-CNY) aims to internationalize its currency and reduce dependence on the U.S. dollar-dominated SWIFT system. This digital shift introduces new dimensions of currency competition based on technological infrastructure and cross-border payment dominance.
4.2 Artificial Intelligence and Algorithmic Trading
AI-driven trading systems now play a significant role in foreign exchange markets, amplifying the speed and scale of currency adjustments. Automated capital flows can accelerate devaluations or appreciations beyond the control of policymakers, increasing market volatility.
4.3 The De-Dollarization Movement
Many emerging economies are actively seeking to reduce dependence on the U.S. dollar for international trade. BRICS nations — Brazil, Russia, India, China, and South Africa — have proposed alternative payment mechanisms and a potential shared currency. This shift poses a strategic challenge to U.S. monetary dominance and adds a new layer to currency competition.
4.4 Geopolitical Dimensions
Currency strategies increasingly intersect with geopolitics. Sanctions, trade restrictions, and financial exclusion (as seen with Russia post-Ukraine conflict) have turned monetary tools into instruments of geopolitical power. As countries seek to protect their financial sovereignty, competitive currency strategies are becoming more politically motivated.
5. Case Studies of Recent Currency Conflicts
5.1 Japan’s Abenomics (2013–2020)
Under former Prime Minister Shinzo Abe, Japan implemented aggressive monetary easing to fight deflation and revive growth. The Bank of Japan’s asset purchases significantly weakened the yen, boosting exports but drawing criticism from trade partners who viewed it as a form of currency manipulation.
5.2 U.S.–China Trade and Currency Tensions
In 2019, the U.S. Treasury officially labeled China a “currency manipulator” after the yuan fell past the symbolic 7-per-dollar level. Although the label was later removed, it highlighted the deep-rooted suspicions surrounding exchange rate practices and the link between trade policy and currency valuation.
5.3 Emerging Market Vulnerabilities
Countries like Argentina and Turkey have repeatedly used currency depreciation as a policy tool, often resulting in runaway inflation and capital flight. These cases illustrate how uncoordinated devaluations can spiral into economic crises if not supported by structural reforms.
6. Policy Responses and Global Coordination
To mitigate the risks of currency wars, international coordination is essential. Several mechanisms have evolved to maintain monetary stability:
International Monetary Fund (IMF):
The IMF monitors exchange rate policies and provides financial assistance to stabilize economies under currency pressure.
G7 and G20 Frameworks:
These platforms promote policy coordination among major economies to prevent destructive currency competition.
Regional Arrangements:
Asian and European monetary frameworks (like the European Monetary System) have been developed to ensure exchange rate stability within regions.
Transparency and Communication:
Clear communication from central banks regarding policy objectives can help reduce market misinterpretation and speculative attacks.
However, in practice, such coordination is often difficult to sustain, as nations prioritize domestic growth over global harmony.
7. The Future of Currency Wars
The future of competitive currency strategies will depend on several evolving trends:
Digitalization of Money:
CBDCs and blockchain-based financial systems could shift competitive dynamics from traditional exchange rate manipulation to digital payment dominance.
De-Dollarization and Multipolarity:
The gradual emergence of alternative global currencies — like the yuan, euro, and rupee — could weaken the dollar’s monopoly, creating a more fragmented but competitive global system.
Climate and Economic Resilience:
Currency policies may increasingly align with sustainability objectives, as nations consider the long-term environmental implications of growth-driven devaluations.
AI-Driven Monetary Forecasting:
Artificial intelligence may enable more precise, data-driven currency management — reducing human error but possibly intensifying algorithmic competition.
Conclusion
The competitive currency war embodies the tension between national economic goals and global financial stability. While currency devaluation can temporarily stimulate exports and growth, it often triggers retaliation, inflation, and uncertainty — eroding trust in international systems. History shows that no country truly “wins” a currency war; all participants eventually bear the costs through reduced global trade, volatility, and weakened economic cooperation.
In the modern era, with digital currencies, AI-driven finance, and shifting geopolitical alliances, currency competition is evolving beyond traditional devaluation. The challenge for policymakers lies in balancing national interest with collective responsibility. Only through transparent policies, cooperative frameworks, and digital innovation can the world avoid sliding into another era of destructive monetary rivalry.
NASDAQ 100 Recovery imminent! Nasdaq 100 Technical Analysis: The index maintains a solid bullish structure, with projections toward the target zone of 25,500 points, supported by positive momentum and strength in the main technological components.

Tape and Trade excecution (DEMO), calling levels.Calling levels and taking demo trades on what I would've taken with Live funds, NFI!

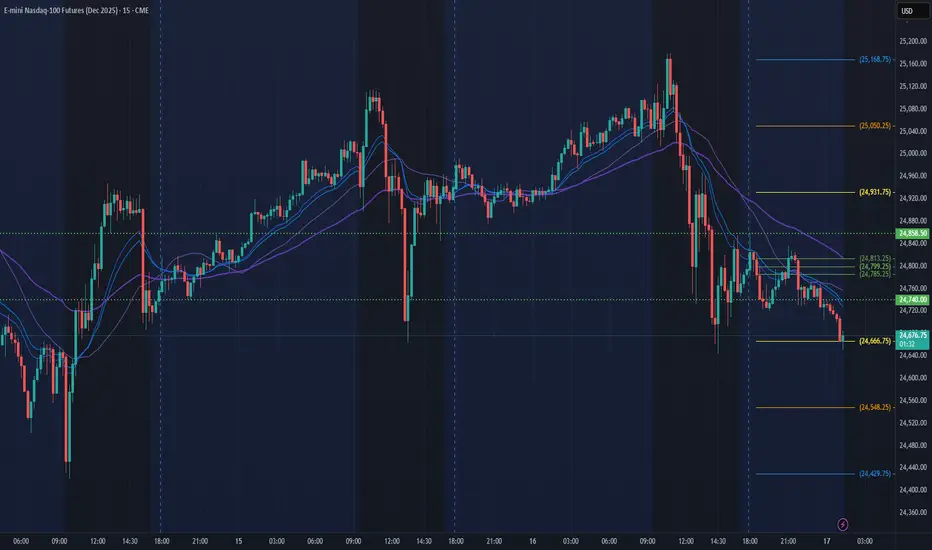
Target areas - NQ price for Market open.10/17/25 - These are the target areas - NQ price for Market open depending if price moves up or down. Will look for trades into these areas.

NQ Power Range Report with FIB Ext - 10/17/2025 SessionCME_MINI:NQZ2025
- PR High: 24858.50
- PR Low: 24740.25
- NZ Spread: 263.5
Key scheduled economic events:
08:30 | Nonfarm Payrolls
- Average Hourly Earnings
- Unemployment Rate
Session Open Stats (As of 12:45 AM)
- Session Open ATR: 391.21
- Volume: 43K
- Open Int: 283K
- Trend Grade: Long
- From BA ATH: -2.7% (Rounded)
Key Levels (Rounded - Think of these as ranges)
- Long: 26020
- Mid: 23571
- Short: 21939
Keep in mind this is not speculation or a prediction. Only a report of the Power Range with Fib extensions for target hunting. Do your DD! You determine your risk tolerance. You are fully capable of making your own decisions.
BA: Back Adjusted
BuZ/BeZ: Bull Zone / Bear Zone
NZ: Neutral Zone
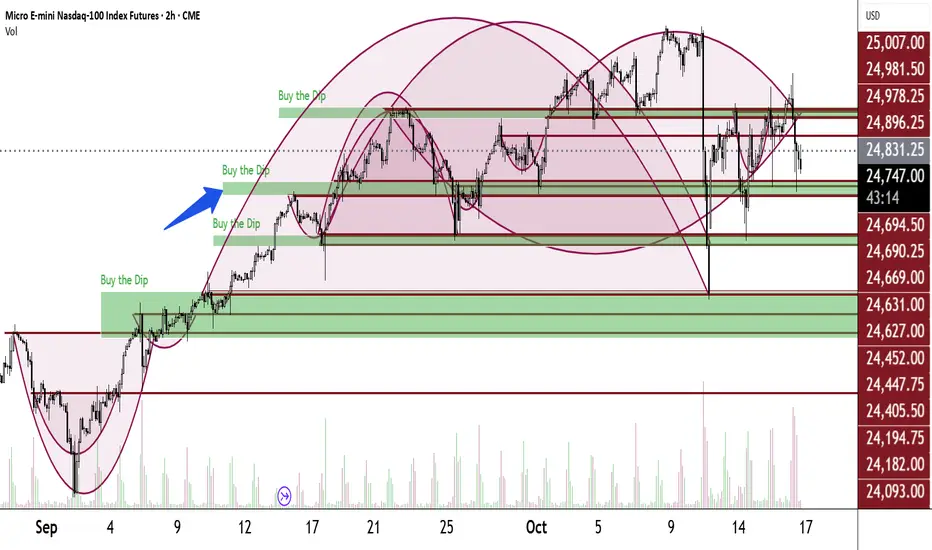
Cup ComplexA different view. It's easy to see strong support and resistance on this chart.
The horizontal lines are cup rims. Where they congregate you will meet buyers and sellers.
When the PX comes down to a green Buy the Dip area and bounces I buy back a Pawn and start a new Pawn for a King trade. Typically, I will only buy it back if I get a minimum 200-point pullback.
Today I bought back several Pawns in the indicated area and pocketed $$$. I'm still holding several in case the PX goes lower. I also pocketed $$$ from the Breakout aspect of A Pawn for a King trade plan.
This is how it works -when it bounces, above the high of the bounce I sell one Pawn and Buy two Kings. Whether the PX goes up or down I will profit. As a bonus, I also pocket $$$ from BTD trades and Pivot trades.
I nearly always have several A Pawn for a King trades going on. Today I started a new one @ 12:50:35. Using a 2/1 ratio, I bought 2 @ 24840 and sold 1 @ 24839.5. Using a 19.5-point profit target, I had 7 profit-taking trades. (I also had 15 additional profit-takers earlier in the day, all from A Pawn for a King trade plan.)
The PX pulled back and I started a 2nd Pawn for a King trade. I sold 1 @ 24759.5 @ 14:43:41 and bot 2 @ 24760 @ 14:43:42. Using the same 19.5-point profit-taker I pocketed 4 more. .5 points above each profit-taker I buy 2 more. I climb the profit-ladder all the while having a Pawn to buy back. I try to get a 200-point pullback and bounce before buying back a Pawn. Sometimes I get more. Sometimes less (but not much less).
I hope all this detail doesn't make it sound complicated. It's not. It is very simple. Demo trade it and see for yourself.
For these trade plans view my prior published ideas. Make them yours. Demo trade them. Get good at them.
It's a very simple, profitable plan.
My mind glazes over when I write numbers. Hope I wrote them all correctly. If I flubbed, forgive me.
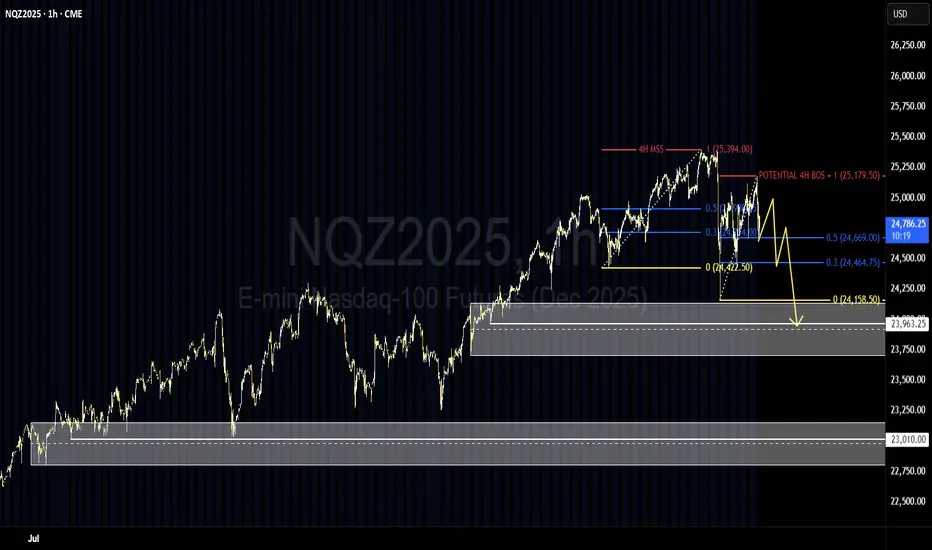
NQ 4H MSS and setting up for a potential 4H BOSWe’ve confirmed a 4H bearish market structure shift (MSS) and appear to be setting up for a bearish break of structure (BOS).
I’m watching for short setups on my entry timeframes — so far, the cleaner days have offered solid opportunities. I’m keeping my focus on scalps, as the market remains heavily news-driven, but I can’t shake the sense that a key event could trigger a liquidity sweep of the lows.
That said, this could just as easily be another classic NQ pullback before a strong recovery. I trade what’s in front of me, but this is my higher-timeframe perspective built from my lower timeframe analysis.
Time will tell…
NQ: 271st trading session - recapI was hella tired but we still ended up having a great session. It is really just about staying patient and stuff...
Forty Years in the WildernessWe'll get to The Promised Land. Winnowing happens. It purges the chaff.
Of traders it is said that it ''shakes out weak hands.''
We know how to read charts, manage margin and we have four trading plans. We are the grain, the staff of life, that remains after the winnowing.
Familiarize yourselves with the four trading plans I have published. Practice them. Become proficient with them.
There is great potential in the chart you are viewing.


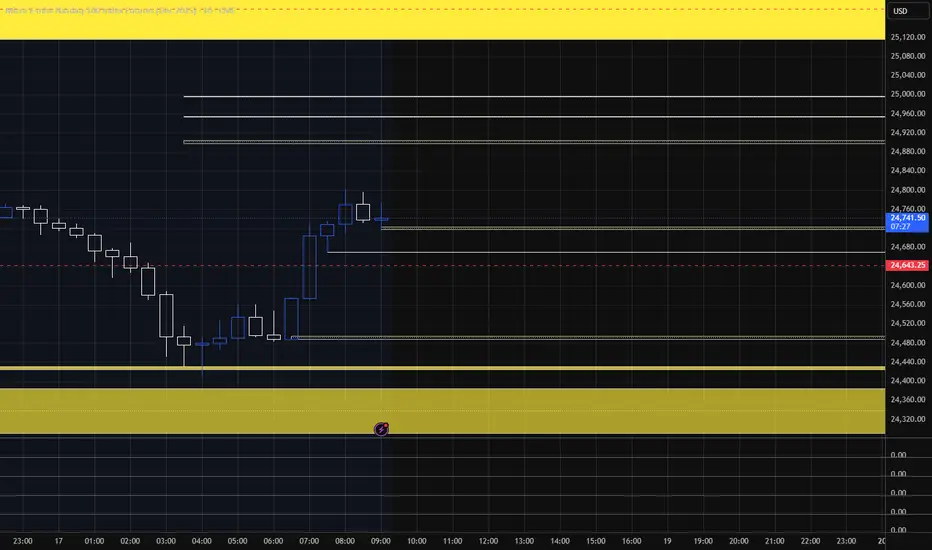
NQ - 10/16The red box is yesterday's candle showing the high, median and low range.
within the daily candle is a 15min ladder that creates a 1hr FrontSide(FS) level in yellow.
The Inv,FS in blue above price is the 15min resistance level.
Inv. stands for Inverse. They are the inverse of the other levels labels BS or FS.
BS or FS = support levels unless marked as a solid line.
Inv.BS or Inv.FS = resistance unless marked as solid line,
The grey box is last week high, median and low range.
The green lines are some 5min timeframe levels.
