NQ Targets (09-29-25)Moving into October, 7 week range forecast. Basically, 23,050 is 50% retracement of YTD lift. Looking for a retest of that, no hold and keep going to the YTD Open or circle below (yellow arrow path). White arrow path has two targets, these are potential drop/rejection zones (to yellow arrow path). KL 24,950 is ML of TZ, we have played in lower half and may see some play in upper half. Sideways to lower during this 7 week period is the idea.
Trade ideas

NQ Range (11-10-25, Week 7)The 7 week Forecast is in the final week and we are up about 300 points after getting rejected at upper Target. NAZ back in the Churn Zone and did U Turn off Friday lows just under the Mid Level CZ. KL 483 is TZ to 25,333. Key fact is the NAZ and NDX are at long tern TL. Under the TL is Danger Zone to lower CZ and then TLX 24,056. Current range to watch is 25,333 and 24,817. Friday lift was Failed Auction up and these usually will get retested. Could be a start of a U Turn (that will drop and retest). Or, just another Friday pump drop offset that will trap the BTD/FOMO's.

NQ1 - Bullish Whipsaw = Dip Buys In Choice StocksNasdaq just printed a big bullish whipsaw on the 4 hour chart to tap liquidity below support and rebound back up.
This is quite a significant bullish signal.
It is lower time frame so we will need to see it hold and it may chop around...
But in this area is where we're likely to see bullish recoveries and breakouts in choice stocks and even crypto 🧐.


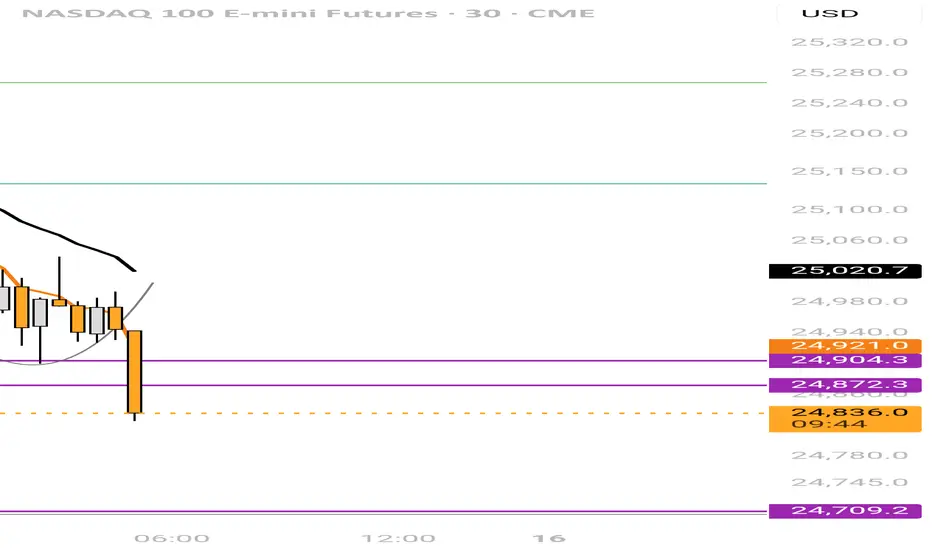
"It's Me Again, Margaret"Ajax, aka Monster Head & Shoulders, is back again. He has been dominating our charts since 9/16.
His neckline: 24680
Buy the Dip area 1: 24640 - 24570
Buy the Dip area 2: 24550 - 24500
Pullbacks are a normal part of bull markets. We are ~4% off the high. Correction territory is 10% or more. As Day Traders we welcome pullbacks as opportunities to trade the same Px zone at least one more time.
This one is due to the govt. shutdown and the resulting lack of economic data as well as the economic losses, profit taking after the Dow posted two all-time highs in a row, and concern about over valuation especially of tech stocks.
All a normal and healthy part of the markets.
One major attraction of the Nasdaq 100 to us as day traders are its big swings. It gives more opportunity for Px action and profits than the other markets.
He has a new Breakout Ladder set @ 24770. every 20 points he will buy 1 contract. Each and every target will be 19 points.
Above you can see the BTD areas. This neckline may turn out to be a good BTD area. I'd wait until at least 09:50 NY Time before placing a BTD trade above the green shaded BTD areas.
From 9/16 to the present this support zone has been a very important one. Let's see if it holds.

NQ1Here is a couple of possibilities: If we can bounce here at the diagonal green line then it will be making a higher low to continue the uptrend.
However, the green horizontal line is the neck line @ 24,119 for a possible head and shoulders pattern or a double bottom...either way it should bounce there... but we will have to wait for pattern development.

NASDAQ FALL!Perfect Liquidity Hunting on going!
Tap on the buy side Liquidity and moving for the Sell side.

Liquidity Hunting On!A perfect drop post buy side Liquidity Hunting now going for the sell side Liquidity.
NQ Power Range Report with FIB Ext - 11/14/2025 SessionCME_MINI:NQZ2025
- PR High: 25151.75
- PR Low: 25087.75
- NZ Spread: 143.0
No key scheduled economic events
Session Open Stats (As of 12:55 AM)
- Session Open ATR: 439.51
- Volume: 47K
- Open Int: 302K
- Trend Grade: Long
- From BA ATH: -5.1% (Rounded)
Key Levels (Rounded - Think of these as ranges)
- Long: 26636
- Mid: 25410
- Short: 24039
Keep in mind this is not speculation or a prediction. Only a report of the Power Range with Fib extensions for target hunting. Do your DD! You determine your risk tolerance. You are fully capable of making your own decisions.
BA: Back Adjusted
BuZ/BeZ: Bull Zone / Bear Zone
NZ: Neutral Zone
Trade in Crude Oil and the Geopolitical Impact on Prices1. How Crude Oil Is Traded Globally
Crude oil is traded through two primary markets: physical markets and futures markets.
Physical Market (Spot Market)
In the physical market, oil is bought and sold for immediate delivery. Key players include:
National Oil Companies (NOCs) like Saudi Aramco, ADNOC, and Petrobras
International Oil Companies (IOCs) like ExxonMobil, BP, Chevron
Refiners, traders, and governments
Physical trades depend on:
Quality of crude (light, heavy, sweet, sour)
Logistics and transportation availability
Supply contracts and long-term agreements
Physical prices often follow benchmark indexes such as Brent, WTI, and Dubai/Oman.
Futures Market
This is where the financial side of oil trading happens. Futures contracts traded on exchanges like CME (WTI) and ICE (Brent) determine global reference prices.
Participants include:
Producers and refiners hedging future production or fuel needs
Speculators and hedge funds betting on price direction
Banks and financial institutions providing liquidity
Futures are influential because they signal market expectations based on supply, demand, storage levels, interest rates, and—critically—geopolitics.
2. Key Drivers of Crude Oil Prices
Crude oil prices are shaped by multiple fundamental factors:
Global supply and demand dynamics
Production output decisions by OPEC+
US shale production changes
Inventory levels in the US and OECD
Currency movements (especially USD)
Transportation bottlenecks and shipping rates
But none of these drivers create sudden or extreme price movements the way geopolitics does.
3. Geopolitical Forces That Influence Oil Prices
A. Wars and Conflict Zones
Oil prices react instantly to conflicts in or near major producing regions.
Middle East
The Middle East, home to over 50% of global reserves, is the most crucial geopolitical hotspot. Conflicts involving Iran, Iraq, Saudi Arabia, Israel, or Yemen can create fears of supply disruption, leading to rapid price spikes.
Examples include:
Gulf War (1990–91)
US–Iran tensions
Attacks on Saudi Aramco facilities
Hamas–Israel conflicts
Even if physical supply remains unaffected, the risk premium added by traders is enough to lift prices sharply.
Russia–Ukraine War
Since Russia is a major crude and gas exporter, the Ukraine conflict reshaped global energy trade. Sanctions, embargoes, and shipping restrictions caused significant volatility.
Europe’s shift away from Russian crude forced new trade patterns, empowering Middle Eastern producers and raising shipping costs.
B. OPEC and OPEC+ Decisions
The Organization of the Petroleum Exporting Countries (OPEC), along with Russia and allies (OPEC+), controls around 40% of global crude supply.
OPEC decisions to:
Cut production → Prices rise
Increase output → Prices fall
Geopolitical relationships inside OPEC—Saudi Arabia vs. Russia, Iran vs. Saudi Arabia—often shape these decisions. Market participants follow OPEC announcements closely during ministerial meetings because even a small surprise in production quotas can trigger double-digit price moves.
C. Sanctions and Trade Restrictions
Economic sanctions are one of the most powerful geopolitical weapons in oil markets.
Countries frequently targeted include:
Iran – sanctions limit exports
Russia – price caps and bans affect shipments
Venezuela – political instability limits production
When sanctions reduce supply from large producers, global prices usually rise. Conversely, when sanctions are eased or removed, prices fall as supply enters the market.
D. Shipping Routes and Chokepoints
Oil transportation passes through vulnerable chokepoints. Any threat to these routes impacts prices immediately.
Major chokepoints include:
Strait of Hormuz – carries 20% of global oil
Suez Canal and SUMED Pipeline
Strait of Malacca – key Asian route
Bab-el-Mandeb near Yemen
Geopolitical tensions—such as piracy, military blockades, Houthi rebel attacks, or naval confrontations—can disrupt shipping or increase insurance premiums, raising crude prices.
E. Elections, Regime Changes, and Political Instability
Elections in major producers can influence price direction.
United States
US presidential elections often create uncertainty regarding:
Drilling policies
Strategic Petroleum Reserve (SPR) releases
Environmental regulations
Shale oil investment
Middle East & Latin America
Regime changes in oil-rich countries like Iraq, Libya, Nigeria, or Venezuela can impact production stability and investor confidence.
Political uncertainty generally increases the volatility of oil prices.
F. Climate Policies and Energy Transition Geopolitics
Global climate policies also have geopolitical effects on crude markets:
Carbon taxes raise production costs
Subsidies for renewables reduce oil demand
Restrictions on exploration affect long-term supply
Countries like Saudi Arabia are diversifying toward renewables, while others like Russia depend heavily on fossil fuels. This creates political tensions over climate agreements, indirectly impacting crude markets.
4. How Traders React to Geopolitical Events
Traders incorporate geopolitical risks into their strategies in multiple ways.
Risk Premium
When tensions rise, traders add a risk premium, lifting futures prices even without actual supply disruption.
Flight to Safety
Geopolitical risks often push investors toward safer assets like gold and US Treasuries. Oil prices can rise or fall depending on:
Whether supply is threatened
Whether demand is expected to drop due to recession fears
Speculative Volatility
Hedge funds use algorithms and strategies that react to news headlines, increasing short-term volatility.
5. Case Studies of Geopolitical Impact
Saudi Aramco Drone Attack (2019)
A coordinated drone attack in Saudi Arabia shut down 5% of global supply overnight. Brent crude spiked nearly 20%. Prices later stabilized, but the event showed how vulnerable global supply chains are.
Russia–Ukraine War (2022)
Fears of supply shortages drove prices above $120 per barrel. Sanctions reshaped global trade flows, and Europe struggled to find alternatives.
Israel–Hamas Tensions
While Israel is not a major producer, instability in the Middle East creates a psychological risk premium.
6. Conclusion: The Future of Crude Oil Prices in a Geopolitical World
Crude oil will remain deeply affected by geopolitics for decades. As global tensions persist—from Middle Eastern conflicts to US-China rivalry—oil prices will continue experiencing rapid, unpredictable swings. While long-term trends like energy transition may reduce dependence on oil, geopolitical events will still dominate short-term price movements.
NQ UpdateBoth MFI and RSI hit oversold, and there is a gap above. There's also the TACO gap below though.
I figure we get a bounce off the blue line either way.

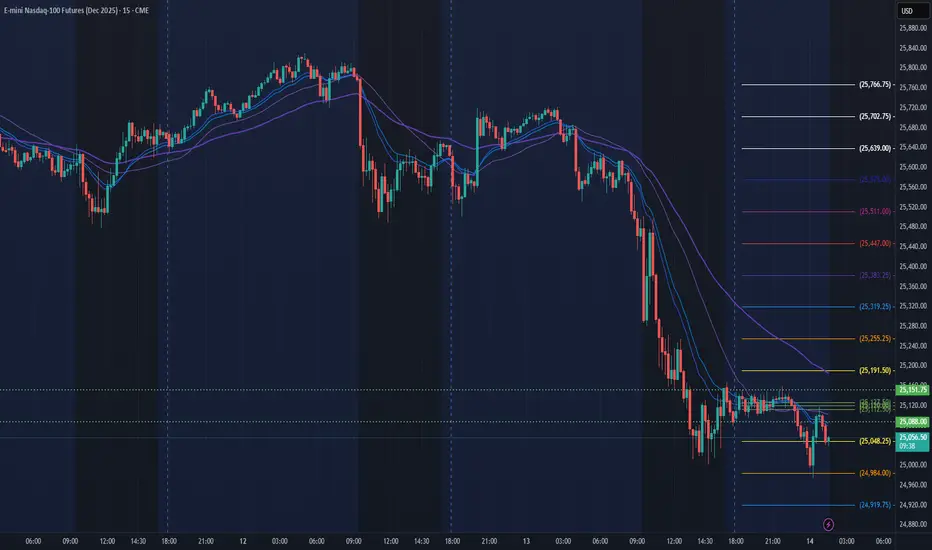
NQ Daily Outlook | November 13, 2025Most likely direction: Bearish
Scenarios:
1. Bearish Continuation (Primary):
Price stays below the 5/10 EMAs and the black 50 EMA.
We form another lower high
EMAs continue pointing down
A new BOS down sends price lower
This favors continuation shorts for the session.
2. Pullback Higher → Then Down (Alternate):
Price may push into a deeper pullback first, tapping into the EMAs or even the 50 EMA.
As long as the EMAs are above price
And no BOS up forms
It remains a pullback within the downtrend, and sellers can step in again for another leg lower.
Not financial advice.

NQ to Retest low before going back up I have been watching trading NQ alot lately and here is my prediction for the next moves.

NAS100 - Head and ShouldersWithout a doubt, a Head and Shoulders according to the bullish channel, RSI in oversold territory, looking ahead to the Year-End rally...


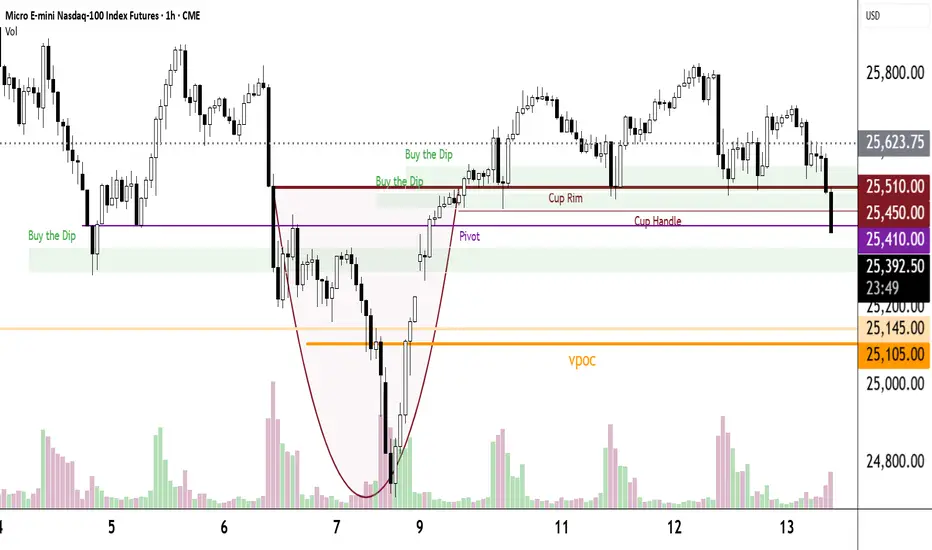
"Get Up Offa That Thing"James Brown 1976 Funk
Get up offa the shutdown.
Get up offa the dance floor.
Today's Dance Floor is 25510.
Hmmm...What's happening? He thought we would have seen a much bigger bounce last night when the shutdown ended.
Today's key landmarks are clearly seen.
Buy the Dips
***Wait for a bounce
***He simply waits for a Bullish white candle.
***Then he looks for a bit of support, your choice, whatever you are comfortable with.
***In 5-point increments from there to the low of the bounce he buys 1 MNQ
***Each entry has a 21-point target.
If you are more conservative, tailor it to your trading style. He especially likes a White Bull preceded by an Exhaustion Candle @ a Prior Day Close.
No stops allowed.
Sometimes the Px falls through the floor. Keep some dry powder for that event.
Repeat the process for the next BTD area.
This plan is a $$$ maker.
Don't forget Breakouts, A Pawn for a King, Pivots & Jokers.
Daily FVG in the crosshairAfter taking out Monday's high, price rejected the premium daily wick and re-entered the NWOG range. There is a big bearish candle on the day therefore making the previous daily lows highly probable targets.

NQ Short (forced trade)Well, this is a forced trade opp. It means that iam not very sure but i would take this opp anyways.
Here are my two cents. ES looks bullish to me, while NQ is bearish. Which is something odd.
Anyways, here is the trade. Be careful taking it with size, because iam very well could be wrong.
Good luck everyone!!

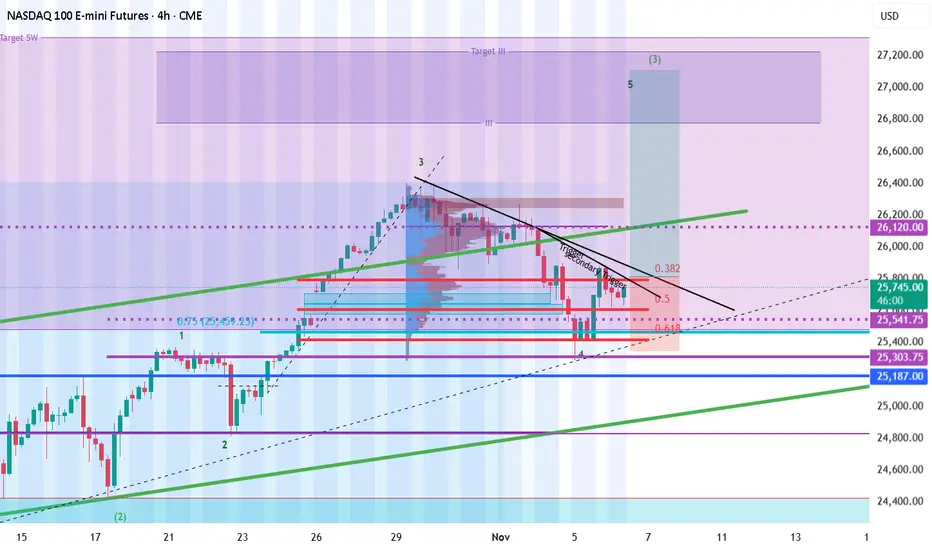
Nasdaq - potential trigger Break for a long targetNasdaq - potential trigger Break for a long target
We are at final point of rebound
We can have a potential 5 wave so, if price will break trigger zone we can have final long wave.
NQ Power Range Report with FIB Ext - 11/13/2025 SessionCME_MINI:NQZ2025
- PR High: 25635.25
- PR Low: 25501.50
- NZ Spread: 299.25
Key scheduled economic events:
08:30 | CPI (Core|MoM|YoY)
- Initial Jobless Claims
13:00 | 30-Year Bond Auction
Session Open Stats (As of 12:25 AM)
- Session Open ATR: 423.22
- Volume: 52K
- Open Int: 296K
- Trend Grade: Long
- From BA ATH: -2.7% (Rounded)
Key Levels (Rounded - Think of these as ranges)
- Long: 26636
- Mid: 25410
- Short: 24039
Keep in mind this is not speculation or a prediction. Only a report of the Power Range with Fib extensions for target hunting. Do your DD! You determine your risk tolerance. You are fully capable of making your own decisions.
BA: Back Adjusted
BuZ/BeZ: Bull Zone / Bear Zone
NZ: Neutral Zone
NASDAQ 100 (NQ1!): Time To Buy This Dip? Oh Yeah!Welcome back to the Weekly Forex Forecast for the week of Nov. 10-14th.
In this video, we will analyze the following FX market: NASDAQ (NQ1!) NAS100
The NASDAQ pulled back after rallying for weeks! We patiently waited for a dip buying opportunity to form. Well, Friday might have given us the indication of an end to the pullback... and the opportunity to buy the dip may be upon us!
Wait for the shift in the market structure from bearish to bullish to form... then look for your
valid long setups.
Enjoy!
May profits be upon you.
Leave any questions or comments in the comment section.
I appreciate any feedback from my viewers!
Like and/or subscribe if you want more accurate analysis.
Thank you so much!
Disclaimer:
I do not provide personal investment advice and I am not a qualified licensed investment advisor.
All information found here, including any ideas, opinions, views, predictions, forecasts, commentaries, suggestions, expressed or implied herein, are for informational, entertainment or educational purposes only and should not be construed as personal investment advice. While the information provided is believed to be accurate, it may include errors or inaccuracies.
I will not and cannot be held liable for any actions you take as a result of anything you read here.
Conduct your own due diligence, or consult a licensed financial advisor or broker before making any and all investment decisions. Any investments, trades, speculations, or decisions made on the basis of any information found on this channel, expressed or implied herein, are committed at your own risk, financial or otherwise.

NQ Short opportunityBased on TA, i see a shortBased on the market structure, there are few unmitigated orders that are not filled which needs to be tapped into before covering the gap formed below. Daily TF, there is a WICK CE available to get retraced into

NQ Daily Outlook | November 12th, 2025Most likely direction: Up (bullish)
Why:
Trend is still up on my read of structure.
NY session pulled back deeper than expected and slipped under the black 50 EMA.
I see it as a correction within the trend. I expect price to reclaim and trade back above the EMAs and continue higher.
Scenarios:
Preferred — Reclaim and continue: We push back above the EMAs, they curl up, and we get a break of structure to the upside. I’ll look to join on the first clean impulse → shallow correction → continuation above the EMAs.
Retest then go: We dip a bit more, hold a higher low, then reclaim the EMAs. Once BOS up prints and EMAs fan upward, I lean long again.
Bear alt: We stay trapped under the 50 EMA, fast EMAs roll over, and we print a BOS down (lower low). If that happens, I step back or treat it as range-to-down for the day.
Bias:
Bullish while we can reclaim and hold above the EMAs with upside BOS.
If EMAs stay above price and structure flips down, I’ll pause the long idea.
