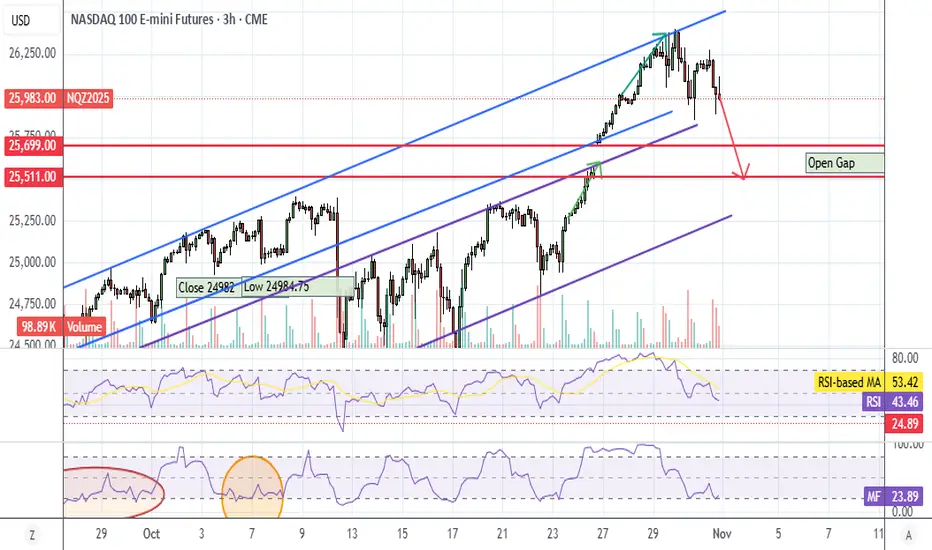
NASDAQ (NQ1!) – Bearish Divergence Potential PullbackOn the 1-hour chart, a clear bearish divergence has formed at recent highs, aligning with loss of bullish momentum and price rejection near the upper trend channel. The short-term structure suggests sellers may gain control, with potential retracement zones around the 0.5–0.618 FIB levels and an unfilled GAP below.
If price confirms continuation after a minor relief bounce, we could see a corrective wave unfold before the broader uptrend resumes.
Bias: Short-term Bearish – looking for retracement opportunities toward key support levels before potential trend continuation.
Trade ideas

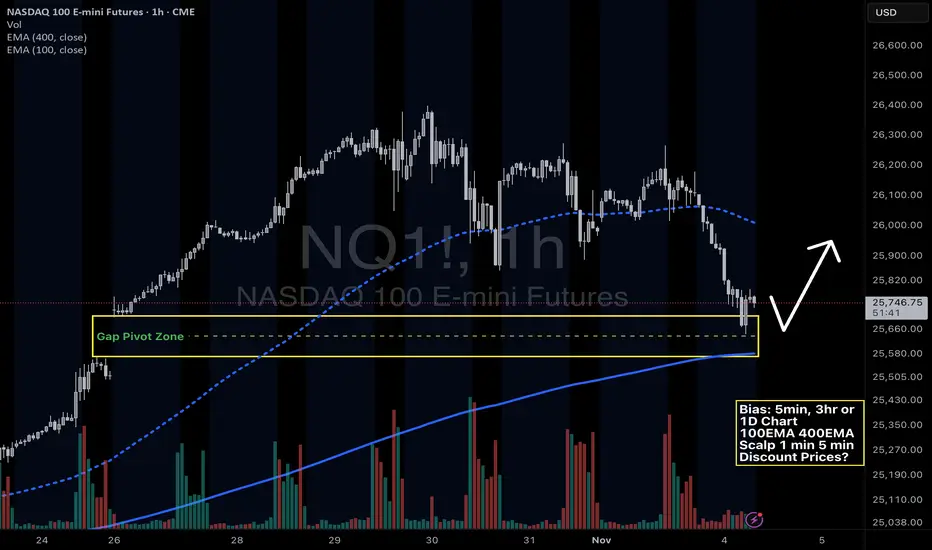
Nasdaq NQ - tapping into previous Gap Pivot ZoneNQ -Nasdaq Futures- pulled all the way back to the previous Gap up zone from October 26, 2025. Also, confluence with the 1 hour 400 EMA. Does this signal a bounce opportunity? Or does this signal that there will be a major news event that will occur? Is the market predictive of real life?
NQ - LONG SETUPAfter a rally, I waited the price comes back to the gap. After the rejection, I executed the trade and used the same gap to protect my stop loss. It was a 50% retracement.

Will History Repeat Itself? NASDAQ 2025 vs 2020The NASDAQ 100 is currently showing a striking structural symmetry to the 2020 pre-crash formation.
Both phases formed a 5-wave impulsive rally, followed by tight consolidation near highs — a typical distribution top pattern.
The 20-day EMA is starting to flatten, signaling a possible loss of momentum.
If symmetry continues, the index could mirror a short- to mid-term correction, similar to early 2020’s breakdown.
While macro conditions differ today, market behavior often repeats in fractal patterns — a reminder that price structure often precedes headlines.
📊 Keep watch for a confirmed EMA rollover and breakdown below support near 25,500 — that could validate the bearish symmetry.

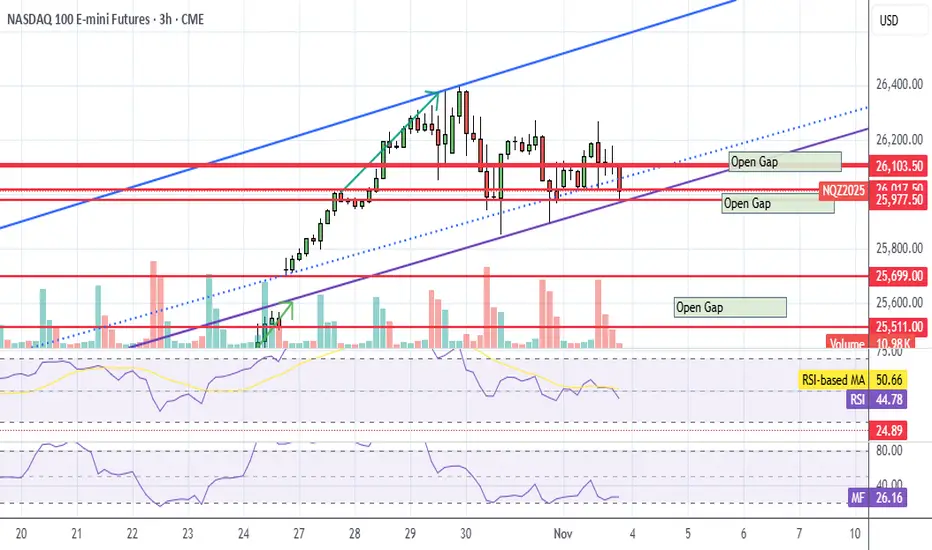
NQ UpdateNQ left an open gap after the break, so now we have one above and two below. Quite frankly, there's too much whipsaw to be trading options so I'm taking a break.
I may or may not be posting updates.
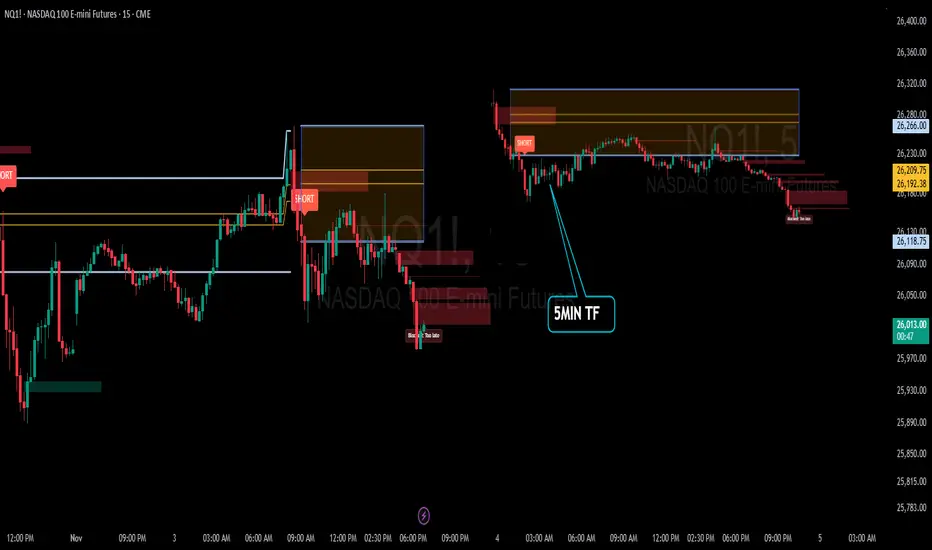
Recap: ORB Pro in Action | “Discipline > Direction”Date: November 3rd 2025
Ticker: QQQ / NQ1! (5-min TF)
Strategy: ORB Pro + Golden Pocket Retest + Volume Filter
Focus: Trend confirmation & controlled execution
🧭 Market Context
The morning opened sideways inside the ORB range — no clean conviction early on.
Around mid-morning, sellers gained control as lower highs formed beneath the EMA band and the Golden Pocket retest (0.5/0.618) failed with volume confirmation.
That break produced the clean short setup of the day, perfectly aligned with the higher-timeframe (HTF) downtrend.
🧠 Trade Review
Early Entries: Entered pre-confirmation and took initial heat.
Mid-Morning Setup: All filters aligned — EMA, volume, HTF direction. This was the textbook short that delivered follow-through.
Late Session Attempts: Momentum faded after lunch, with signals correctly blocked as “Too Late.”
Result: Several small wins offset by early losses, closing the day + $7.34 realized P/L after fees.
📊 Performance Snapshot
Metric Value
Win Rate ≈ 42 %
Best Trade + $287.94
Largest Loss – $189.05
Net Result + $7.34 (Realized)
Setup Accuracy High — execution mixed
📈 Chart Breakdown
The 5-minute chart highlighted a short trigger around 26 260 – 26 280, with smooth continuation into ORB extensions.
The ORB Pro filter marked “Blocked / Too Late” after the move — confirming that the system logic protected capital from late chases.
💡 Key Takeaways
Patience > Prediction — early entries rarely pay off.
Protect Green — partial profit lock once 1 R:R is reached.
System Strength — ORB Pro continues to validate structure when filters align.
🧘♂️ Reflection
“The system nailed the move — I jumped early. Still finished green, proving that execution discipline is the real edge. Tomorrow’s goal: one clean setup, one confident hold, and protect the profit.”
🧩 Next Steps
✅ Wait for full confirmation before entry
✅ Hold until 1:2 R:R min
✅ Avoid re-entries once HTF zone is tapped
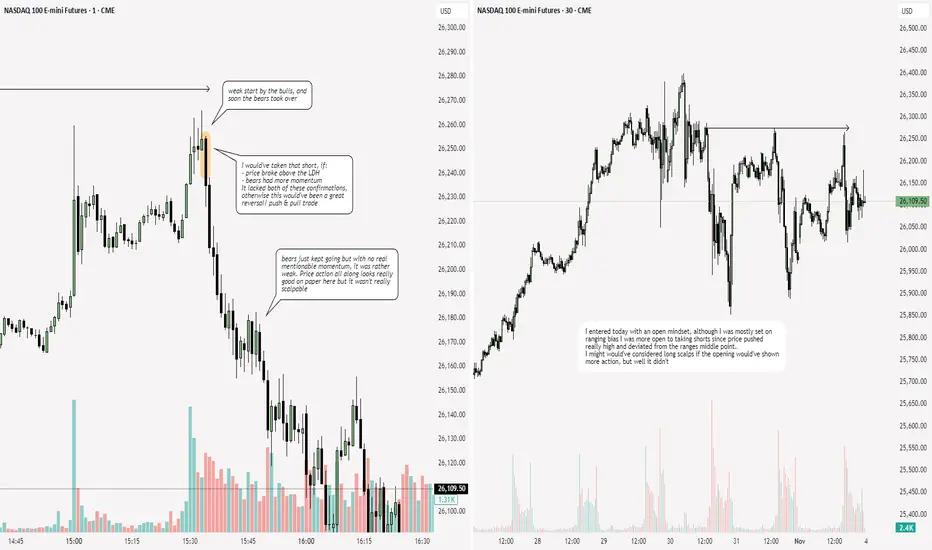
NQ: 280th trading session - recapWas pretty cool today, not really any scalpable price action but there were some moments that looked really good...

"Stand by Me"Ben E. King, 1961. Classic Soul, Rhythm & Blues. Inspired by a popular gospel hymn of the South, same title.
Your author wanted to show a clean trading chart, and he also wanted to show his "Stand by Me" chart with its many supports and resistances.
He always trades from a clean 5minute chart. He simply clicks the hide button on & off.
If you switch to a 5m chart and you follow his trading plans you know he "bot" the Dip from 26110 - 26085. He also "bot" the Dip from 26060 - 26010.
You know he is nearly always Long and Short. He "would have" already pocketed much profit from 11.2 open to 11.3 10:15 - the first BTD entry.
You would also know he "started" a new Pawn for a King sequence selling 1 Pawn @ 26079.50 & buying 2 Kings @ 26080.00.
What's up with the quotation marks? Thrice this year he has been flagged as a national security risk. Twice he has been deplatformed and twice his trading account seized. This third time he pulled his account before it could be seized once again, & he deplatformed once again.
Adokimos is the Greek word Paul used in Rom.1:28 to describe our present society. It's a form of insanity. A society that declares itself autonomous from Eternal Truth always ends up here. Such a society perverts good and evil to such an extent that it punishes good and exalts evil.
We do have the best form of human government ever conceived - the culmination of millennia of Judaism and Christianity. We do get the government we deserve. When we choose to throw off self-government, i.e. virtue, we end up with Nihilism, Adokimos, our present society.
John Adams, one of our founding fathers, is well-known for having written, "Our Constitution was made only for a moral and religious people. It is wholly inadequate to the government of any other." Regarding self-government, i.e. individuals governing their behavior by Judeo-Christian ethics, he wrote, "The only foundation of a pure Constitution is pure virtue." "When public virtue is gone, when the national spirit is fled, the republic is lost in essence, though it may still exist in form." "The Declaration of Independence laid the cornerstone of human government upon the first precepts of Christianity."
On this, the eve of the New York mayoral election, Adams wrote this - "...poets read history to collect flowers not fruits - they attend to fanciful images, not the effects of social institutions."
There is so much that is just, pure and virtuous that our founding fathers have left us that many volumes have been written and, unfortunately, rejected by our present society. I will end with this quote from Adams, "The jaws of power are always open to devour, and her arm is always stretched out, if possible, to destroy the freedom of thinking, speaking, and writing." And I shall add - Trading. Adokimos.

3rd trade of the day.3rd trade, just seeing stuff as it comes up. It looked bullish and made sense so we excecute.

Part 2 NWOG saves the dayPart 2 of my short, we renter short. Simple stuff really, NWOG is a black hole.

Long trade
📘 Trade Journal Entry
Pair / Symbol: MNQ1! (Micro E-Mini Nasdaq-100 Index Futures)
Direction: Buy-Side Trade
Date: Mon 3 Nov 25
Time: 1:00 am
Session: London Session AM
Timeframe: 1 Hour
🔹 Trade Details
Metric Value
Entry 26,057.50
Profit Level (TP) 26,390.50 (+1.28 %)
Stop Level (SL) 26,004.00 (–0.21 %)
Risk–Reward (RR) 4.36 R
🔸 Technical Context
Market Structure:
The index has been consolidating after a prior impulsive up-leg from mid-October.
A liquidity sweep below the 26,000 handle and BOS on lower time frames confirmed short-term accumulation.
15min TF Overview
Confluence Factors:
KAMA (Kaufman Adaptive MA) has flattened and begun to curl upward — early momentum shift.
Volume Expansion: Spike during the London open, suggesting institutional re-entry after the weekend gap. Intraday PD Array Alignment: Demand zone and VWAP cluster at 25,980–26,020 confluence zone. Session Overlay: Previous NY session lows have been taken out; London reclaim confirms buyside intent.
Key Zones:
Demand Base: 26,000 – 26,030
Target Zone: 26,380 – 26,400 (liquidity resting above prior London swing highs)
Extended Target: 26,790 (1.618 fib projection of current impulse)
🔹 Narrative & Bias
The setup reflects short-term accumulation within the broader bullish structure, consistent with rotation back into tech futures as the USD consolidates.
The 26,000 psychological level acted as a liquidity magnet — price swept stops, reclaimed structure, and produced a bullish displacement candle.
Macro Sentiment:
Renewed optimism in the Q4 earnings cycle; U.S. indices stabilising post-CPI data.
NASDAQ is outperforming due to sector rotation into large-cap growth (AAPL, ZS, NVDA correlation).
Projection:
Expect price to continue toward 26,390–26,400, with a partial profit zone near the prior swing high and potential continuation to the 26,780 1.618 extension if NY session momentum follows through.


NQ1 - Bullish OpenIndexes looking fine to start the week.
Nasdaq has had plenty of chop post interest rate cut, but its been quite tame to print a descending expanding pattern - likely to be bullish but perhaps with some more chop in the pipeline.
Let's see how regular trading hour indexes open 🧐.
This analysis is shared for educational purposes only and does not constitute financial advice. Please conduct your own research before making any trading decisions.

Possible price forecast, roadmap MNZQ2025 3-7 Nov 25The price will be continue with bearish action the main target will be $ 25855 please be cautious do not trade on Thursday and NFP news

NASDAQ 100 (NQ1!): Bullish! Buy This Dip!Welcome back to the Weekly Forex Forecast for the week of Nov. 3 - 7th.
In this video, we will analyze the following FX market: NASDAQ (NQ1!) NAS100
The NASDAQ reached all time highs last week, then started a pullback, landing in a +FVG.
As the +FVG continues to hold, look for valid buy setups to form.
Sells are not valid, my friends. Go with the trend!
Enjoy!
May profits be upon you.
Leave any questions or comments in the comment section.
I appreciate any feedback from my viewers!
Like and/or subscribe if you want more accurate analysis.
Thank you so much!
Disclaimer:
I do not provide personal investment advice and I am not a qualified licensed investment advisor.
All information found here, including any ideas, opinions, views, predictions, forecasts, commentaries, suggestions, expressed or implied herein, are for informational, entertainment or educational purposes only and should not be construed as personal investment advice. While the information provided is believed to be accurate, it may include errors or inaccuracies.
I will not and cannot be held liable for any actions you take as a result of anything you read here.
Conduct your own due diligence, or consult a licensed financial advisor or broker before making any and all investment decisions. Any investments, trades, speculations, or decisions made on the basis of any information found on this channel, expressed or implied herein, are committed at your own risk, financial or otherwise.

#202544 - priceactiontds - weekly update - nasdaq e-mini futuresGood Evening and I hope you are well.
comment: Two red days to end the month but until the giant gap down to 25350 is closed, nothing matters for the bears. Only below that price we can think about getting down to the bull trend line around 24800 but for now we are 400 points below the ath and the mania continues. I firmly believe the move from 24933 to 26399 was the blow-off-top but no one can tell until we completely reverse it.
current market cycle: bull trend
key levels for next week: 24800 - 26500
bull case: Every dip is heavily bought, even dips so small, you can not even see them properly on the daily chart. Full on fomo in the last inning of this. Only a complete AGI/proper lvl5 self driving can convince me otherwise. This is ‘99 all over and for sure we will get an amazing Michael Lewis book about this. Bulls remain in control until we completely reverse the last move and print below 24800 again. Every short is low probability but great r:r.
Invalidation is below 24900.
bear case: We will most likely test the bigger bull trend line again. As of now, the price action shows nothing bearish. Market is driven by a hand full of stonkz but at this point, no one cares because it’s only going up. No measure of excess matters because the snake-oil salesmen just make up new ones. Again. Nothing about the chart is bearish and until we at least close the gap down to 25350, we can not even think about getting confident about shorts. Yes it’s overbought, overdone, a bubble, whatever have you. Does not help with making money shorting this one bit. Wait.
Invalidation is above 26500.
short term: Neutral.
medium-long term - Update from 2024-11-02: Market went further in the wrong direction so my targets become increasingly unrealistic. Right now the 50% retracement is 21750 and would mean a 18% drop. That’s a bit too much to ask for as of now. 23150 is the breakout-retest of the prior ath from 2024-12 and a more realistic target.

NASDAQ this is my opinion for the week not an advice I hate ath price action but I think it will be better when we start q1 next year
be safe trade good don't burn money and be patient the most important! follow your rules

Potential ShortFriday Price pulled back into 26065 and rejected and started to push back to the downside so I do believe that price could go down and close up the FVG and could push lower.

Full Market Cycle Analysis for Nasdaq E-mini Futures (NQ) 11/3Price Action Confirmation & Levels to Watch
Key Levels:
26,200 and 26,150 (major inflection/guard lines per recent market structure)
25,950 and 25,675 (cycle lows, reversion zones)
Breakout Confirmation:
Watch for price action around 26,150–26,170: best risk/reward short setup triggers if price retests and rejects this zone.
Stop Loss: Place above 26,205 for intraday shorts (tight risk discipline).
Initial Target: 500 pts lower to the 25,650–25,670 zone (mean-reversion target).
Mean-Reversion & Swing Behavior
Trend Context:
Current structure shows NQ is way overbought (RSI/MFI excess); big players may tank the rally if major Fed/Earnings events hit tomorrow.
Bearish divergence noted on H1, confirmed by loss of momentum and price rejection from upper channel. Short-term bias is toward retracement.
Seasonal Triggers: FOMC, job numbers, and earnings continue to drive intraday spikes, though daily closes typically mean revert after exhaustion breaks.

Understanding the Structure of Global Financial Markets1. Introduction: The Backbone of the Global Economy
The global financial market is the lifeblood of the world economy. It connects investors, governments, institutions, and corporations across borders, allowing capital to flow seamlessly where it is most needed. Whether it’s a farmer in India taking a loan, a startup in Silicon Valley raising funds through IPOs, or a central bank managing currency reserves, all these activities are influenced by the structure of the global financial system.
Understanding how these markets operate provides insight into how money moves, how wealth is created, and how economic growth is sustained. The structure of global financial markets is not just about trading stocks or currencies—it represents a vast ecosystem that includes banks, exchanges, institutions, and regulatory bodies working in tandem.
2. The Core Components of Global Financial Markets
The financial market is broadly divided into five major segments, each serving a unique function in the flow of funds and risk management.
a. Capital Markets
Capital markets are where long-term securities are bought and sold. They include:
Equity Markets (Stock Markets): Where companies issue shares to raise capital, and investors trade those shares. Examples include the New York Stock Exchange (NYSE), London Stock Exchange (LSE), and National Stock Exchange (NSE) of India.
Bond Markets (Debt Markets): Governments and corporations issue bonds to borrow money for development projects, infrastructure, or business expansion. Bonds provide investors with fixed returns and are a safer investment option compared to equities.
These markets are vital for economic development, as they help mobilize savings and channel them into productive investments.
b. Money Markets
The money market deals with short-term borrowing and lending, typically for periods less than one year. It provides liquidity to financial institutions, corporations, and governments.
Key instruments include Treasury Bills, Certificates of Deposit (CDs), Commercial Papers, and Repurchase Agreements (Repos).
Money markets are crucial for maintaining monetary stability and ensuring that businesses have access to working capital.
c. Foreign Exchange (Forex) Markets
The foreign exchange market is the largest and most liquid financial market in the world, with over $7 trillion traded daily. It enables the conversion of one currency into another and supports international trade and investment.
Participants include banks, hedge funds, corporations, and central banks.
For example, an Indian company importing goods from the U.S. must convert INR to USD, a process facilitated by the forex market.
d. Derivatives Markets
Derivatives are financial contracts whose value is derived from underlying assets like stocks, bonds, commodities, or interest rates. Common types include futures, options, forwards, and swaps.
These markets allow investors to hedge risks or speculate on price movements.
For instance, airlines use derivatives to lock in fuel prices, protecting themselves from price volatility.
e. Commodity Markets
The commodity market deals with the trading of physical goods such as oil, gold, natural gas, and agricultural products.
There are two major types:
Hard commodities: Metals and energy resources like crude oil or gold.
Soft commodities: Agricultural goods like coffee, sugar, and wheat.
Commodity prices often reflect global supply-demand imbalances and geopolitical tensions, making them a key indicator of economic health.
3. The Participants in the Financial Market Ecosystem
Global financial markets are powered by a diverse set of participants, each playing a specific role in ensuring efficiency, liquidity, and transparency.
a. Central Banks
Institutions like the Federal Reserve (U.S.), European Central Bank (ECB), and Reserve Bank of India (RBI) oversee monetary policy, control inflation, and maintain currency stability. Their interest rate decisions and liquidity measures have global ripple effects.
b. Commercial and Investment Banks
Banks serve as intermediaries between savers and borrowers. Investment banks, such as Goldman Sachs or Morgan Stanley, help corporations raise capital through stock or bond issuance and advise on mergers and acquisitions.
c. Institutional Investors
These include mutual funds, pension funds, insurance companies, and sovereign wealth funds. They manage large pools of money and play a dominant role in capital allocation and price discovery.
d. Retail Investors
With technological advancements and low-cost trading platforms, retail participation in global markets has surged. Platforms like Robinhood, Zerodha, and Interactive Brokers have democratized investing.
e. Regulatory Bodies
Regulators ensure market integrity, transparency, and investor protection.
Examples include:
SEC (U.S.) – Securities and Exchange Commission
FCA (U.K.) – Financial Conduct Authority
SEBI (India) – Securities and Exchange Board of India
These institutions enforce compliance and curb insider trading, market manipulation, and systemic risks.
4. The Role of Technology in Modern Financial Markets
Technology has completely reshaped global finance, making markets faster, more efficient, and accessible.
Algorithmic and High-Frequency Trading (HFT): Automated systems execute trades in milliseconds, enhancing liquidity but also introducing flash crash risks.
Blockchain and Cryptocurrencies: Decentralized finance (DeFi) and cryptocurrencies like Bitcoin and Ethereum challenge traditional banking structures, offering transparency and borderless transactions.
Artificial Intelligence and Big Data: AI analyzes massive datasets to predict market trends, optimize portfolios, and assess credit risks.
Fintech Platforms: Apps and online brokers have made trading, investing, and lending more convenient for individuals worldwide.
The rise of digital transformation ensures that even small investors can participate in global opportunities that were once limited to large institutions.
5. Interconnectedness of Global Markets
Global financial markets are interlinked. A shock in one region can quickly ripple across others—a phenomenon known as financial contagion.
The 2008 Global Financial Crisis began in the U.S. housing market but spread to Europe and Asia.
The COVID-19 pandemic disrupted global supply chains, leading to massive volatility in stock and commodity markets.
Today, geopolitical tensions (e.g., U.S.–China trade conflicts or Russia–Ukraine war) impact global energy prices, currencies, and investment flows.
This interconnectedness makes coordination among central banks and international institutions (like the IMF and World Bank) essential to maintaining financial stability.
6. The Importance of Financial Market Infrastructure
Behind every trade or transaction lies a complex network of infrastructure institutions ensuring smooth operation:
Stock Exchanges (e.g., NYSE, NSE, HKEX)
Clearing Houses (which ensure settlement of trades)
Depositories (which hold securities electronically)
Payment Systems (SWIFT, RTGS, NEFT, etc.)
These systems enable trust and efficiency, allowing billions of transactions daily with minimal risk of default or delay.
7. Global Financial Centers
Certain cities serve as nerve centers of the global financial system, each with its specialization:
New York: Global leader in equities and investment banking.
London: Known for foreign exchange and derivatives trading.
Hong Kong & Singapore: Gateways to Asian capital markets.
Dubai: Emerging as a Middle Eastern financial hub.
Mumbai: India’s financial powerhouse, home to NSE, BSE, and a growing fintech ecosystem.
These hubs attract multinational corporations, financial institutions, and investors, reinforcing the global network of finance.
8. Integration of Emerging Markets
Emerging markets such as India, Brazil, China, and Indonesia have become major players in global finance.
They offer:
Higher growth potential
Expanding consumer bases
Attractive investment opportunities
However, they also carry higher risks — including currency volatility, regulatory uncertainty, and political instability.
Global investors increasingly view emerging markets as essential diversification opportunities, while international organizations like the World Bank and IMF provide financial support and stability frameworks.
9. Challenges Facing the Global Financial Market Structure
Despite technological and institutional progress, several structural challenges persist:
a. Systemic Risks
The interconnected nature of finance means that a collapse in one sector or country can trigger a global chain reaction.
b. Regulatory Divergence
Different countries have varying financial regulations, making global harmonization difficult.
c. Cybersecurity Threats
As markets digitalize, cyberattacks pose significant risks to data security and financial stability.
d. Market Inequality
Wealth concentration among institutional investors and developed economies often widens inequality between nations.
e. Climate and ESG Challenges
Sustainability has become a key issue. Markets are increasingly adapting to ESG (Environmental, Social, Governance) frameworks, integrating ethical and ecological considerations into investment decisions.
10. The Future of Global Financial Markets
The future structure of global financial markets will be shaped by innovation, regulation, and inclusivity.
Key trends include:
Central Bank Digital Currencies (CBDCs) revolutionizing payment systems.
Tokenization of Assets, allowing fractional ownership of real estate or art.
Sustainable Finance, where green bonds and ESG-focused funds dominate portfolios.
Cross-border interoperability, enabling faster and cheaper global transactions.
The focus will increasingly shift toward resilience, transparency, and financial inclusion—ensuring that economic growth benefits both developed and developing economies alike.
11. Conclusion: A System of Opportunity and Responsibility
Understanding the structure of global financial markets is essential not just for investors or policymakers, but for anyone who wants to comprehend how the modern world operates. These markets determine everything from interest rates on home loans to the prices of everyday commodities.
At its core, the global financial system represents a balance between risk and reward, stability and innovation, and regulation and freedom. As globalization deepens and technology evolves, financial markets will continue to transform — becoming more interconnected, intelligent, and inclusive.
However, this evolution also demands responsible participation. Ethical investing, prudent regulation, and financial literacy are vital to ensure that the benefits of global finance reach everyone — not just a privileged few.
In short, the global financial market is a dynamic, living system — a mirror reflecting the collective ambitions, fears, and progress of the world’s economies.

NQ UpdateI noticed this morning that MFI actually went down, not up.
I bought ALB in the morning and flipped it for $1 per share profit. That stock moves well.