NQ UpdateMFI hit oversold yesterday but FDAX is overbought so watch out. NQ may double or triple bounce into oversold territory.
One thing I know is taht I'm not carrying any long position over the weekend. If FDAX drops Monday, we'll see futures go red.
Market insights

MAJOR MARKET SIGNALPlease watch the entire video to understand my overall logic.
Through the years I've gone through many different strategies, learning, refining and sharpening my edge in the markets. Today I truly find myself most in the identity of a "Discretionary Trader" with a mechanical approach.
In this chart break down I am displaying a Monthly Hanging Man Signal Bar.
This is provided to me by the market not a 3rd person subjective strategy. We are going to want to monitor how price behaves at the high and low of prior monthly candle. Breaks of these levels will act as pivot points.
Do you think this could be the start of a massive correction?

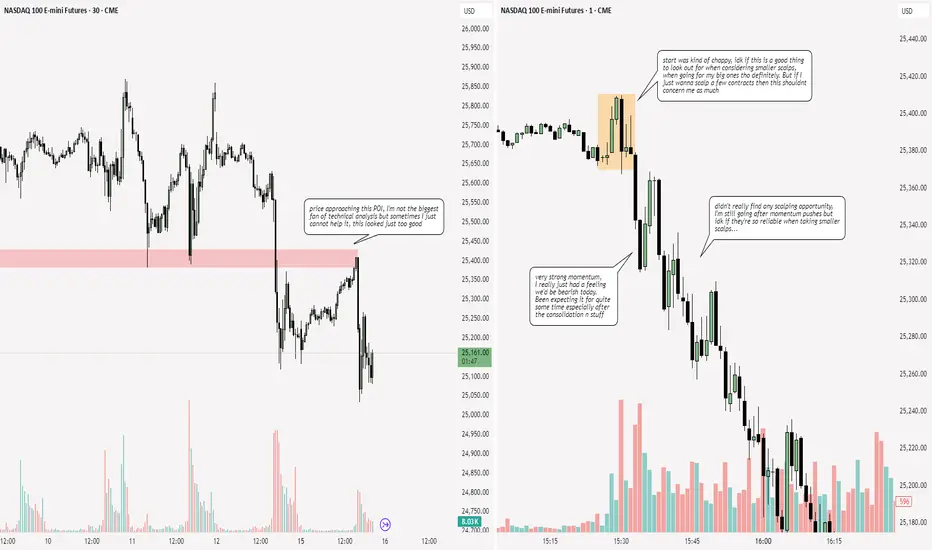
Scalping the 1 minute using HTF OHLC strategy: Prop Firm StratSimple Scalping, Trading Take Profit Testing account. Using my Best Trade Set up Strategy on the 15-minute candles.

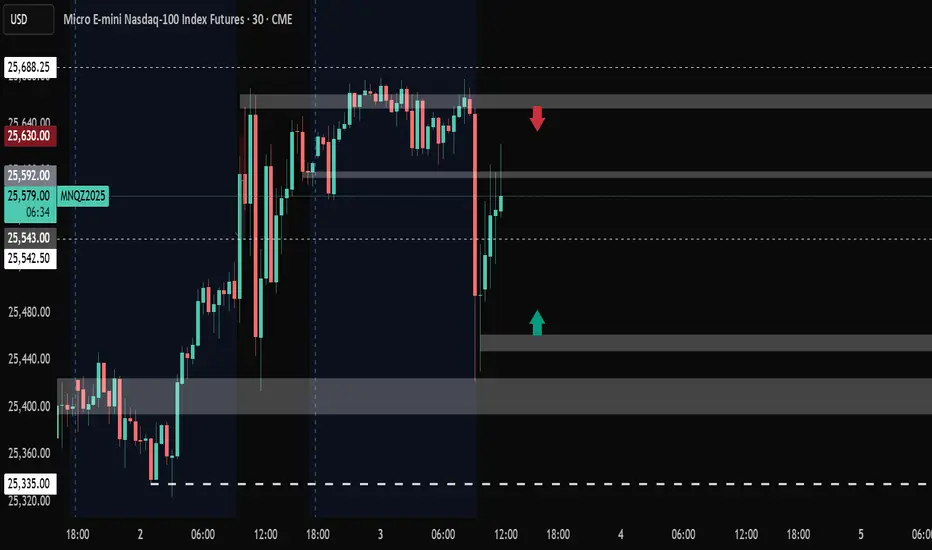
NASDAQ ANALYSIS ON 30 MIN CHART Long & Short analysis on nasdaq based purely on high-probability zones. i trade from zones only—because when price enters a valid zone, a move is expected. these zones are not session or time dependent. execution, risk management, and psychology decide how much you extract from that move. analysis alone never guarantees profits. discipline does.
trade smart. manage risk. stay consistent.
happy trading.

QQQ- are we going to make a new high or lower high?This is the set up at the moment what do you think?

NQ Power Range Report with FIB Ext - 12/17/2025 SessionCME_MINI:NQH2026
- PR High: 25363.00
- PR Low: 25294.25
- NZ Spread: 154.0
No key scheduled economic events
Session Open Stats (As of 12:25 AM)
- Session Open ATR: 414.92
- Volume: 32K
- Open Int: 246K
- Trend Grade: Long
- From BA ATH: -4.0% (Rounded)
Key Levels (Rounded - Think of these as ranges)
- Long: 26521
- Mid: 25264
- Short: 24008
Keep in mind this is not speculation or a prediction. Only a report of the Power Range with Fib extensions for target hunting. Do your DD! You determine your risk tolerance. You are fully capable of making your own decisions.
BA: Back Adjusted
BuZ/BeZ: Bull Zone / Bear Zone
NZ: Neutral Zone

NQ_F is at an important spot here. Shorts are valid below 50MA.#NQ_F is really struggling to reclaim the 50MA(25200). In weak markets you should be looking to sell bounces that fail and this market is looking weak. 8MA(25458) is trying to cross below the 21MA(25406) with all 3 MA's curling down. I wouldn't be long here unless price can reclaim 25200 and I would be short on tests of 25120 or 25170 that fail or on a hold below 25940 to target 24820, 24775 and the 100MA(24631). Look out below if the 100MA breaks.


NQ Power Range Report with FIB Ext - 12/16/2025 SessionCME_MINI:NQH2026
- PR High: 25373.25
- PR Low: 25280.25
- NZ Spread: 208.0
Temp 25% AMP margin requirements increase
Key scheduled economic events:
08:30 | Average Hourly Earnings
Retail Sales (Core|MoM)
Nonfarm Payrolls
Unemployment Rate
09:45 | S&P Global Manufacturing PMI
S&P Global Services PMI
Session Open Stats (As of 12:55 AM)
- Session Open ATR: 430.72
- Volume: 41K
- Open Int: 168K
- Trend Grade: Long
- From BA ATH: -4.8% (Rounded)
Key Levels (Rounded - Think of these as ranges)
- Long: 26521
- Mid: 25264
- Short: 24008
Keep in mind this is not speculation or a prediction. Only a report of the Power Range with Fib extensions for target hunting. Do your DD! You determine your risk tolerance. You are fully capable of making your own decisions.
BA: Back Adjusted
BuZ/BeZ: Bull Zone / Bear Zone
NZ: Neutral Zone

How to trade every smart money concept: HTF tutorialI talk about trading HTF concepts inside of the smart money world not chasing minutia but paying attention to the larger levels

NQ: 260th trading session - recapIdk whether this is exactly the 260th session. I mean even when I started out I guessed on how many sessions I had, now with not posting but still scalping I just figured this is a good number.
After a month of not really being able to lock in due to personal issues I am finally confident in saying that I am back.
Won't scalp on thursday, but I'll skip school on wednesday so I can scalp then.

Big bearmarket on NQ1! I assume the market is going down ca. 5%The Nasdaq (NQ) is a highly liquidity-driven market, dominated by technology stocks that react strongly to interest rates, monetary policy, and institutional positioning. Price movements are often not driven by news itself, but by where liquidity is resting.
Markets tend to move toward obvious highs and lows because that is where stop orders and resting liquidity accumulate. When the Nasdaq trades above prior highs, it often triggers buy-side liquidity, such as stop losses from short sellers and breakout buyers. Once this liquidity is absorbed by larger players, buying pressure can quickly weaken, creating conditions for a reversal lower.
Another key factor is institutional distribution. During extended rallies, smart money often sells into strength while retail traders continue to buy. This distribution typically occurs near range highs, equal highs, or premium price zones, where liquidity is highest. After distribution is complete, price no longer has the support needed to continue higher.
From a liquidity perspective, a decline in NQ is likely when buy-side liquidity above highs has been taken, price fails to hold above key resistance, market structure shifts from higher highs to lower highs, and sell-side liquidity below recent lows becomes the next target.
In such scenarios, the market seeks sell-side liquidity below previous lows, value areas, or unfilled inefficiencies. This downward move is not random but a natural rebalancing process, allowing institutions to enter or re-accumulate at lower, more favorable prices.
In summary, the Nasdaq falls not because of fear or headlines, but because liquidity has already been collected on the upside, and price must move lower to find new liquidity and restore balance.


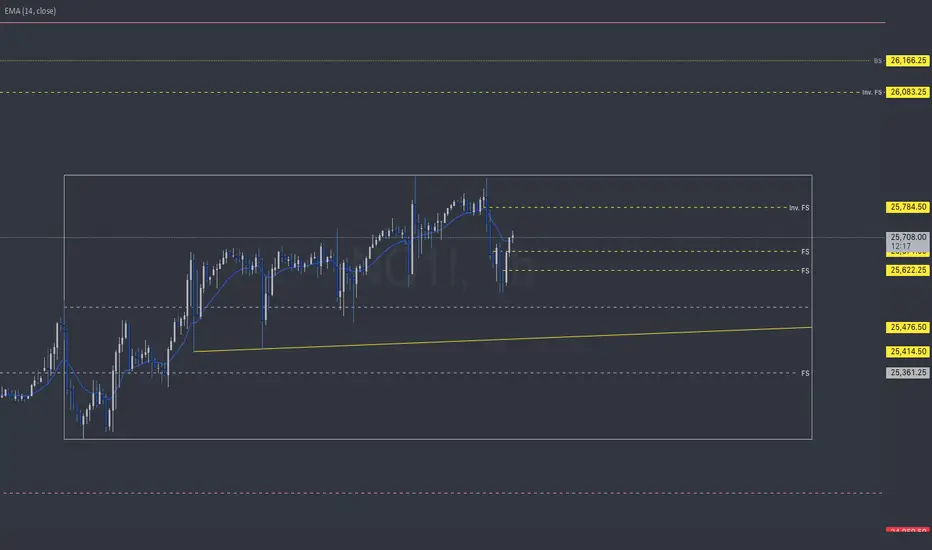
NQ | WK 51T.A explained -
BackSide (BS)
FrontSide (FS)
Inverse BS (Inv.BS)
Inverse FS (Inv.FS)
BS & FS levels are expected support when dashed lines, tested when dotted and resistance when solid lines.
The inverse is true for the Inv. BS Inv. FS levels, they are resistance as dashed lines, tested as dotted and support as solid lines.
Monthly timeframe is color pink
weekly grey
daily is red
4hr is orange
1hr is yellow
15min is blue
5min is green if they are shown.
strength favors the higher timeframe.
2x dotted levels are origin levels where trends have or will originate. When trends break, price will target the origin of the trend. its math, when the trend breaks, the vertex breaks too so the higher timeframe level/trend that breaks, the more volatility there could be as strength in the orders flow in to fuel the move.

NQ Power Range Report with FIB Ext - 12/15/2025 SessionCME_MINI:NQH2026
- PR High: 25245.25
- PR Low: 25132.50
- NZ Spread: 252.25
No key scheduled economic events
Index futures contract rollover week
Session Open Stats (As of 12:25 AM)
- Session Open ATR: 434.10
- Volume: 17K
- Open Int: 60K
- Trend Grade: Long
- From BA ATH: -4.2% (Rounded)
Key Levels (Rounded - Think of these as ranges)
- Long: 26521
- Mid: 25264
- Short: 24008
Keep in mind this is not speculation or a prediction. Only a report of the Power Range with Fib extensions for target hunting. Do your DD! You determine your risk tolerance. You are fully capable of making your own decisions.
BA: Back Adjusted
BuZ/BeZ: Bull Zone / Bear Zone
NZ: Neutral Zone

My Weekly NQ Analysis
We can see NQ push to the upside is getting heavy and create a MMXM Market Maker Sell Model. Friday had a 500 point sell off. This could be a liquidity grab from 25,200 zone. If so price may show some signs of reversing back to all time highs. But if it continues to fall we could see price go to these targets before the bulls gain control again.
24,600
24,363
23,903 at which if price reaches here and continues downwards it may drop drastically to the equal lows of
23,284 zone. At which you could refer to my previous post with lower levels.
I've marked out a 4hr Sibi that price created Friday Dec 12th (25,400). Price will reveal its intent when entering this zone. As well as Thur/Friday daily gap @25,654 @ which price could reach to these area's before continuing its bear run.
But if Price finds support and maintain structure above CE consequent encroachment or upper quadrants of these two inefficiencies then price will likely target all time highs ATH.
Trade Safe

NQ Weekly planlooks like NQ going to test support down around 24.600 usd. given the fact of rate cuts and all positive fundmental news, i would count for a reversal to the upside. But brutal correction first.

#202550 - priceactiontds - weekly update - nasdaq e-miniGood Evening and I hope you are well.
comment: Neutral. Huge vol increase late on Friday where the market found it’s bottom. Is this bullish or bearish? More often that not, before markets make new highs, we see a deeper pullback where bulls step aside to the violently buy it but this deep was maybe a bit too deep. So if we keep the gap to 25370 open, it’s bearish af but if it closes, we could see another meltup for 26000. Also, 50% retracement from October ath to November low and November low to December high, do the middle of those two and you are pretty much on point for 25000. We will hit 25000 this year again, for sure but again, I don’t know if we could not melt another time for 26000 before or after.
current market cycle: trading range
key levels for next week: 24800 - 26000
bull case: Bulls have been buying everything since the November low, will they buy this deeper dip as well in hopes for 26000? It’s the first daily bar below the daily 20ema for 3 weeks and chances are bigger for bulls than for the bears but the selling was so strong that I think most bulls will wait and we will see some sideways movement first.
Invalidation is below 24800
bear case: Bears got the first bear bar closing on it’s low and it might have trapped many bulls. If some sort of profit-fear takes over, we could go lower because bears still have the r:r on their side because we could very well go down to 24300ish again. For now I don’t think many bears will push their luck and take profit’s but let’s see what happens on Monday.
Invalidation is above 25400, at least for another round of 25700ish if not 26000
short term: Neutral.
medium-long term - Update from 2024-12-06: 24150 was my latest more realistic bear target for this year and we got 23904. Year end close around 25000 most likely.

NQ | Week 50 | 1hr chartT.A explained -
BackSide (BS)
FrontSide (FS)
Inverse BS (Inv.BS)
Inverse FS (Inv.FS)
BS & FS levels are expected support when dashed lines, tested when dotted and resistance when solid lines.
The inverse is true for the Inv. BS Inv. FS levels, they are resistance as dashed lines, tested as dotted and support as solid lines.
Monthly timeframe is color pink
weekly grey
daily is red
4hr is orange
1hr is yellow
15min is blue
5min is green if they are shown.
strength favors the higher timeframe.
2x dotted levels are origin levels where trends have or will originate. When trends break, price will target the origin of the trend. its math, when the trend breaks, the vertex breaks too so the higher timeframe level/trend that breaks, the more volatility there could be as strength in the orders flow in to fuel the move.
NQ Weekly Outlook | December 8–12, 20251H Market Structure Overview
The first half of the week was choppy and range-bound due to FOMC, leading to overlapping candles and unclear structure. After FOMC passed, price action on Thursday and Friday became much cleaner. On the 1H timeframe, NQ transitioned into bearish structure, printing lower highs followed by a strong downside impulse. Sellers remained in control into the end of the week, breaking prior intraday support and shifting short-term momentum to the downside.
Bias
Bearish on 1H heading into the next week — favoring downside continuation while price remains below prior structure highs. Bias can change if price reclaims broken structure and begins forming higher lows, but current momentum favors sellers.
What We Want to See Next
Bullish scenario:
Price holds current lows and reclaims short-term structure with a clear higher low on the 1H. Acceptance back into prior consolidation could allow a move toward previous range highs, but this would require strong follow-through.
Bearish scenario:
Price continues to respect prior support as resistance after any pullbacks. As long as lower highs continue to form, further downside remains favored, especially with cleaner post-FOMC price action now in effect.

BQ UpdateMFI touched oversold but RSI has not. There is a chance that it hits oversold SUnday night then reversed before US market open.
I'll wait for Monday.
