Diabolical trading could frustrate you if you let it, in hindsight the play was right at the off when the bodies were respecting that very first OB+
Trade ideas


bullish move in the makingusing trendline trading strategy time-frame analysis its clear that a bullish move is about to happen. As always money management is key and trading is risky. This is not a financial advice.

AI Valuation TechnicallyThese are the three largest market-cap listed companies on the Nasdaq.
If we are concerned about an AI bubble, I’m going to show you how I perform a quick glance at some top companies and their index to determine the likelihood of an upcoming short-, mid-, or long-term correction.
In 2017, Microsoft’s P/E reached its highest at 45 — and it continued to rise after that.
In 2023, Nvidia’s P/E reached its highest at 147 — and it continued to rise after that.
In 2024, Apple’s P/E reached its highest at 40 — and it continued to rise after that.
Video version:
Micro E-mini Nasdaq-100 Index
Ticker: MNQ
Minimum fluctuation:
0.25 index points = $0.50
Disclaimer:
• What presented here is not a recommendation, please consult your licensed broker.
• Our mission is to create lateral thinking skills for every investor and trader, knowing when to take a calculated risk with market uncertainty and a bolder risk when opportunity arises.
CME Real-time Market Data help identify trading set-ups in real-time and express my market views. If you have futures in your trading portfolio, you can check out on CME Group data plans available that suit your trading needs tradingview.com/cme/

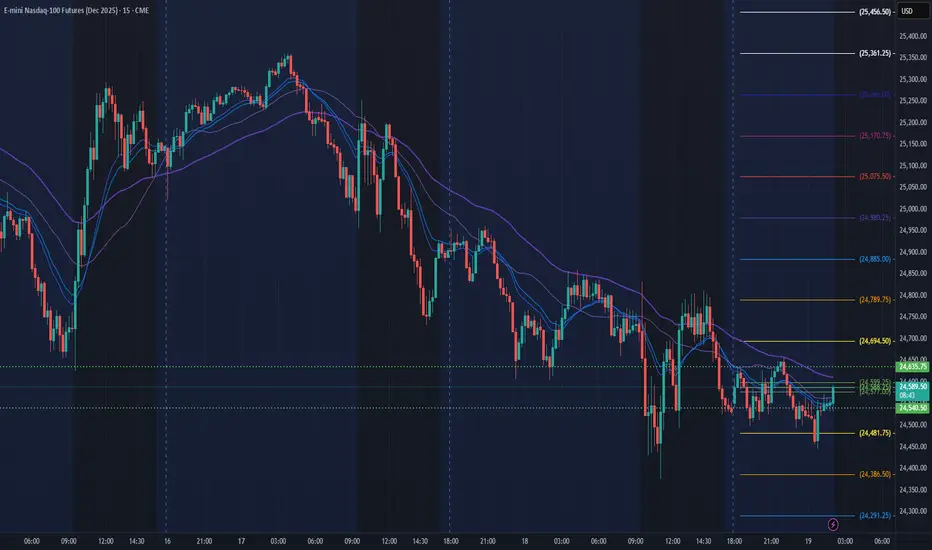
NQ Power Range Report with FIB Ext - 11/19/2025 SessionCME_MINI:NQZ2025
- PR High: 24635.25
- PR Low: 24540.75
- NZ Spread: 211.5
Key scheduled economic events:
14:00 | FOMC Meeting Minutes
Session Open Stats (As of 12:35 AM)
- Session Open ATR: 468.50
- Volume: 51K
- Open Int: 295K
- Trend Grade: Long
- From BA ATH: -6.9% (Rounded)
Key Levels (Rounded - Think of these as ranges)
- Long: 26636
- Mid: 25410
- Short: 24039
Keep in mind this is not speculation or a prediction. Only a report of the Power Range with Fib extensions for target hunting. Do your DD! You determine your risk tolerance. You are fully capable of making your own decisions.
BA: Back Adjusted
BuZ/BeZ: Bull Zone / Bear Zone
NZ: Neutral Zone
NQ1! 1H Chart – Bearish Channel + Hidden DivergencePrice is moving within a descending channel on the 1-hour chart. A hidden bearish divergence is confirmed on the stochastic oscillator, aligning with the channel structure.
System-based short setup using EMA 100 structure and divergence logic.

Do You Know Bitcoin and Nasdaq Have a 92% Correlation?* Most traders still believe Bitcoin and the Nasdaq 100 belong to two different worlds — one is “digital currency,” the other is “US tech stocks.”
- But in reality, Bitcoin and Nasdaq have nearly 92% positive correlation (based on past +10 years data).
The current market movements are showing signs of a market crash on the way...........
- See for arounf past 10 years, Bitcoin stayed above the tech index.
- It was the month of Nov only in 2015, when Bitcoin crossed above Nasdaq on the chart
After 10 straight years - Its 2025 & the month of November itself
- And Bitcoin has slipped below Nasdaq, forming its first bearish crossover in a decade.
This is a major shift.
- When a long-term leader loses momentum, it often signals deeper structural weakness — not only for Bitcoin, but for the entire risk-on ecosystem.
- Remember, Nasdaq & Bitcoin has over a 92% correlation
- And US tech industry is brewing a bubble somewhere - where the epicenter lies in the AI sector
A crash in one will sink the other with it
Checkout the chart (Nasdaq Futures & Bitcoin Weekly)

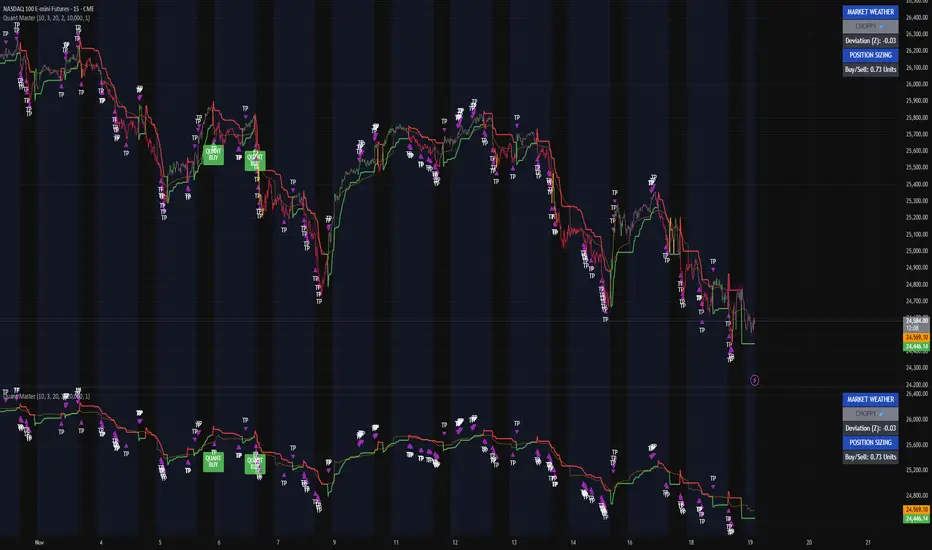
Pure signal reading. Here’s how I’m reading NQ right now.I’m tracking NASDAQ 100 e-mini futures (NQ) on the 15-minute using my Quant Master Trend System — the same model I use to separate real directional pressure from intraday noise.
This entire chart is a perfect example of why most traders get chopped to death: they trade emotions, but I trade structure.
The ribbon is choppy, fragmented, and constantly flipping, which is exactly what I expect when Market Weather is labeled CHOPPY in the panel.
That mode tells me one thing:
Breakouts fail.
Breakdowns fail.
Momentum has no conviction.
When the system is in CHOPPY mode, every pullback looks like a setup, but it’s not — the model purposely suppresses continuation trades and fires more TP clusters because it’s detecting distribution, not trend.
You can see it clearly:
• Every time the ribbon tries to go green, it gets rejected within a handful of bars.
• Every red flip lacks strong downside extension — everything fizzles.
• Price oscillates around the volatility stop instead of respecting it.
• TP clusters fire rapidly — that’s your model’s “don’t trust this move” signature.
Even the Quant Buy signals tell the story.
They’re valid moves, but they’re short-lived, because the underlying pressure isn’t unified. That’s the entire point of this system: it’s telling you the environment, not just the direction.
The deviation reading is mild at Z ≈ -0.38, which means price isn’t stretched in either direction — the perfect recipe for messy intraday action.
So here’s how I’m interpreting this:
This is not a trending environment.
This is rotational flow, liquidity probing both sides, and no clean edge.
The ribbon’s behavior, the failed retests, the compression, and the constant TP firing confirm that NQ is stuck in a structure where continuation trades have the lowest probability.
Until Market Weather leaves CHOPPY and we get a clean ribbon alignment, I’m treating everything as low conviction and short-duration.
NQ Daily Outlook | November 19, 20251H timeframe — using the 50 EMA (black) for trend + 5/10 EMAs (white) for momentum/BOS.
Quick read: We’re still under the 50 EMA, and the whites are curled down. Structure is still making lower-highs and lower-lows, so momentum stays bearish for now.
Bearish idea (favored)
If we stay under the 5/10 EMAs and reject the 50 again, I’m looking for a BOS down and continuation into the lows.
Bullish idea
If we reclaim the whites, break a lower-high, and hold above the 50 EMA, then I’ll flip long and look for a clean BOS up.
Bias: Bearish until price breaks structure to the upside and holds above the 50 EMA.

# /Nq trend #nasdaq - neutral to bearishNasdaq is trading at the crucial levels major support held at 2430 zone. if this level breaks then bearish momentum with broader sell off heading towards weekly correction. key levels to watch mentioned below.
resistance: 24800,24950, 25200-240
support: 24380 -2440 , 23845,23100

$NQ1! End of Year Prediction! Based off of the recent price action:
I understand that this is a Bank Run.
These take profits will be kiddy-backed by short margin and whence upon each institution reaches their desired "Share Weight", there will be a resultant Gamma Squeeze.
The rules are simple in these situations:
"Sell before our friends sell on us."
"First Out Wins, Last Out Loses."
This is basically just purely panic from High Executives of Financial Firms Reading the Room.
Don't worry about it, Buy the Dip when they Cover Up.
I expect some covering to begin around 23875 beeps, with the Lion's Share targeting a cover around 23050 - 23350.
Beware we can also fail out of this Broadening Descending Wedge (Bullish Structure although the price zig zags downwards in corrective mode)
In that case, you might want to target around 15800-16700 for fun.
Enjoy and Happy Trading!
Mr. Storm

BTD ChallengeThree Step Challenge.
Day Trading Nasdaq-100 Futures.
I "Bachelor's"
II "Master's"
III "Phd"
I "Bachelor's"
A. Workshop: five tabs plus a reliable business news service
*1. www.marketwatch.com
*2. 4 Hour chart
***a. Session Volume Profile
***b. volume bars
*3. Daily chart
***a. volume bars
***b. 50-d simple moving average
***c. 200-d simple moving average
*4. 1 Hour chart
***a. Visible Range Volume Profile
***b. volume bars
*5. 5-minute chart
***a. volume bars
*6. Business news Fox, MSNBC, Bloomberg etc
Yesterday's chart was all about an outstanding, high probability win rate Buy the Dip plan. Now we shall earn a B.D. in BTD trades for the Nasdaq-100 futures. This will be applicable to the Dow, S&P 500 and the Russ 2000 futures. We shall go on to earn a Master's and then a Ph.D.. At the end you will be one of the best Buy the Dip traders on the planet.
The old ladies taught this trader how to outline in the fourth grade. He doesn't represent this as their best teaching but as his best (poor) remembrance.
He will stumble and bumble, but we'll get to the end. Let's call step 1 a Bachelor of Buying the Dip Degree - B.BTD.
Above is a rough outline of his workshop. If you like it use it. You are a unique individual. Do what works for you.
Expect additions, subtractions, revisions, anecdotes and, hopefully, facts.
Sizing down after a lossTook a 1% loss, then took a 2nd trade for a 0.5% win, so i can go back to risking 1% now.

NQ1/Nasdaq Daily Trade SetupsIn this update we review the recent price action in the e-mini Nasdaq futures and identify the next high-probability trading opportunities and price objectives to target. To review today's video analysis, click here!

NQ - ShortNQ Short
Day close red, forming a C2 candle - confirmed by a 1hr change in state of delivery - anticipating short from 1hr FVG - only if proper C2 and C3 candles form.


Nasdaq reqdy for new all time highsChart looks great .
I think there is another push to the upside .
Equities together with crypto will have another run.

NDX - DONT HURT ME NO MORE!Good Morning,
Hope all is well. NDX !!! Don't hurt me no more. Nope! We saw this coming from quite a distance away. I first observed a pull-back coming into effect on a shorter time frame and have since charted it on longer time frames.
Lets get down to basics. The markets had a phenomenal run this year, there can only be so much confidence in something before people start to get weary. That is exactly what we have here. Currently are we finished the pull-back? No - Are we going to dive into a reversal?, unlikely. There is still a very long way to go until we hit that point.
My TFSA has been limited at this point, I am not buying much and am holding a 75% cash reserve. My other two accounts are swing and day trade accounts so I do not bother and instead play the positions when opportunity arises.
Trade Safely!
Enjoy!

NQ1! 4HR Setup – EMA 100 + Divergence Structure📊 NASDAQ 100 Futures (NQ1!) – 4HR Chart
- Entry: 24,893
- Stop: 25,398
- Target: 24,403
🧩 Structure:
- Descending channel breakout potential
- EMA 20 touch + divergence structure
- Hidden divergence confirmation on stochastic

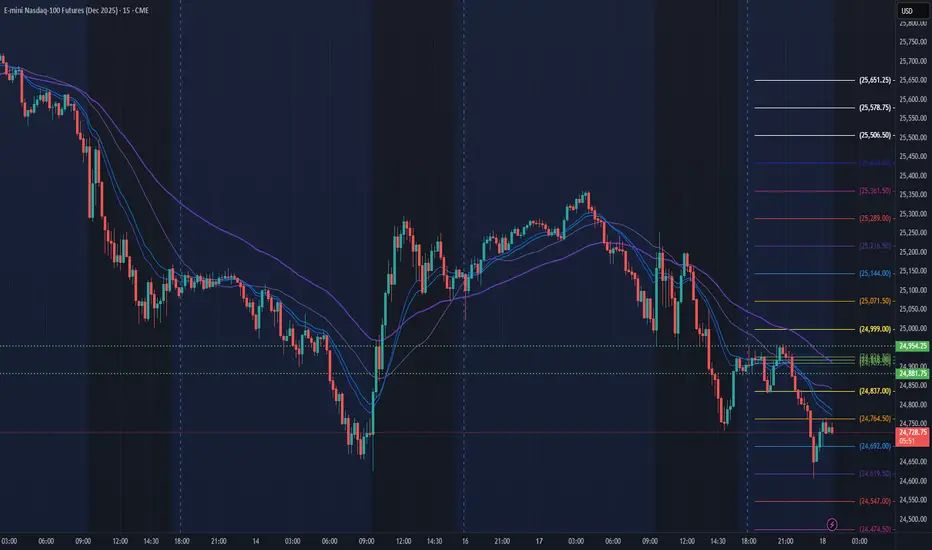
NQ Power Range Report with FIB Ext - 11/18/2025 SessionCME_MINI:NQZ2025
- PR High: 24954.50
- PR Low: 24882.00
- NZ Spread: 162.25
No key scheduled economic events
Session Open Stats (As of 12:35 AM)
- Session Open ATR: 475.50
- Volume: 67K
- Open Int: 291K
- Trend Grade: Long
- From BA ATH: -6.3% (Rounded)
Key Levels (Rounded - Think of these as ranges)
- Long: 26636
- Mid: 25410
- Short: 24039
Keep in mind this is not speculation or a prediction. Only a report of the Power Range with Fib extensions for target hunting. Do your DD! You determine your risk tolerance. You are fully capable of making your own decisions.
BA: Back Adjusted
BuZ/BeZ: Bull Zone / Bear Zone
NZ: Neutral Zone
4HR NQ – Attempting a New Direction4HR NQ – Attempting a New Direction (For Educational Purposes Only)
This analysis is shared strictly for educational purposes and is not financial advice. It is intended to illustrate chart-reading techniques, structure mapping, and scenario planning.
Bullish Scenario – Potential Uptrend Zone
The chart outlines a clearly defined uptrend continuation area:
A green expansion zone highlights the upside target region toward 25,891.50.
A –1% risk bubble shows the approximate drawdown tolerance for a long bias.
A break and sustained move above 25,591.50 (white dotted line) would strengthen bullish momentum.
The yellow dashed line above represents a major resistance area that the market must reclaim to shift direction convincingly.
Bearish Scenario – Potential Downtrend Zone
The lower side of the chart maps the downside continuation possibility:
A red zone defines the bearish target area toward 24,704.75.
A –1% risk bubble marks the downside tolerance for a bearish setup.
Losing the central grey zone opens the path toward the deeper support band, signaling continuation of downward pressure.
Pattern & Symmetry Structure (Educational Highlight)
On the left side, the chart features a harmonic/symmetry-based analytical framework used for pattern recognition:
A boxed structure spans 22 bars, with two vertical 8-bar segments forming time symmetry.
Two 2.14% price swings mark the upper and lower rotational boundaries.
Curved arcs and diagonals are used to visualize price rotation, volatility compression, and potential reversal points.
This section is included to demonstrate how symmetry and measured movements can support probabilistic forecasting in technical analysis.
Neutral Decision Zone (Market Pivot Area)
The central grey band represents the equilibrium zone, where buyers and sellers are in temporary balance.
Price is currently interacting with this zone, making it the key decision point.
Orange blocks above and below may indicate smaller supply/demand pockets or micro-imbalances.
A directional break from this zone typically sets the next short-term trend.
Summary Market at a Critical Turning Point
Above the grey zone → momentum favors the green uptrend zone.
Below the grey zone → momentum favors the red downtrend zone.

NQ Daily Outlook | November 18, 20251H timeframe — 50 EMA (black) for trend, 5 & 10 EMAs (white) for momentum/BOS.
Quick read: Still under the 50 EMA after a bounce. Whites are curled down; structure is lower‑high/lower‑low.
Two scenarios I’m watching
Bearish trend (favored): Stay under the whites and reject the 50 → print BOS down → ride impulse down, sell pops into the whites.
Bullish trend: Reclaim the whites, push and hold over the 50 → print BOS up → impulse > shallow correction > continuation higher.
Bias: Leaning bearish while we’re below the 50 with no upside BOS. I flip long only after we clear a lower high and hold above the 50 EMA.

NQ UpdateClosed out most of my puts, but did not go long. NQ hasn't hit oversold yet, look at the MFI.
Gap direction will depend on FDAX which is oversold and at support. If it breaks support, indicators won't mean much.
NVDA earnings Wed AH, jobs report THU premarket, Fed minutes Thu.
