NQ Range (12-01-25)NAZ lower in O/N and inside wide Churn Zone, look Long above 25339 and Short below 25,125. May see opposite direction trades at these levels and some sideways churn until breakout. Look at 1,000 point range of 25,910 - 24,910 as a wider CZ range.
Trade ideas

NQ1 - DAY TRDERS OUTLOOK GUIDE FOR 202-12-02Good Morning,
I hope all is well. I always trade with the overall market trend. Here is my guide for the day.
Likely Scenarios for Today
Scenario A – Most Probable (≈60%): Bullish Grind with Pullbacks
Price dips into 25,350–25,300, finds buyers at the EMAs.
Momentum rebuilds.
Slow grind upward toward 25,600 retest.
You will see:
MACD curling upward
DI+ widening over DI-
ADX flat or slightly rising
Best play: Buy the pullback into hourly support.
Scenario B – Rejection and Deeper Pullback (≈30%)
If price loses 25,300, the market likely accelerates downward into:
25,150 (trend-support reset)
Possibly 25,000 liquidation sweep
The indicators would show:
MACD bear cross
DI- crossing above DI+
Oscillators breaking below midline
This would be the only bearish scenario worth taking seriously.
Scenario C – Immediate Breakout (≈10%)
Price surges through 25,600 early in the session and runs momentum into:
25,720
25,850 as the extension
But volume suggests this is less likely unless macro news triggers it.
Today’s Bias Summary
Trend: Bullish
Momentum: Cooling
ADX: Weak trend
Structure: Rising into overhead supply
Key battleground: 25,350 support vs 25,600 resistance
Bias:
Bullish continuation IF 25,300 holds.
Bearish flush IF 25,300 fails.
Hope you Enjoy!

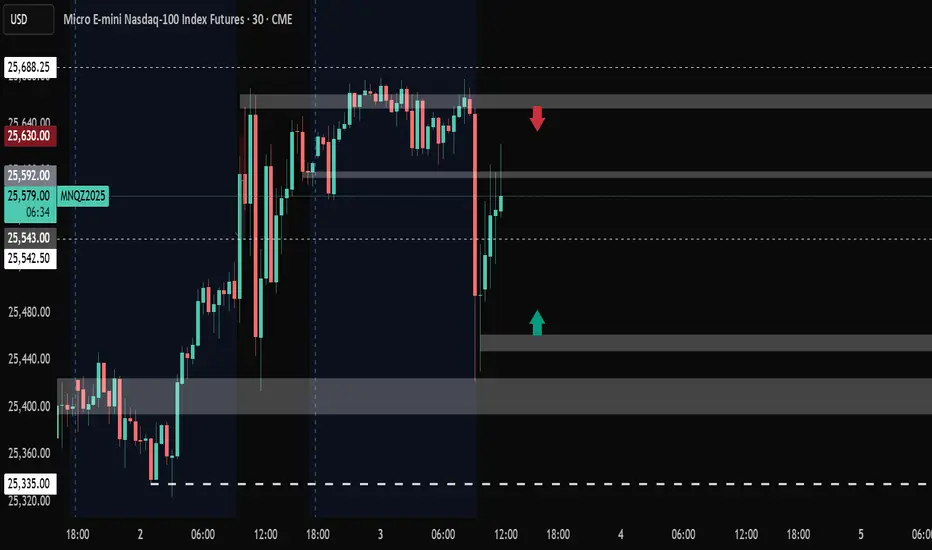
NQ Short (12-03-25)White arrow is range for breakout, lower break may drop to KL 24,625. This may be today or next few. KL 25,620 is major key level today.

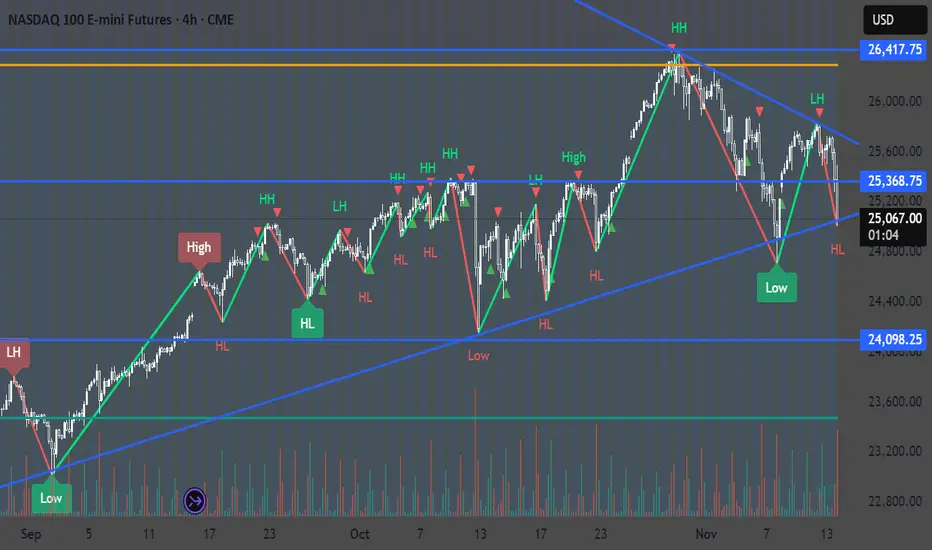
NASDAQ 100: Bullish! Look For Valid Buys With The Trend!Welcome back to the Weekly Forex Forecast for the week of Dec. 1-5th.
In this video, we will analyze the following FX market: NASDAQ (NQ1!) NAS100
The NASDAQ closed last week strong. It would indicated the potential for follow through going into this week, at least early.
Bear in mind that the previous 3 weeks were very bearish, coming down from ATHs, and forming a bearish MSS.
Look out for confirmations for valid trades. The overall trend is bullish, so I am personally looking for valid buys. A bearish MSS would invalidate those ideas.
Enjoy!
May profits be upon you.
Leave any questions or comments in the comment section.
I appreciate any feedback from my viewers!
Like and/or subscribe if you want more accurate analysis.
Thank you so much!
Disclaimer:
I do not provide personal investment advice and I am not a qualified licensed investment advisor.
All information found here, including any ideas, opinions, views, predictions, forecasts, commentaries, suggestions, expressed or implied herein, are for informational, entertainment or educational purposes only and should not be construed as personal investment advice. While the information provided is believed to be accurate, it may include errors or inaccuracies.
I will not and cannot be held liable for any actions you take as a result of anything you read here.
Conduct your own due diligence, or consult a licensed financial advisor or broker before making any and all investment decisions. Any investments, trades, speculations, or decisions made on the basis of any information found on this channel, expressed or implied herein, are committed at your own risk, financial or otherwise.

Location 30m NY Session 1 Dec 2025There are 3 setups based on a 30 minute structure on 1st December 2025.
Location 1 :
- Structure breakout buy
Location 2 :
- Structure breakout buy
Location 3 :
- Structure breakout buy

NQ UpdateLooks like it's still melting up, though it's a slow melt up.
Probably not gonna trade today.

NQ1 - Holding... Santa Rally Incoming?NQ1 Indices1
Still looking dangerous in the short term having printed a quick slump through resistance.
But its holding here and perhaps it can continue up from here.
If it was going to collapse then we might see plenty of leading slumps in stocks.
And we are seeing slump action in crypto and crypto stocks, but most stocks that I cover are looking positive and pushing up as we enter December.
Could a Santa Rally be on 🤨🎅.

NASDAQ - The Good The Bad The UglyGood Afternoon Everyone,
I hope all is well. I have for you a 3 set analysis on what we can expect from the markets this week. Nasdaq TA completed on Weekly, Daily & 1Hour Time Frames.
WEEKLY TREND (Dominant Macro Structure)
Status: Long-term bullish
Signals:
Price inside a multi-month bull channel
Slight channel edge break, but no reversal
Momentum slowing → consolidation expected
Weekly support zones are strong
Weekly takeaway:
The long-term trend is bullish, but entering a cooling/consolidation phase.
Weekly = macro anchor. It strongly biases the market upward over time.
DAILY TREND (Intermediate Structure)
Status: Mixed / Transitioning
Signals:
Price broke down from daily bull channel
Attempted to re-enter → rejected
Sitting between the 50 EMA and 200 EMA
Daily support zones are key
Daily candles show indecision
Daily takeaway:
Trend is no longer strongly bullish. A corrective process or deeper retest is likely before continuation.
Daily = controls medium-term direction and determines where the weekly trend re-engages.
1-HOUR TREND (Short-Term Structure)
Status: Short-term bullish
Signals:
Price broke out of short-term bearish channel
Formed a new, tight bullish channel
Recently rejected at underside of long-term weekly channel
Short-term support forming
Price above 50 EMA & 200 EMA intraday
1H takeaway:
Short-term momentum is bullish, but rejected at major higher-timeframe resistance. Needs support to hold.
1-hour = entry timeframe and shows how the daily trend is forming in real time.
COMBINED MULTI-SCENARIO OUTLOOK
Below are the 3 most realistic combined scenarios using all three timeframes together.
They are ranked from most likely → least likely.
SCENARIO 1 — Controlled Pullback → Higher Low → Trend Resumes Upward
Probability: ★★★★☆ (60–65%) → Most Likely
How This Unfolds (Multi-Timeframe Logic)
Weekly:
Staying bullish but consolidating
Weekly support will eventually absorb selling
Daily:
Mixed trend resolves with a higher low above major support
50 EMA or support #1 holds
1-Hour:
Pullback into short-term support
Bounce signals bullish continuation
Price Path:
1-hour pulls back to support
Daily prints a higher low
Weekly resumes its upward grind
Price re-attempts to re-enter/top the long-term bull channel
This scenario is ideal for:
Swing longs
Daily HL entries
1-hour EMA bounce setups
Continuation plays into the top of the long-term channel
Why most likely?
Because every timeframe except the 1H is cooling, not reversing.
SCENARIO 2 — Deeper Correction Into Major Support → Then Strong Bounce
Probability: ★★★☆☆ (30–35%)
This is your deeper pullback scenario but still bullish long-term.
How It Unfolds (Multi-Timeframe Logic)
Weekly:
Sideways consolidation expands lower
Price moves toward deeper weekly support zone
Daily:
Daily loses the 50 EMA
Price moves toward the 200 EMA
This forms a deeper corrective wave
1-Hour:
Short-term bull channel breaks
Price trends downward intraday
1H shows lower lows until 200 EMA daily zone is reached
Price Path:
1H breakdown → pullback
Daily breaks support #1, moves to support #2
Strong bounce at daily 200 EMA
Weekly trend reasserts → new multi-week rally
This scenario is ideal for:
Buying the daily 200 EMA
Position trades
Mean-reversion long setups
Why it happens?
Because daily trend has weakened AND weekly momentum is slowing — deeper retests are common.
SCENARIO 3 — Breakdown of Daily & Weekly Supports (Full Trend Reversal)
Probability: ★☆☆☆☆ (5–10%) → Least Likely
This would require multiple failures across all timeframes.
How It Unfolds (Multi-Timeframe Logic)
Weekly:
Both long-term support zones break
Weekly closes below the bull channel
Daily:
Price loses both support levels
200 EMA fails
Lower highs and lower lows form
1-Hour:
Sustained intraday lower lows
Bearish channel resumes
No re-entry attempts succeed
Price Path:
1H → breakdown
Daily → breakdown
Weekly → full structural reversal
Why unlikely?
No topping pattern on weekly
Macro trend remains bullish
Daily structure is corrective, not reversal-based
Buyers have not shown exhaustion at any major swing level
I hope you found this useful! Enjoy your week!

NASDAQ ANALYSIS ON 30 MIN CHART Long & Short analysis on nasdaq based purely on high-probability zones. i trade from zones only—because when price enters a valid zone, a move is expected. these zones are not session or time dependent. execution, risk management, and psychology decide how much you extract from that move. analysis alone never guarantees profits. discipline does.
trade smart. manage risk. stay consistent.
happy trading.
This is Monday we'll look at shorter contractsTake a look at the patterns on smaller contracts of gold silver and there was an oil market that we didn't get to see because I didn't know how to push the buttons and there's another market as well that we talked about all of them less risky but rest good return but not you know they you don't if you start trading these markets you have to trade the smaller contracts and then you get a feel.

possible bounce NQ from trendlineNQ is testing a 4h symmetrical traingle line sfp frome here might deliver a bounce or otherwise we go lower.
Possibly Bearish Nasdaq has push above a major zone this weekend and currently at the neckline of that 4HR H&S so if price fall back below that major zone I can see sellers come into play and push it lower.

NQ Week 48 T.A explained -
BackSide (BS)
FrontSide (FS)
Inverse BS (Inv.BS)
Inverse FS (Inv.FS)
BS & FS levels are expected support when dashed lines, tested when dotted and resistance when solid lines.
The inverse is true for the Inv. BS Inv. FS levels, they are resistance as dashed lines, tested as dotted and support as solid lines.
Monthly timeframe is color pink
weekly grey
daily is red
4hr is orange
1hr is yellow
15min is blue
5min is green if they are shown.
strength favors the higher timeframe.
2x dotted levels are origin levels where trends have or will originate. When trends break, price will target the origin of the trend. its math, when the trend breaks, the vertex breaks too so the higher timeframe level/trend that breaks, the more volatility there could be as strength in the orders flow in to fuel the move.

NQ UpdateOdd that MFI went up on no movement
At this point, I'm mostly cash. My favorite long play was GM calls, and that looks topped out.
Not sure about NQ, but I think ES will double top, so no put options for now. I did think about buying GM puts but decided not to.
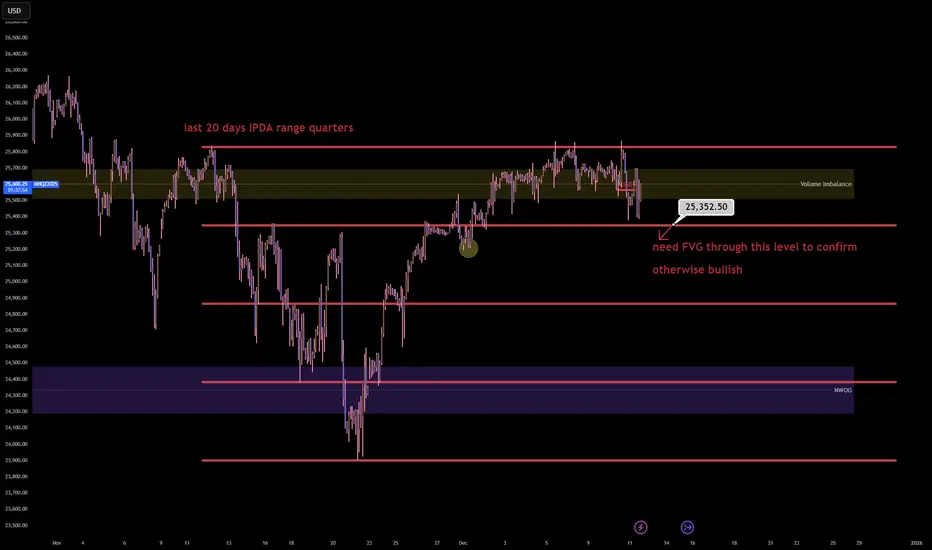
NQ1! (Nasdaq 100) has entered the terminal phaseThe Nasdaq 100 has entered the terminal phase of its 20 day institutional dealing range and is currently executing a distribution program within the premium quartile. The failure to sustain price acceptance above the 25,700.00 Volume Imbalance suggests the algorithm is preparing for a mean reversion event to rebalance the monthly ledger.
The present price action represents a classic 'Bull Trap' at the upper boundary of the range where retail momentum is being absorbed by institutional limit sell orders ahead of a repricing to equilibrium.
Entry: 25,550.00 (Sell Limit)
Stop loss: 25,880.00 (330.00 points)
Take profit: 24,850.00 (700.00 points)
Risk to reward ratio: 2.12R
CME_MINI:NQ1! CME_MINI:MNQ1! IG:NASDAQ
The Opportunity
The 20 day IPDA lookback reveals that price is oscillating within a defined premium distribution block between 25,350.00 and 25,850.00. The market has expended significant energy to reach this valuation but has failed to close the daily candles above the key Volume Imbalance at 25,700.00.
This rejection signature implies that the 'Santa Rally' narrative has been utilized to engineer exit liquidity for smart money positions accumulated at the lows. The algorithm is an efficiency engine and it cannot justify a new macro expansion leg without first revisiting the internal range equilibrium to capitalize the move.
The Entry
Initiating a short position in the 25,550.00 to 25,600.00 zone aligns with the institutional logic of selling the upper 25% of the monthly range. This zone offers the highest statistical edge as it places the entry directly against the 'Ceiling' of the current volatility profile while targeting the 'Floor' of the recent expansion.
The Volume Imbalance acts as a natural defensive barrier for the stop loss as the algorithm will typically respect this array during a distribution phase.
The Invalidation
The bearish causal chain is ontologically corrupted if price achieves a daily close above the 25,880.00 range high. Such an event would signify a 'Blue Sky' breakout and a shift in regime from range bound to trending.
If the market accepts price above this threshold it implies that the premium valuation has become the new floor and the algorithm is targeting the 26,000.00 psychological level.
Key Trajectory Waypoints
Target 1: 25,350.00 | Type: 75% Range Quartile | Probability: 70% | ETA: 24 Hours
Target 2: 24,850.00 | Type: Range Equilibrium (50%) | Probability: 60% | ETA: 2-3 Days
Target 3: 24,400.00 | Type: NWOG / Discount Target | Probability: 40% | ETA: Next Week
The Shadow Reality
A 35% probability exists for the antithetical reality: The Range Expansion.
In this scenario the current consolidation is a 'High Tight Flag' and the algorithm ignores the equilibrium requirement to force a squeeze into the 26,000.00 level immediately.
This reality is confirmed if price holds above 25,650.00 for two consecutive 4 hour closes.
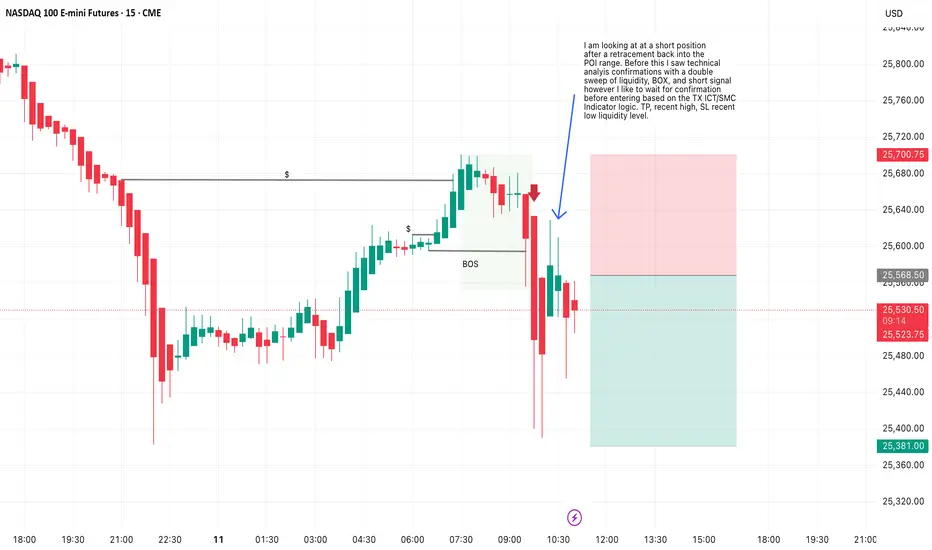
TX ICT/SMC Based NQ1 Short, Liquidity level based SL,TPI am looking at at a short position after a retracement back into the POI range. Before this I saw technical analysis confirmations with a double sweep of liquidity, BOX, and short signal however I like to wait for confirmation before entering based on the TX ICT/SMC Indicator logic. TP, recent high, SL recent low liquidity level.

Release the kraken thenopen the tartarus may I say, lets find Krampus ;)
sell short every base. and have fun with the rebounds.
Carry on, this party for eternity!

NQ Power Range Report with FIB Ext - 12/11/2025 SessionCME_MINI:NQZ2025
- PR High: 25796.00
- PR Low: 25715.75
- NZ Spread: 179.25
Key scheduled economic events:
08:30 | Initial Jobless Claims
12:00 | 30-Year Bond Auction
Session Open Stats (As of 12:35 AM).
- Session Open ATR: 415.83
- Volume: 55K
- Open Int: 311K
- Trend Grade: Long
- From BA ATH: -3.4% (Rounded)
Key Levels (Rounded - Think of these as ranges)
- Long: 26521
- Mid: 25264
- Short: 24008
Keep in mind this is not speculation or a prediction. Only a report of the Power Range with Fib extensions for target hunting. Do your DD! You determine your risk tolerance. You are fully capable of making your own decisions.
BA: Back Adjusted
BuZ/BeZ: Bull Zone / Bear Zone
NZ: Neutral Zone
Benner Cycle 2026 Crash - Has It Started on NQ & SPX?On this chart I’m lining up the Benner Cycle’s 2026 “crash window” with NQ’s fixed volume profile from April’s low to October’s high.
The top orange line is VAH, the second orange line is VAL, and the green line is POC. As long as price holds above POC, we’re just rotating in value. A clean break and daily close below POC opens the door to HVN 1, then VAL & HVN 2 as the next major support shelves. If HVN 1 and HVN 2 both fail, that lines up almost perfectly with Benner’s 2026 panic leg and raises the odds that this isn’t just a pullback, but the start of a larger cycle top in NQ (and likely SPX as well).
My short bias holds while we’re below VAH.
Invalidation: Strong daily close back above VAH.
First downside objective: POC, then HVN 1 and HVN 2 if value breaks and the selling accelerates.
Not financial advice – just my roadmap if the Benner 2026 window is starting to play out.

NQ 100 point calloutTradingview atleast for me doesnt allow me to show the small time frames 1-5m where I have all my markings but the reversal was pretty easy and clear to spot. Your IHS into your bull flag with your rounded bottom.

NQNice retracement from todays FOMC. Going to look for longs once we take out some liquidity to continue to the upside

Calling Santa´s rallyyeap lets ask the Lord and Santa to take us to paradise,
olympus, or any heaven u wish ASAP.
nothing else
Merry Chrismas to Everybody even hades thinkers ;)
