#ETH_BTC (Large Cap Confidence relatively to #BTC)#ETH/BTC
In Next 2 to 3 months this Analysis must work. We can predict a start of a Altcoin Season in December 2025.
Related coins

ETHBTC Weekly Series – Tracking the Shift, Week by WeekETHBTC Weekly – Confluence at the 0.786 Fib
This is ETHBTC on the weekly, now retesting one of the most important Fibonacci levels on the chart: the 0.786 Fib at 0.03470.
This time, price isn’t testing it alone. Just below, we have the 21-week MA and 50-week MA, both providing strong confluence. L
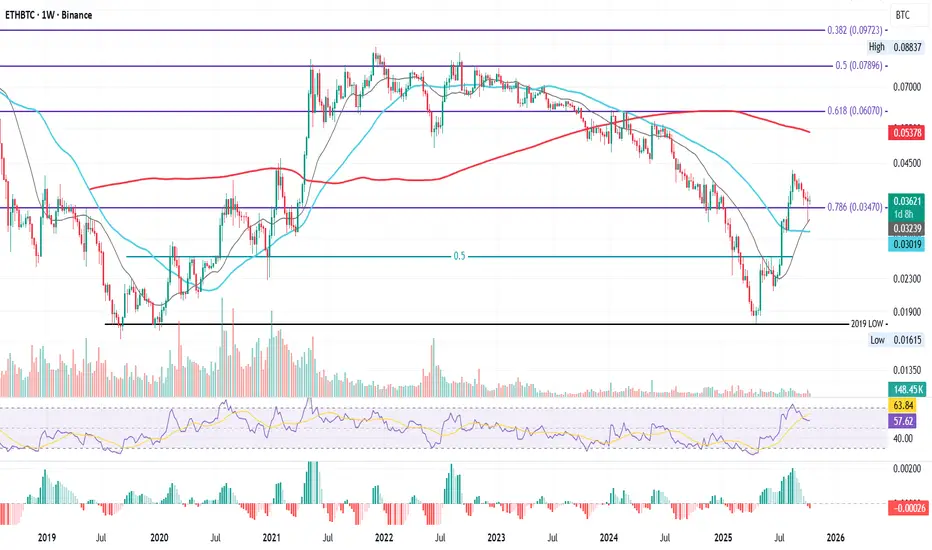

Potential ETH rallyWith a clear break and retest of weekly trend line.
A possible potential wave C or wave 3 rally
We might be heading for a strong bull move across all alt coins

Short trade
📘 Trade Journal Entry
Pair: ETHBTC
Direction: Sell-Side Trade
Date: Thu 30 Oct 25
Time: 12:00 pm
Session: NY Session PM
Timeframe: 1 Hour
🔹 Trade Details
Metric Value
Entry 0.03498
Profit Level (TP) 0.031992 (+ 8.75 %)
Stop Level (SL) 0.03523 (– 0.71 %)
Ri

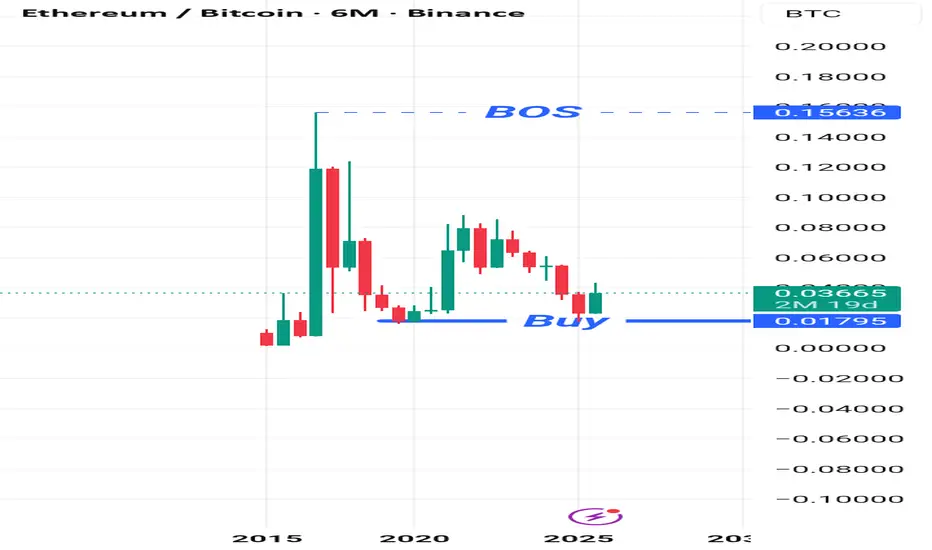
Ethereum is deciding where it wants to live.This is not a trade idea, this is a long term concept, most of my portfolio is swing when bull market comes (monthly/yearly) not trade (daily/weekly).
This is a solid question that will have to be played out in the upcoming years, Ethereum keeps changing its monetary policy and right now has less s

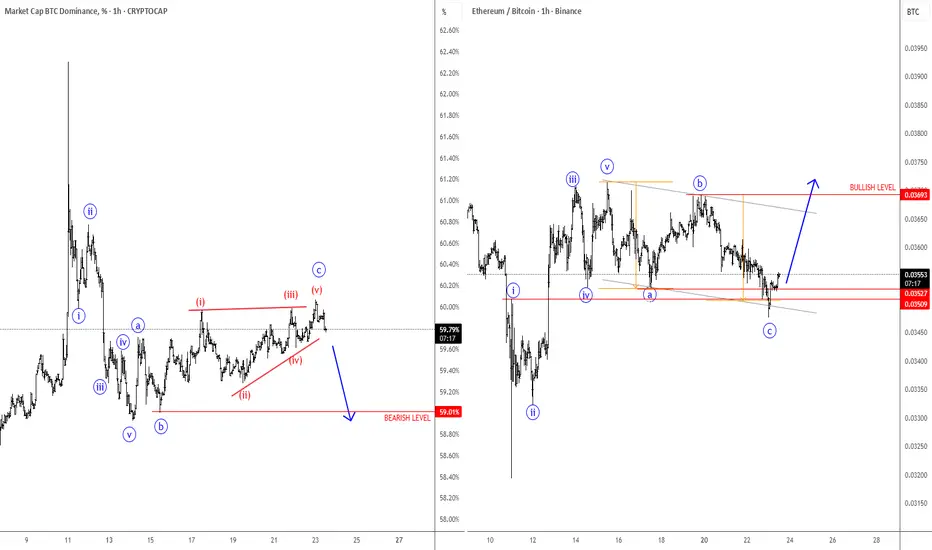
BTC Dominance Is Pointing Lower, While ETHBTC HigherBTC.Dominance chart made an impulsive five-wave decline, which confirms a bearish reversal. Currently, it still appears to be completing wave “c” of an abc correction, which could be forming a potential wedge pattern before further weakness.
As a result, after a five-wave rally on ETHBTC, which co
ETHBTC Rally into Q4📊 Ethereum vs Bitcoin (ETH/BTC) – Weekly Chart Update
ETH/BTC has officially broken out of its long-term downtrend (yellow trendline) that’s been in play since 2022. After the breakout, price is now retesting the previous resistance area — a classic move before potential continuation.
🔹 Key Levels

ETHBTC. Is it almost altseason for Ethereum?Good afternoon, dear traders.
Here is the situation with the ethbtc pair. According to my observations, the altseason for a particular coin occurs when that coin rises in relation not to the dollar, but specifically to Bitcoin.
Here we see the following:
after a strong impulse, the price correcte

ETH is greater than BTCBitcoins value as of right now is greater than Eth but Eth is the one in the uptrend against Bitcoin. My money is on ETH over Bitcoin but who says you can't have both.
See all ideas
Summarizing what the indicators are suggesting.
Oscillators
Neutral
SellBuy
Strong sellStrong buy
Strong sellSellNeutralBuyStrong buy
Oscillators
Neutral
SellBuy
Strong sellStrong buy
Strong sellSellNeutralBuyStrong buy
Summary
Neutral
SellBuy
Strong sellStrong buy
Strong sellSellNeutralBuyStrong buy
Summary
Neutral
SellBuy
Strong sellStrong buy
Strong sellSellNeutralBuyStrong buy
Summary
Neutral
SellBuy
Strong sellStrong buy
Strong sellSellNeutralBuyStrong buy
Moving Averages
Neutral
SellBuy
Strong sellStrong buy
Strong sellSellNeutralBuyStrong buy
Moving Averages
Neutral
SellBuy
Strong sellStrong buy
Strong sellSellNeutralBuyStrong buy
Displays a symbol's price movements over previous years to identify recurring trends.