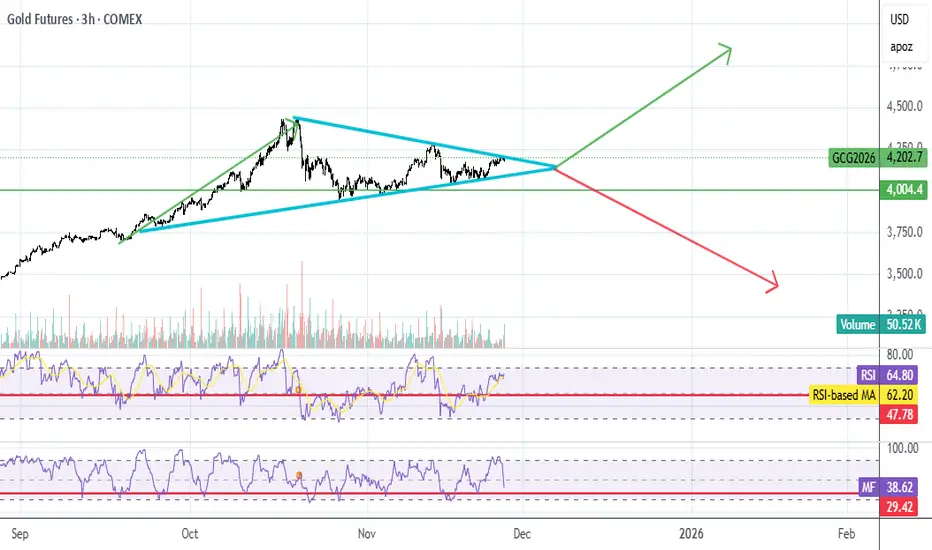
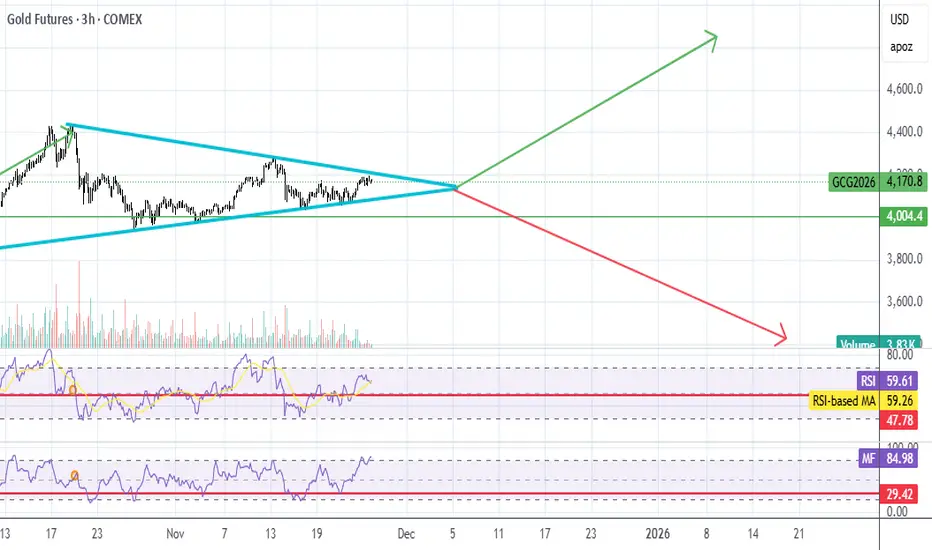
Gold continuation underway?On a 4 hour time frame, looking like we potentially completed a reacc model.
Price potentially continuing to retest and blow through highs.
Will be looking for entries on day trades in the green highlighted area if we start to squeeze.
Ultimate target will be the 1.61 fib of the range. (I use f
Related commodities

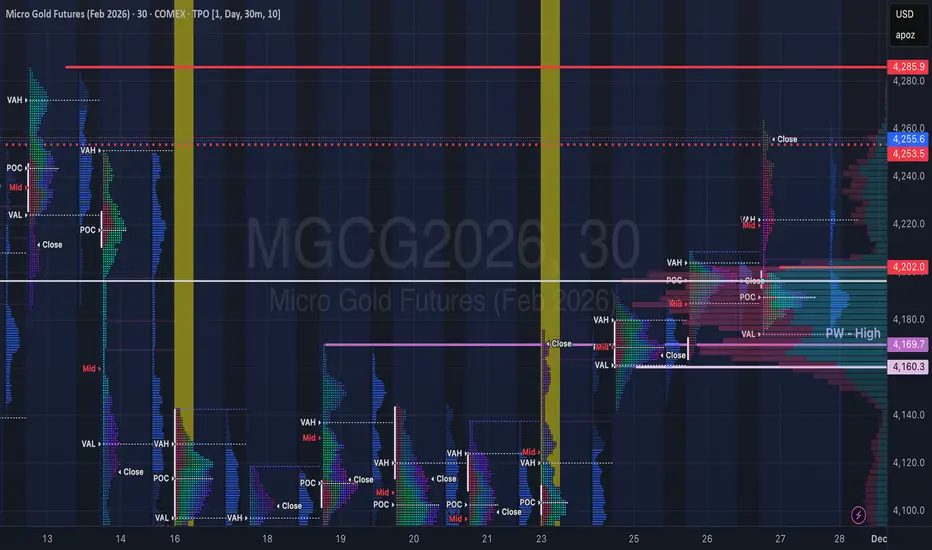
Gold Context: December Open & Holiday Inventory CheckCOMEX_MINI:MGCG2026 COMEX:GC1!
Traders. Here is the context update as we transition into the new month.
Market Context (Holiday Drift): The auction drifted higher on thin volume during the Thanksgiving and Black Friday shortened sessions. This extension was largely driven by a lack of sellers
GC UpdateMFI hasn't quite hit oversold, but it looks like it's melting up out of the pennant. Went long on Dec 26 GLD calls, going for a longer term strategy this time, so I'm not just cycling when MFI goes oversold on the 3 hr.
With longer term calls, it's not a big deal if it does dip.
GC UpdateI probably should have gone long when it hit the bottom of the pennant. Waiting for it to come back down.
Triple Top - Double Bottom. Go Next Golden Shift4125 for a potential reload (supply area). 4275 - to make it all back.

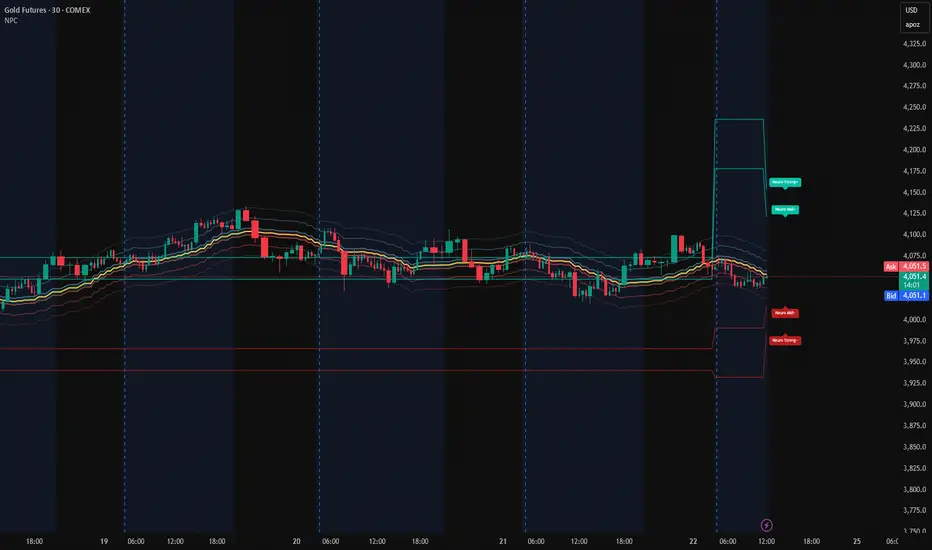
Gold (30m) – NPC Volatility Zones After Range CompressionGold Futures (COMEX), 30m using NeuroPolynomial Channel (NPC)
After the recent range compression, Gold is sitting inside a nonlinear stabilization pocket rather than a momentum phase.
Current Statistical Position:
• Price hovering near NPC Core Cluster
• Distance from lower stress band: ~1.2%
• Di
GOLD (XAU-GC) BUY PLAN📊 Market Sentiment
Market sentiment for GOLD remains strongly bullish. One of the key drivers is the aggressive accumulation by global central banks. Recession concerns and persistent inflation fears continue to position gold as one of the most attractive safe-haven assets.
📈 Technical Analysis

MGC LongsPrice is forming a rounded double-bottom structure right on the rising trendline (blue), suggesting buyers are quietly stepping back in after multiple rejections from the lower demand zone (4,050–4,060).
We’re currently pushing into a key mid-range resistance at 4,085–4,095. This level has acted as

1H Rally-Base-Rally Long Setup | Weekly & Daily AlignedMarket structure remains bullish across the higher timeframes with the Weekly, Daily, and 1H all trending upward. I’m focusing on the most recently created valid 1H Rally-Base-Rally demand zone for a potential long entry.
This zone is high quality because it:
✅ Removed opposing supply zones
✅ Broke

Gold Bearish OutlookExpecting CSE:GC TVC:XAU to be bearish for the rest of the month
- Seasonals lean bearish till EOM
- Commercials are highly short while Small traders are highly long
- OI relatively high
- CLEAR Market structure break
- CLEAR IRL to ERL target

See all ideas
Summarizing what the indicators are suggesting.
Neutral
SellBuy
Strong sellStrong buy
Strong sellSellNeutralBuyStrong buy
Neutral
SellBuy
Strong sellStrong buy
Strong sellSellNeutralBuyStrong buy
Neutral
SellBuy
Strong sellStrong buy
Strong sellSellNeutralBuyStrong buy
A representation of what an asset is worth today and what the market thinks it will be worth in the future.
Displays a symbol's price movements over previous years to identify recurring trends.
Frequently Asked Questions
The current price of 1-Ounce Gold Futures (Oct 2026) is 4,370.25 USD — it has risen 1.25% in the past 24 hours. Watch 1-Ounce Gold Futures (Oct 2026) price in more detail on the chart.
Track more important stats on the 1-Ounce Gold Futures (Oct 2026) chart.
The nearest expiration date for 1-Ounce Gold Futures (Oct 2026) is Sep 28, 2026.
Traders prefer to sell futures contracts when they've already made money on the investment, but still have plenty of time left before the expiration date. Thus, many consider it a good option to sell 1-Ounce Gold Futures (Oct 2026) before Sep 28, 2026.
Buying or selling futures contracts depends on many factors: season, underlying commodity, your own trading strategy. So mostly it's up to you, but if you look for some certain calculations to take into account, you can study technical analysis for 1-Ounce Gold Futures (Oct 2026). Today its technical rating is strong buy, but remember that market conditions change all the time, so it's always crucial to do your own research. See more of 1-Ounce Gold Futures (Oct 2026) technicals for a more comprehensive analysis.