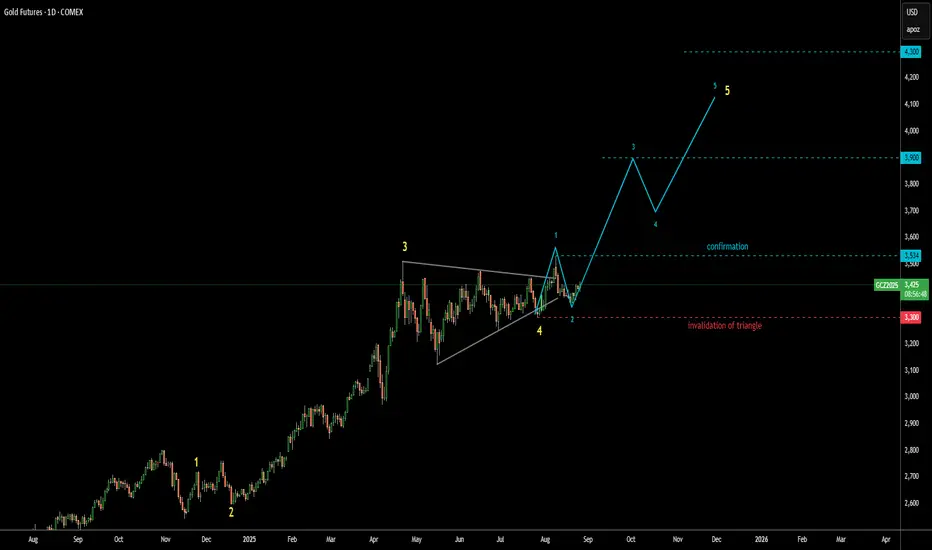
Gold Update 26AUG2025: Bullish Confirmation Above $3,534 The gold futures price has made a U-turn as it didn't trigger Triangle's invalidation at $3,300
This bounce back could be a harbinger of wave 3 within the larger degree wave 5
It will be confirmed once upmove breaks above the top of wave 1 beyond $3,534
I erased the complex correction scenario as the price might be taking off right now
I added the breakdown of the upcoming large wave 5 into smaller 5 waves inside
Target range remains intact between $3,900 and $4,300
4GC1! trade ideas
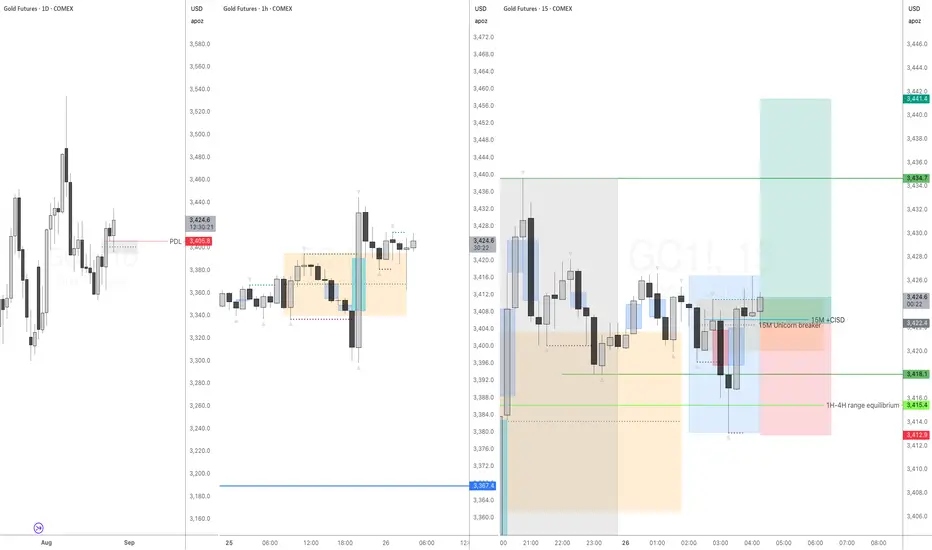
Buying GC based on multiple confluence elementsGC formed Daily +Unicorn breaker. Overnight GC sweapt PDL, formed 1H +unicorn breaker. It returned to the breaker zone and 1H range discount (below equilibrium and formed 15M + Unicorn breaker during London open.
I've never seen more confluence elements in one place. Going for 1:2 RR
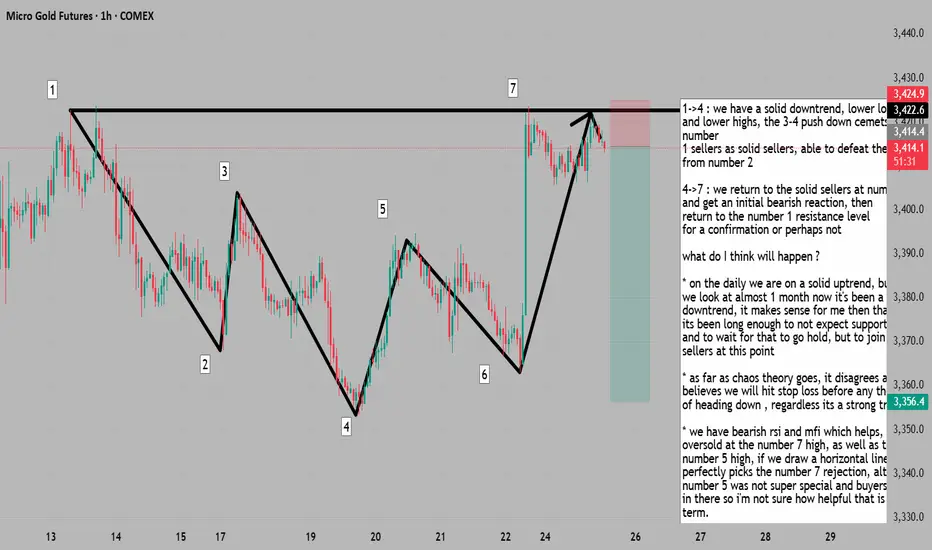
retracement to solid sellers with pullback =SELL it up1->4 : we have a solid downtrend, lower lows
and lower highs, the 3-4 push down cemets number
1 sellers as solid sellers, able to defeat the buyers
from number 2
4->7 : we return to the solid sellers at number 1
and get an initial bearish reaction, then
return to the number 1 resistance level
for a confirmation or perhaps not
what do I think will happen ?
* on the daily we are on a solid uptrend, but if
we look at almost 1 month now it's been a solid
downtrend, it makes sense for me then that maybe
its been long enough to not expect support to hold
and to wait for that to go hold, but to join the sellers at this point
* as far as chaos theory goes, it disagrees and believes we will hit stop loss before any thought
of heading down , regardless its a strong trade
* we have bearish rsi and mfi which helps, they are oversold at the number 7 high, as well as the number 5 high, if we draw a horizontal line, perfectly picks the number 7 rejection, although number 5 was not super special and buyers came in there so i'm not sure how helpful that is long term.
* as far as elliot wave goes we could have completed the fifth wave and are looking for a 3 wave retracement which helps us as we are aiming for the low at number 4
GC 8/26 Outlook – Filling the H4 FVG, Trend Not Ready YetPrice is finally working down into the H4 FVG (3377–3396 zone) after rejecting the Daily FVG overhead (~3425–3440). This is the key area of interest going into Tuesday’s trading sessions.
🔑 Context:
Daily FVG above → unfilled liquidity magnet for the future.
H4 FVG below → currently being filled, acting as the main battleground.
Daily Low (3405) already taken; price now sitting between liquidity pools.
ADX < 25 (HTFs) → No strong trending environment yet, so expect more range-like behavior until a side commits.
📌 What I’m Watching:
Reaction inside the H4 FVG → Looking for either absorption/reversal (bullish case) or continuation through to lower liquidity.
Liquidity Levels:
Midpoint of H4 FVG (~3394).
Bottom of H4 FVG (~3377).
Weekly/Monthly Lows (3353 / 3347) if downside momentum extends.
Killzones:
Asian: Likely to set the range.
London: Could raid deeper into FVG.
NY: Potential reaction leg (either reversal or continuation).
📊 Bias: Neutral → short-term bearish into H4 FVG completion. Waiting for a clear reaction to confirm the next trending move.

xauusd trade ideatook a buy after breaking out the consolidation during the London session and full tp was successfully hit.

Gold Analysis Learning Video 25th AugMarket Given Support At 99000, Expecting to be in sideways and rally on upside if it hold yesterday last momentum zone, I mean at last 2hrs market

Gold Weekly Plan: Daily FVG → H4 FVGGold closed last week with a strong impulsive move into a Daily Fair Value Gap (FVG). As we open the new week, I’ll be watching closely:
Daily FVG (3423–3451): Potential resistance and rejection zone early in the week.
H4 Bullish FVG (3390–3395): If price rejects the Daily FVG, I expect a retrace into this zone to set the weekly low between Monday and Tuesday.
From there, we could see a bullish expansion for the rest of the week.
The key question: Will Gold respect the Daily FVG as resistance before rebalancing lower, or will buyers push straight through?
What’s your bias going into the week? 🚀📉

MGC - WEEK 35 AUG 24TH Looking to see gold run up to take highs this week as dollar drop to take out its own lows. Based on new we should see the most action towards the end of the week.

BASICS: Gold Entry, Doji & Flat ✨ Doji & Flat Strategy for Gold
This strategy will help you identify an entry point when trading gold.
The focus is on spotting Doji and flat patterns that signal potential market direction.
✅ Remember: Consider using this strategy to refine your entries and align with the trend.
#GoldTrading #ForexTrading #Doji #PriceAction #DayTrading #TradingView #GoldXAUUSD #TechnicalAnalysis #SmartMoney #MarketStructure #ForexCommunity #TradeTheTrend

BASICS: CREATE A ZONE #Gold #Zones📈 How to Create a Zone for Trading
This video will walk you step-by-step through creating a trading zone.
The purpose of the zone is to help identify the current market trend for a breakout.
✅ Remember: Consider trading the trend for the best setups and opportunities.
#TradingView #ForexTrading #DayTrading #TrendTrading #BreakoutStrategy #SmartMoney #TechnicalAnalysis #TradeTheTrend #PriceAction #MarketStructure #FuturesTrading #ForexCommunity

GC 4h Chart for today With Jackson Hole upon us, we're going to get some explosive moves. I have mapped out my thoughts on the 4H chart. Good luck, be careful out there

goldi believe cold can corrective until range 3200 dollars
3200 is very important
now, gold start corrective trend that it can time correction or price correction
possible price are 3200 &3070 $

Gold Futures | H4 FVG Fully Filled – What’s Next Into Weekly CloEarlier this week I was watching for price to pull back into the new H4 FVG after we closed above the Daily High. Price rejected from the Asian range mid and dropped cleanly into that zone, ultimately filling the H4 FVG completely.
Now on Friday, price sits right at the Weekly Low (3775.9) and the bottom of that H4 gap. This is a key decision point going into the weekly close.
📌 Scenarios I’m Watching:
✅ Bullish: If price holds this filled H4 FVG / W-L zone, we could see a re-accumulation and a push back toward 3388–3392 rejection block and possibly the Daily High (3394.6) next week.
❌ Bearish: If price fails to hold here, the next liquidity pools below are 3367.4 (D-L) and 3362.5.
📌 Key Levels:
Daily High: 3394.6
Weekly Low: 3775.9
Daily Low: 3367.4
Into Friday close, I’ll be watching whether we get acceptance above this zone (bullish continuation setup) or rejection that opens the door to new weekly lows.
👉 What do you think? Will this area hold as support, or do we see a deeper flush before the week closes?

Gold Technical Outlook Heading Into Powell's Jackson Hole SpeechIt is without a doubt that Jerome Powell's speech at the Jackson Hole symposium is THE event of the week, and possibly the biggest of the month and quarter. That brings the potential for safe-haven flows into gold as we veer towards this key event. I take a look at gold futures market exposure and key levels for gold futures.
Matt Simpson, Market Analyst and City Index and Forex.com

Gold Futures | Watching Pullback into New H4 FVG for ContinuatioPrice pushed bullish after filling ~50% of the prior H4 Fair Value Gap and has now created a new H4 FVG just below. We also closed the day above yesterday’s high (3,394.1), showing strength.
📌 My Bias:
I’m looking for a pullback into the new H4 FVG (around 3,377–3,382) for potential continuation higher. This zone also lines up with the edge of value on the volume profile.
📌 Key Levels:
Daily High (D-H): 3,394.1
Weekly Low (W-L): 3,375.9
Daily Low (D-L): 3,353.3
📌 What I’m Watching:
✅ Acceptance above D-H = bullish continuation.
⚠️ Rejection back below D-H could signal a trap and return into prior value.
Will look for lower timeframe confirmation at the H4 FVG edge before considering longs.
Question for the community:
Do you see continuation higher from here, or are we at risk of a failed breakout?

Shorting Gold again Here we go again.
Gold Should be shorted all the way until 3321 USD.
Its a very clear bearish trend TBH, so i think this should play out right.
To be safe though take the same entry and aim for 3353 usd.
GC : Short levelHere is a great entry point for those who scalp this instrument or pips. The level is marked with a red arrow. It will be active until I report. It may become inactive over time.
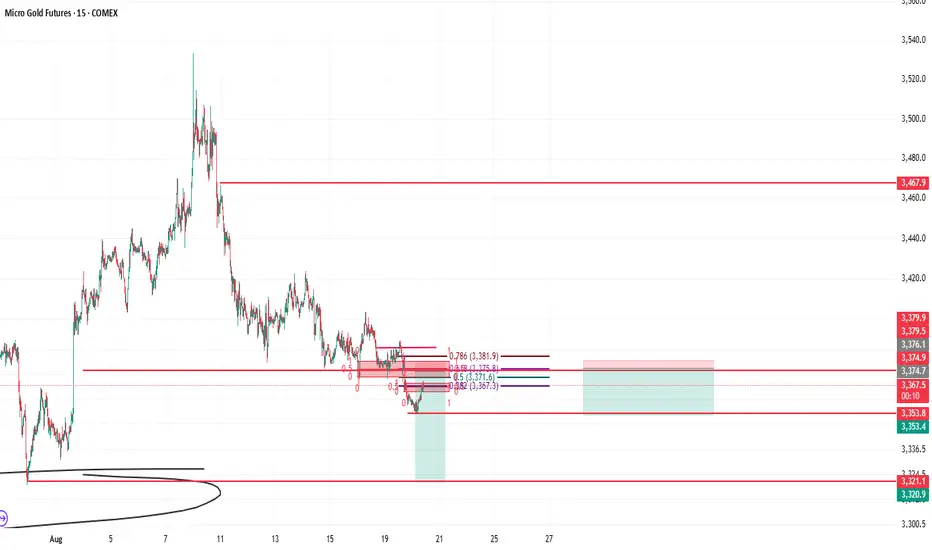
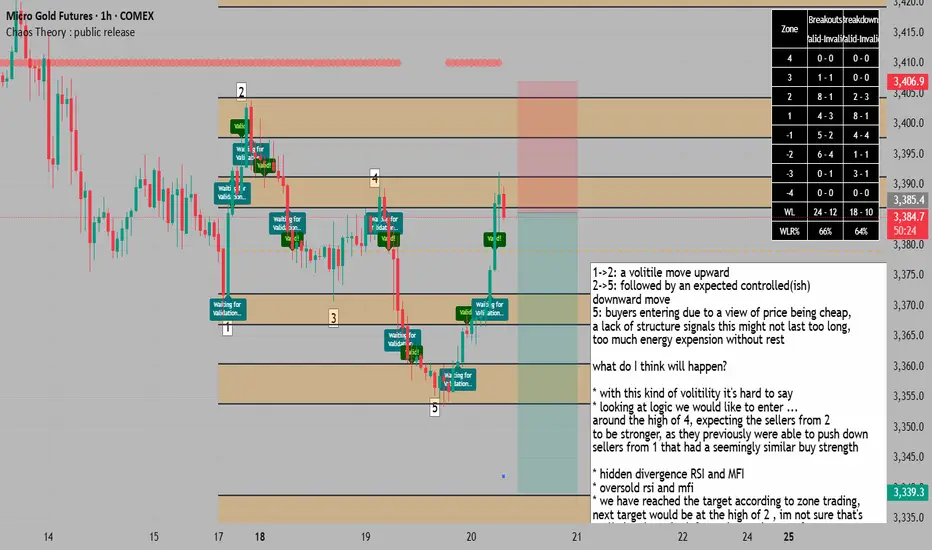
golds highly volitile return to solid sellers presents a = SELL1->2: a volitile move upward
2->5: followed by an expected controlled(ish)
downward move
5: buyers entering due to a view of price being cheap,
a lack of structure signals this might not last too long,
too much energy expension without rest
what do I think will happen?
* with this kind of volitility it's hard to say
* looking at logic we would like to enter ...
around the high of 4, expecting the sellers from 2
to be stronger, as they previously were able to push down
sellers from 1 that had a seemingly similar buy strength
* hidden divergence RSI and MFI
* oversold rsi and mfi
* we have reached the target according to zone trading,
next target would be at the high of 2 , im not sure that's
realistic, given the information we have so far
* we have a 64% success rate of reaching the next low
according to the indicator over the past 2,500 bars
* number 4 is more risky as a stop, but it is still a solid stop
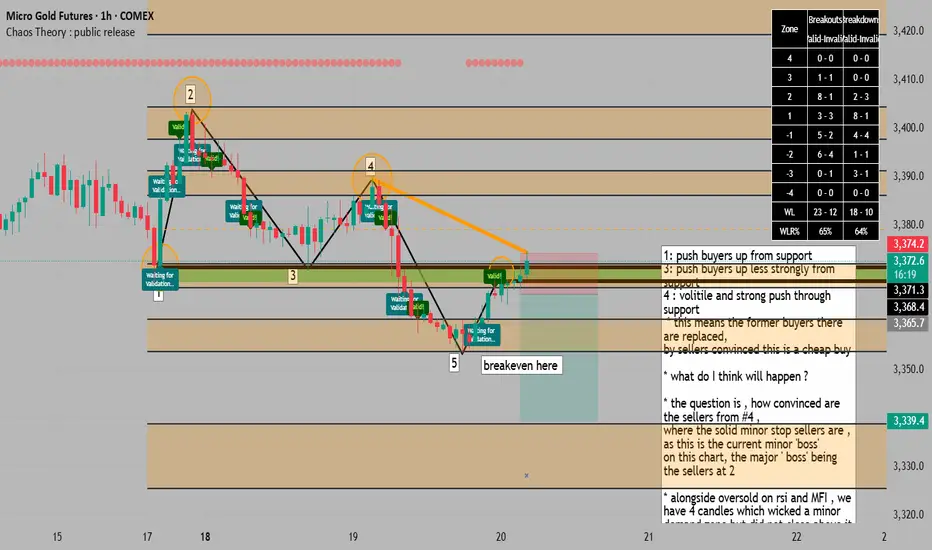
we are potentially at a support turned resistance for a = SELL1: push buyers up from support
3: push buyers up less strongly from support
4 : volitile and strong push through support
* this means the former buyers there are replaced,
by sellers convinced this is a cheap buy
* what do I think will happen ?
* the question is , how convinced are the sellers from #4 ,
where the solid minor stop sellers are , as this is the current minor 'boss'
on this chart, the major ' boss' being the sellers at 2
* alongside oversold on rsi and MFI , we have 4 candles which wicked a minor demand zone but did not close above it
* we also have hidden divergence on the MFI and RSI adding to a sell confluence.
* in my opinion its enough to get us to a 1:1, maybe breakeven and go for a larger target
* according to chaos theory indicator zones,
over the past 2,500 candles, when price closes below a zone, it has a 66% chance of reaching the next zone below, a low below the current candle then prsents a good entry, with a target at the zone below and a good breakeven point when price enters the second travel zone below ( 66% chance we will travel from a orange zone to the next )
* another interesting detail is that when we add horizontal resistance lines from the peak of the rsi and mfi, it co-incides with price peaks, and predicts the next downturn to be here as well.
Moving down for nowThis channel is not providing individualized trading or investment advice, nor is it a banking service, brokerage service, trading service, investment service or money management service

Gold Futures | H4 FVG Test as Asian Session OpensGold Futures completely filled the Daily FVG, so I’ve removed it and adjusted the chart to focus on the H4 FVG zone.
Price is now pressing deeper inside this imbalance, with 3350 as the key level to watch:
Hold above → potential accumulation and rotation higher.
Break below → sweep into 3348 liquidity and possibly lower.
Asian session may provide the first reaction, but I’ll be watching closely for London to confirm whether we hold or break this zone.

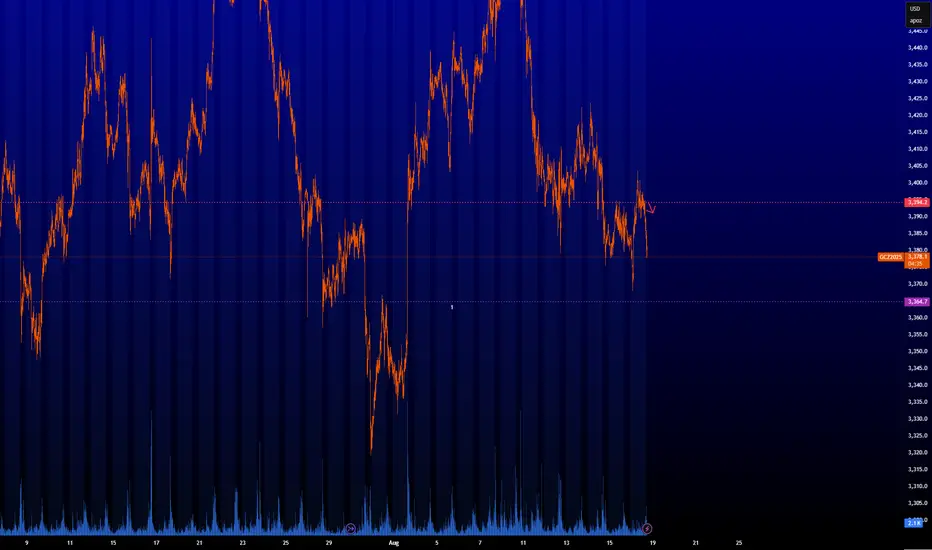
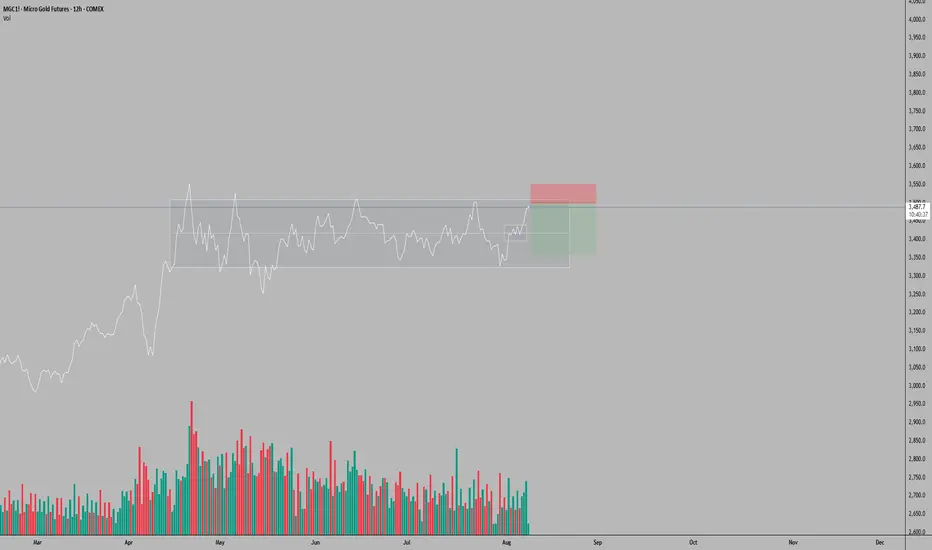
MGC (Micro Gold Futures) Trade Setup – 12H TimeframeOn the 12-hour timeframe, MGC has returned to the upper boundary of the horizontal range established since April 14, 2025. A surge in positive volume on August 7 was preceded by a sharp uptick beginning August 6, followed today by noticeably shallower volume—suggesting volume exhaustion and a potential pause or retracement.
Given today is Friday, profit-taking pressure may materialize following the rapid ascent that began with the breakout above the intermediate 3,400–3,440 zone on August 6. With no major macroeconomic events scheduled that could fuel further upside momentum, a pullback becomes a plausible scenario.
Illustrative Setup: A Sell Limit entry is considered around the 3,500 mark, with a Stop Loss at 3,550—matching the April 25 all-time high—and a Take Profit at 3,360, which aligns with intermediate support within the larger range. This setup offers a risk-reward ratio of approximately 2.8:1, assuming price reacts to overhead resistance and reverts toward the range’s mid-zone.
This analysis is provided solely for educational and entertainment purposes and does not constitute any form of financial or investment advice. Always manage your risk and trade responsibly.
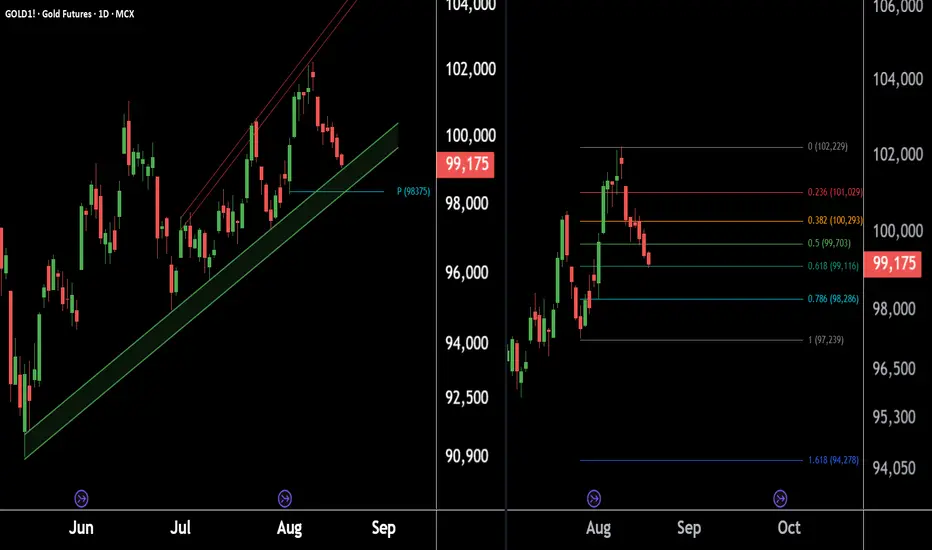
Gold is testing key levels – setup indicates a favorable buying.Here are 2 charts of Gold on the Daily Timeframe.
GOLD1! is approaching its support zone, with key levels at ₹98,200 and ₹98,800.
The Monthly Pivot at ₹98,375 also aligns with this zone, indicating a strong support area.
Fibonacci Golden Ratio is also indicating key support levels around ₹99,200 and ₹98,200, which may act as strong demand zones.
If respected, these levels could trigger a fresh upside move.
Thank You !!