Gold Futures (Jan 2026)
No trades
Contract highlights
Related commodities
Gold. This is what the opportunity setup looked like.Gold.
This is what the opportunity setup looked like way back in August of 2023.
Price was $1922. Now $4226. Over 120% higher.
There is no such opportunity now.

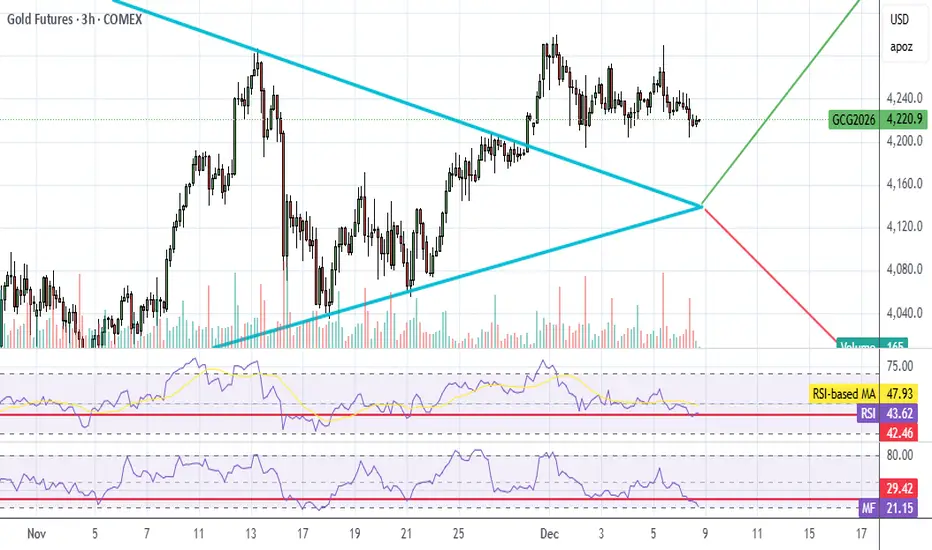
GOLD (XAUUSD): bullish-Neutral! Prepare To Buy!In this Weekly Market Forecast, we will analyze the Gold (XAUUSD) for the week of Dec. 8 - 15th.
Gold closed last week indecisive. It has been moving sideways inside a bullish FVG, that continues to act as support.
Prepare for a short term pullback.... and buy it.
Mindful that FOMC is Wednesday,

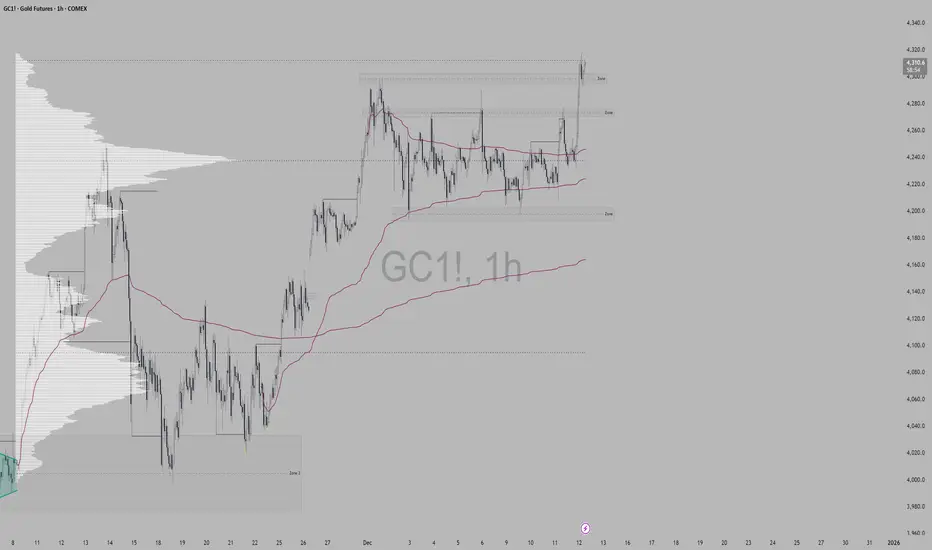
Gold Bulls Are Making Hard Work of New HighsI remain sceptical of gold’s latest bounce and continue to look for signs of a swing high. A less-dovish — or relatively hawkish — Fed cut this week could be the catalyst for a stronger US dollar and lower gold. Either way, it’s hard to imagine gold breaking back above its record high without a mean


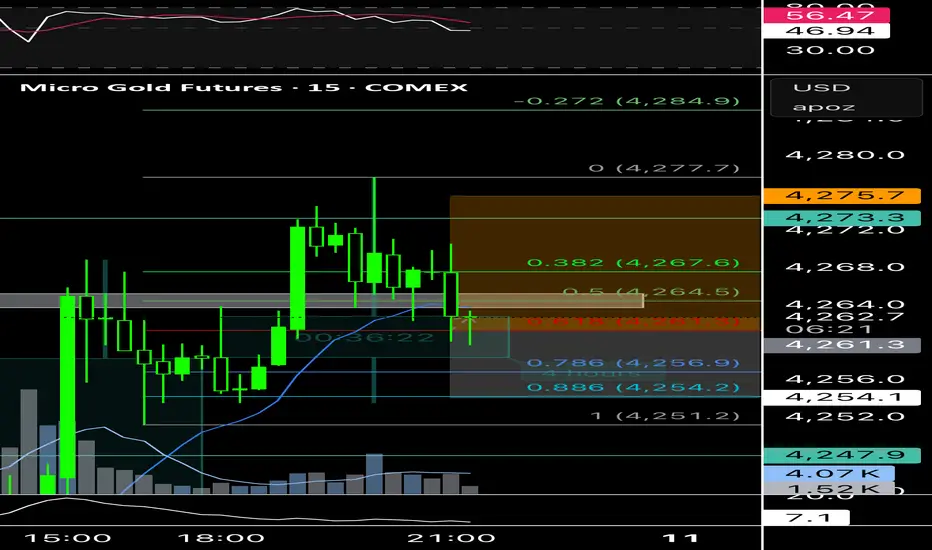
Gold trending or mean revertingTrading near the upper zone may indicate a potential reversal or pullback toward efficiency levels.
GC (gold) updateMFI is touching oversold....
Might take a shot at some GLD calls tomorrow, not sure because Fed meeting on Wed.
GC (gold) UpdateMFI hit overbought and SI (silver) hit overbought on RSI.
Decided it was easier to trade stock options than commodities today. No position.

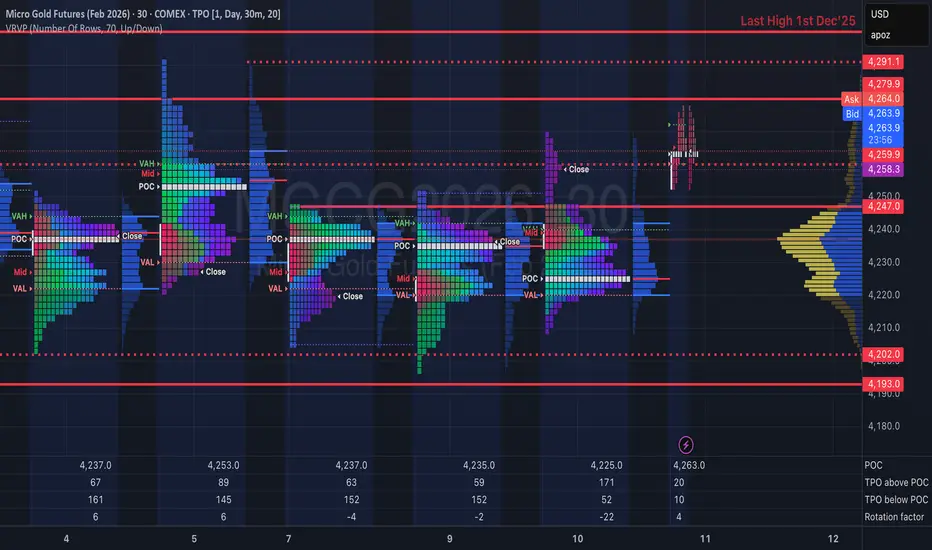
Post-FOMC Context: Policy Divergence & Inventory AdjustmentCOMEX:GC1! FOREXCOM:XAUUSD COMEX_MINI:MGCG2026
Analysis
1. Macro Context (The Currency Auction)
The structural bid for the USD remains valid due to clear Policy Divergence .
* The Fed: The "Hawkish Cut" (25bps) coupled with the signal for a "slower pace" (only one cut projected for 20
Silver now at $58.Way back in mid 2023, before gold and silver broke out.
I suggested silver (was $24) tracks gold's performance vs inflation.
Silver now at $58.

See all ideas
Summarizing what the indicators are suggesting.
Neutral
SellBuy
Strong sellStrong buy
Strong sellSellNeutralBuyStrong buy
Neutral
SellBuy
Strong sellStrong buy
Strong sellSellNeutralBuyStrong buy
Neutral
SellBuy
Strong sellStrong buy
Strong sellSellNeutralBuyStrong buy
A representation of what an asset is worth today and what the market thinks it will be worth in the future.
Frequently Asked Questions
The current price of Gold Futures (Jan 2026) is 4,317.5 USD / APZ — it has risen 0.14% in the past 24 hours. Watch Gold Futures (Jan 2026) price in more detail on the chart.
The volume of Gold Futures (Jan 2026) is 1.00. Track more important stats on the Gold Futures (Jan 2026) chart.
The nearest expiration date for Gold Futures (Jan 2026) is Jan 28, 2026.
Traders prefer to sell futures contracts when they've already made money on the investment, but still have plenty of time left before the expiration date. Thus, many consider it a good option to sell Gold Futures (Jan 2026) before Jan 28, 2026.
Open interest is the number of contracts held by traders in active positions — they're not closed or expired. For Gold Futures (Jan 2026) this number is 3.08 K. You can use it to track a prevailing market trend and adjust your own strategy: declining open interest for Gold Futures (Jan 2026) shows that traders are closing their positions, which means a weakening trend.
Buying or selling futures contracts depends on many factors: season, underlying commodity, your own trading strategy. So mostly it's up to you, but if you look for some certain calculations to take into account, you can study technical analysis for Gold Futures (Jan 2026). Today its technical rating is buy, but remember that market conditions change all the time, so it's always crucial to do your own research. See more of Gold Futures (Jan 2026) technicals for a more comprehensive analysis.