Can it happen?Disclaimer
This content is for informational and educational purposes only and should not be construed as financial or investment advice. The author is not a registered financial advisor. Trading and investing in financial markets involve substantial risk of loss and is not suitable for every investor. Past performance is not indicative of future results. Always conduct your own research and consult with a qualified professional before making any investment decisions.
QOT1! trade ideas
3700This channel is not providing individualized trading or investment advice, nor is it a banking service, brokerage service, trading service, investment service or money management service

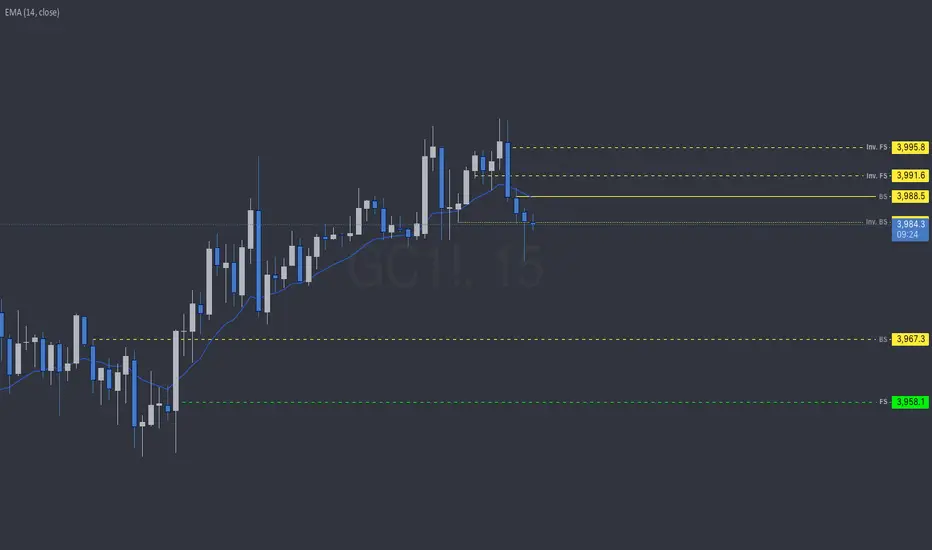
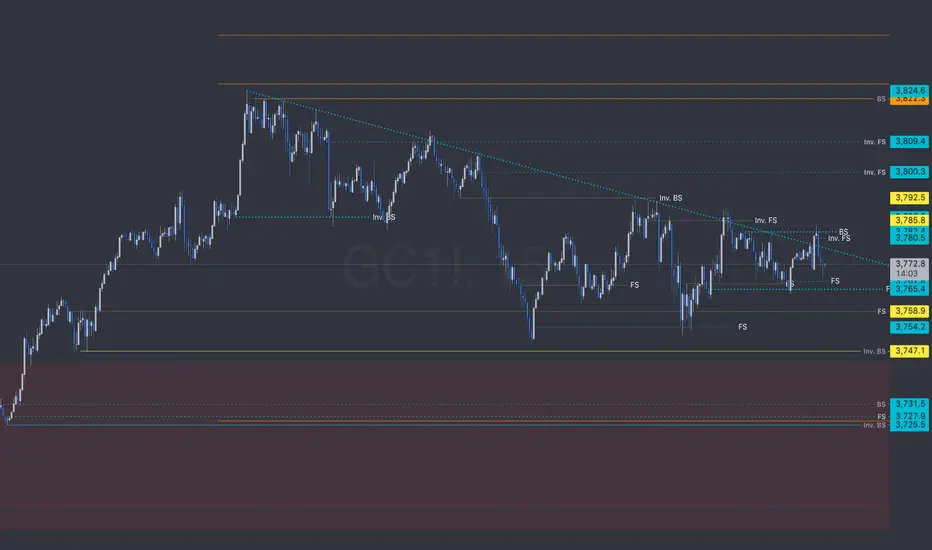
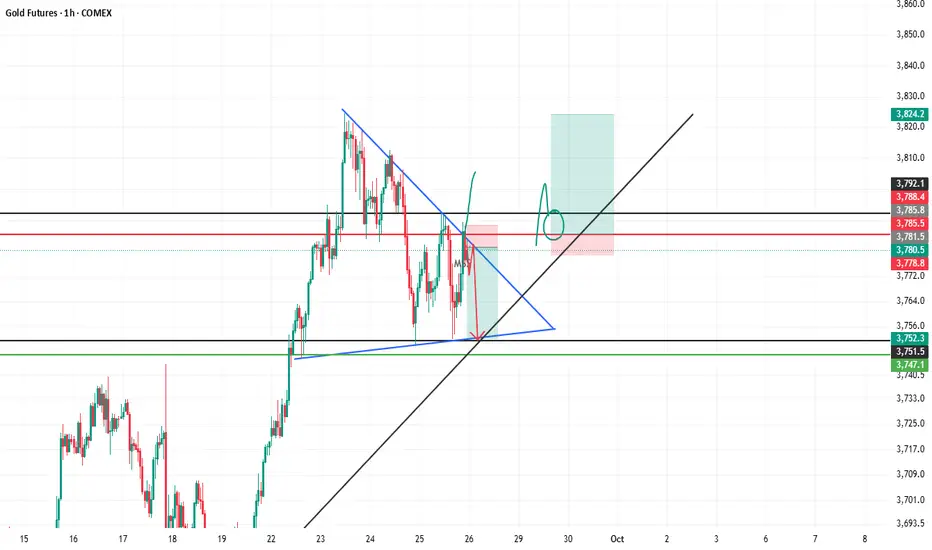
GC - Hourly ideaJust marked the hourly resistance levels as Inv.FS and the solid line BS
support is below price BS dashed line is the hourly level and the green dashed line is the 5min timeframe FS
MCX Gold Futures – Intraday Analysis for 7th Oct 2025MCX:GOLD2!
Gold is trading at 121,603, consolidating just above the zero line (121,583), after a breakout above resistance, followed by mild profit-taking. This is a key inflection zone for either a momentum extension or a retracement.
Bullish Scenario
Long Entry (121,321):
Initiate fresh longs above 121,321, confirming buyers supporting every dip at trend breakout levels.
Additional exposure can be taken at 121,145 (add-long area) if minor dips are absorbed, marking higher lows.
Upside Targets:
122,504 (Target 1): First mapped supply zone and profit booking area.
123,073 (Target 2): Extended bullish target if strong momentum continues.
Stop Loss:
Place below 120,969 (short entry) or progressively trail as price moves up.
Bearish Scenario
Short Entry (120,969):
Shorts trigger below 120,969, marking breakdown of support and handed control back to sellers.
Downside Targets:
120,662 (Target 1): Demand zone and first logical bounce/support area.
120,093 (Target 2): Next extension target for aggressive move.
Stop Loss:
Cover shorts if price retakes 121,321 to avoid losses on failed breakdowns.
Range/Neutral Logic
Zero Line (121,583):
Price at zero line marks market balance; sustained action above encourages further momentum, while repeated rejection here raises risk of short-term pullback to lower supports.
Avoid new trades around zero line unless breakout/breakdown conviction emerges.

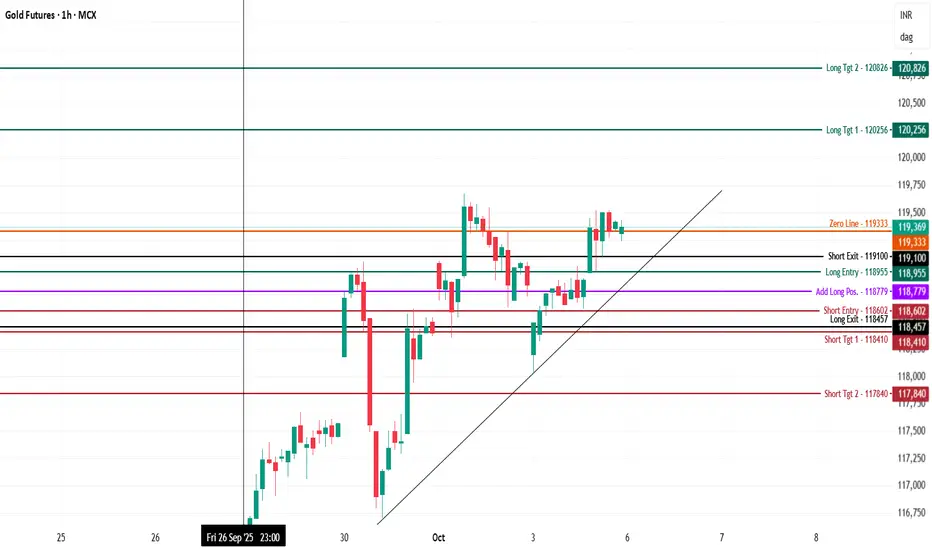
Gold Dec. Futures (MCX) – Intraday Analysis 6th Oct., 2025MCX:GOLD1!
Gold is consolidating at 119,369 after a strong bounce, with price action pressing against a pivotal resistance area (zero line) and testing higher-low support in a sideways-to-bullish formation.
Bullish (Long) Setup
Long Entry (118,955):
Fresh longs are actionable above 118,955 with price holding above recent swing support, confirming buyers’ intent for further upside.
Adds can be managed at 118,779 if dips hold with rising volume and higher lows.
Upside Targets:
120,256 (Target 1): First mapped supply zone and likely profit-booking area.
120,826 (Target 2): Higher bullish extension and next major resistance.
Stop Loss:
Keep stops below 118,602 (short entry area) or 118,457 (long exit) to reduce risk in case of reversal.
Bearish (Short) Setup
Short Entry (118,602):
Shorts activate below 118,602, confirming breakdown of support and shifting momentum to sellers.
Downside Targets:
118,410 (Target 1): Bounce/support area for first profit booking.
117,840 (Target 2): Deeper extension and next major demand zone.
Stop Loss:
Exit shorts if price retakes 118,955 to avoid losses on failed breakdown.
Range/Neutral Logic
Zero Line (119,333):
Current action near the zero line marks the market balance; a sustained close above 119,333 supports bullish momentum, while repeated rejection turns bias sideways or soft bearish.
Wait for a breakout from the zero line for high-conviction trades.
New ATHs for Gold?It seems like every single week, gold has been making new ATHs. With the overall bullish sentiment of the market plus the government shutdown, I don't see price slowing down any time soon.
As long as price is trading above the VWAP on lower time frames (4H, 1H, 15min), we could continue to see ATHs up to $4,000.
Me personally, I've been very cautious trading in these ATH markets. The reason is because price doesn't have much structure to follow. There's no clear vision of the target when entering longs and you're kind of just trading into no-mans-land.
We'll see what price decides to do early in the beginning of the trading week.

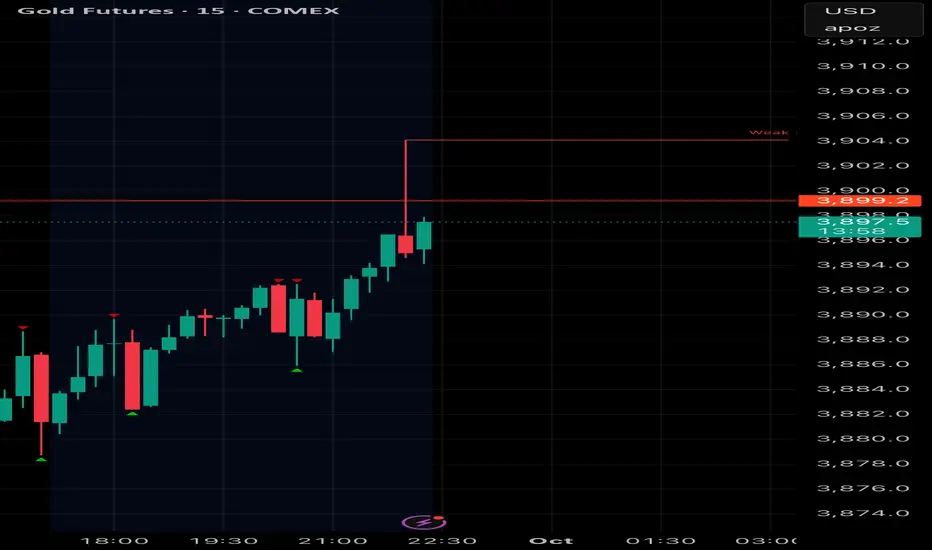
Long trade
Pair/Asset: MGC1! (Micro Gold Futures)
Trade Type: Buyside trade (Trade Idea)
Date: Tuesday, 30th Sept 2025
Session: 6:00 AM
Trade Details
Entry: 3841.3
Profit Level (TP): 3914.2 (+1.90%)
Stop Level (SL): 3822.0 (-0.50%)
Risk–Reward (RR): 3.78
Technical Narrative
Market Context:
Gold retraced sharply overnight, creating multiple fair value gaps (FVGs) on the 5m chart.
The strong rebound at ~3820 formed a structural low + BSLQ sweep, suggesting liquidity taken below support. A bullish recovery candle with high volume confirmed aggressive buyers stepping in.
Entry Justification:
Entry at 3841.3 coincided with the demand zone after the sweep.
EMA/WMA realignment showed a momentum shift back to the upside.
Volume spike supported bullish intent.
Target Rationale:
TP at 3914.2 chosen just below the prior swing high & inefficiency zone.
Broader context: If USD shows weakness during the NY session, upside continuation is likely?
DYX (1Hr TF) overview

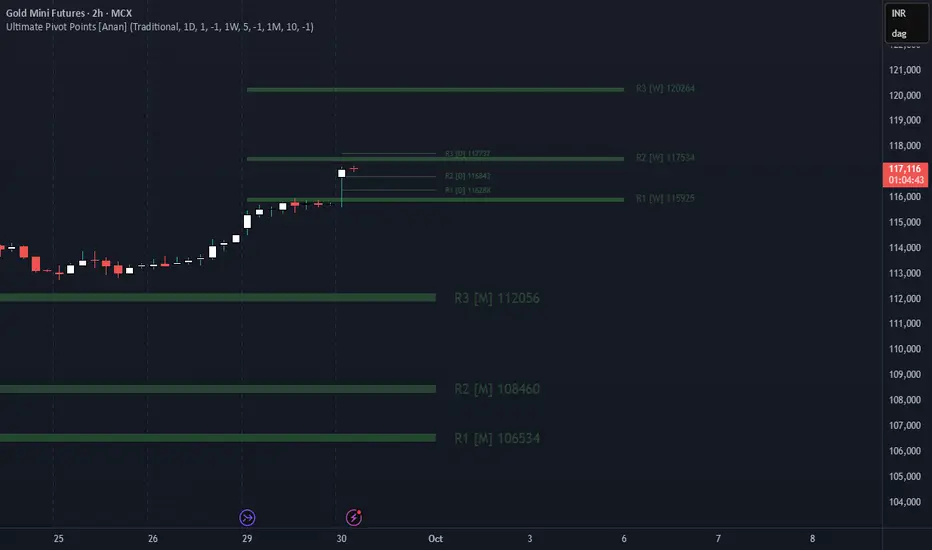
Gold buy above 117815 tgt 120000 positonalGold buy above 117815 tgt 120000 positonal
Gold buy above 117815 tgt 120000 positonal
Gold buy above 117815 tgt 120000 positonalGold buy above 117815 tgt 120000 positonalGold buy above 117815 tgt 120000 positonalGold buy above 117815 tgt 120000 positonalGold buy above 117815 tgt 120000 positonalGold buy above 117815 tgt 120000 positonalGold buy above 117815 tgt 120000 positonalGold buy above 117815 tgt 120000 positonalGold buy above 117815 tgt 120000 positonalGold buy above 117815 tgt 120000 positonalGold buy above 117815 tgt 120000 positonalGold buy above 117815 tgt 120000 positonalGold buy above 117815 tgt 120000 positonal

GC quick pullback?I’m looking to take another quick pullback here with tight stops and targeting higher timeframe lows. Here goes.
Mcx Gold Profit-taking takes placeA proper analysis and technical analysis(gold)
The latest 4-hour chart of MCX Gold Futures (INR) reveals a strong uptrend supported by channel movement and clear Fibonacci retracement levels. The price has recently tested channel resistance around 116,625 INR and faced a minor pullback to 116,170 INR, suggesting short-term consolidation after a rally.
### Trend and Channel Analysis
- The price is moving within a rising channel, indicating persistent bullish momentum .
- The current price (116,170 INR) is slightly below recent highs, respecting the upper boundary of the channel, which signals overextension and potential for a corrective pullback .
- As long as the price remains inside the channel, the upward trend is intact.
### Fibonacci Retracement Levels
Key Fibonacci levels derived from the recent upmove:
- 0.0%: 116,625 INR (Recent swing high; nearest resistance)
- 23.60%: 113,656 INR (First near-term support; significant for shallow corrections)
- 38.20%: 111,819 INR (Secondary support; may attract buyers on stronger dips)
- 50.00%: 110,335 INR (Critical mid retracement; if broken, trend may weaken)
- 61.80%: 108,850 INR (Key retracement; strong institutional level)
- 78.60%: 106,737 INR (Major support if deep correction occurs)
### Support and Resistance
- Immediate resistance is at 116,625 INR; breaking above could trigger strong bullish momentum .
- Immediate support is at 113,656 INR; a drop below this could bring further downside to 111,819 INR .
- Psychological support is at 110,000 INR, just below the 50% retracement, and another at 108,750 INR near 61.8% .
### Momentum and Outlook
- The trend remains bullish unless the price closes below 113,656 INR .
- Watch for a buying opportunity if the price retests the lower channel or key Fibonacci levels without breaking the channel downward.
- If price sustains above 116,625 INR, next round of buying could push towards 118,000 INR.
### Summary Table
| Level | Price (INR) | Significance |
|-----------------|-------------|-------------------|
| Channel High | 116,625 | Immediate Resistance |
| 23.6% Fib | 113,656 | First Support |
| 38.2% Fib | 111,819 | Deeper Support |
| 50% Fib | 110,335 | Mid-Support |
| 61.8% Fib | 108,850 | Strong Support |
| 78.6% Fib | 106,737 | Deep Correction |
Overall, the outlook is bullish above 113,656 INR, but a close below key retracement levels could invite deeper correction towards 110,335 or 108,850 INR . Aggressive traders can ride the trend with tight stops below key levels, while conservative traders may wait for price action confirmation at or near Fibonacci supports.

MCX Gold Resistance can be face at 117550 levels MCX Gold Resistance can be face at 117550 levels after all Mean reversion is ment to happen
Dollar also shown some weakness recently.
Gold & Silver Push Higher as Markets Hunt for Safe HavensGold continues its climb, breaking through past resistance levels as investors flee into safety ahead of U.S. fiscal turmoil and rate ambiguity.
Meanwhile, silver is turning heads — rallying hard on the back of both safe-haven demand and its dual role as an industrial metal.
Together, they’re painting a picture: when anxiety and uncertainty rise, the metals step into the spotlight.
Gold hit an all-time high of $3,833.37/oz, closing at $3,829.63, on strong safe-haven demand amid U.S. shutdown fears and rate cut expectations.
It then extended gains, reaching $3,842.76/oz, putting it on track for its best month since August 2011 with an ~11.4% gain in September.
Silver also surged: it climbed to a 14-year high near $46.85/oz as industrial demand and safe-haven flows bolstered interest.
Earlier this year, silver broke $35/oz, a level not seen in over 13 years, driven by tight supply and robust demand in tech & green energy sectors.

Ichimoku Setup Gold FuturesAfter finding support on the top of the cloud, price action confirmed a bull continuation trend. Looking to exit trade around the $4000 level

Long GoldSo, without overexplaining: the overall structure is bullish, but the 15-minute timeframe is still bearish for now. You can either wait for the 15-minute to shift bullish before entering long, or take a more aggressive entry from the identified area. Also, keep in mind it’s Monday — the opening can be choppy. Still, the market currently looks bullish overall.

Is Gold Heading Higher?At the beginning of last week, price saw a much needed pullback on the commodity. Earlier news in the week was the catalyst that gold needed to head down.
Some thought we would head down further but gold seems to have traversed the entirety of its pullback, with price trading not too far away from its ATH.
With the dollar still gaining strength from future rate cut uncertainty, is this just a test of the top before further moves down? Could be. But future rate cut uncertainty might not be enough to keep gold from making new highs.
We do have a pretty news heavy week with NFP looming at the end of the week. Remember to always trade with caution.

Gold MCX Nov. Future - Intraday Technical Analysis - 29 Sep. MCX:GOLD2! Gold Futures are consolidating at 114,908, hovering just above the key zero line and prior resistance, after a robust recovery that has shifted the trend for the short term.
Bullish Scenario (Long Logic)
Long Entry (114,584):
Initiate longs above 114,584 as the hourly structure confirms a strong reversal from the recent swing low, and price is respecting the ascending trendline.
Additional positions can be scaled in near 114,432 if retracement holds above this support, aligning with higher lows in price structure and rising volume.
Upside Targets:
115,685 (Target 1): Represents the first major resistance and expected profit-booking zone, corresponding to recent swing highs.
116,175 (Target 2): Upper mapped resistance, extension target for momentum continuation if bullish sentiment escalates.
Stop Loss:
Maintain stops below 114,280, or tighter at 114,156 (Long Exit), protecting against immediate breakdowns and false breakouts.
Bearish Scenario (Short Logic)
Short Entry (114,280):
Shorts activate below 114,280, as this would break both horizontal and trendline supports, shifting bias back in favor of bears.
Downside Targets:
114,097 (Target 1): Bounce area and possible reversal/support from previous sessions.
113,607 (Target 2): Deeper target, highlights aggressive selling and fall to lower end of range.
Stop Loss:
Shorts should be covered above 114,891 if breakdown fails and price recovers above zero line and consolidation resistance.
Neutral/Trend Logic
Zero Line (114,891):
Acting as a pivotal point; hourly close above it favors continuation of uptrend, while failure to hold may result in quick reversion.
Rising trendline support and strengthening volume confirm buyers are in control, unless price slips below 114,432.
This structure supports disciplined setups for both breakout and reversal trades, with each scenario anchored by logical risk management and intraday targets.
Follow Chart Pathik for more Bullion related updates.

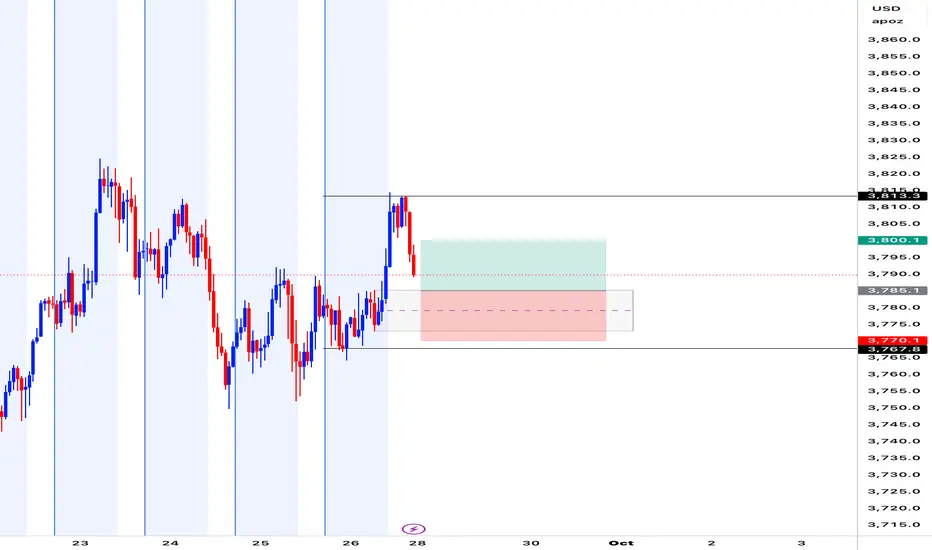
Gold Futures – 1H Demand Zone Retest | Bullish Setup📊 Trade Breakdown:
Pair: Gold Futures (MGC1!)
Timeframe: 1 Hour
Bias: Bullish
Type: Demand Zone Retest
Entry: Waiting for bullish engulfing confirmation
Stop Loss: Below 3770 demand zone
Take Profit:
• TP1: 3785
• TP2: 3813
Risk-to-Reward: ~1:2–1:3 depending on entry, but the overall target is 1:1!
⸻
📌 Key Confluences:
• Price broke previous structure high, confirming momentum shift
• Fresh 1H demand zone left behind after breakout
• Waiting for retest + signs of rejection before executing
• Bullish engulfing candle will be my trigger
• Trend bias still showing strength intraday
⸻
⚙️ Trade Setup:
Plan is to let price come back into demand, reject cleanly and print a bullish engulfing candle. That’s when I’ll look to execute long. Stop will be tucked below the zone around 3770 to keep risk defined. First target set at 3785 (recent structure) with extended target at 3813 (previous high/supply zone).
If the zone fails or no bullish confirmation shows, the setup is invalid and I stay flat.
⸻
🧠 Mindset:
Patience is everything. I’d rather wait for price to come back to me than force a trade. No FOMO. Clean invalidation, clean R:R. Confidence comes from the structure break and demand zone. Trusting the process and letting the trade play out on my terms.
“Trade Simple, Live Lavish”
Thanks LuxAlgoI have been searching for some tools and developing on my own. The trend line by LuxAlgo is far superior to what I was thinking about making. The combination of these two indicators and reading the market has already made a significant improvement in my winning rate and precision. Adding my own custom indicators, it's been difficult to lose on gains on bar replay.

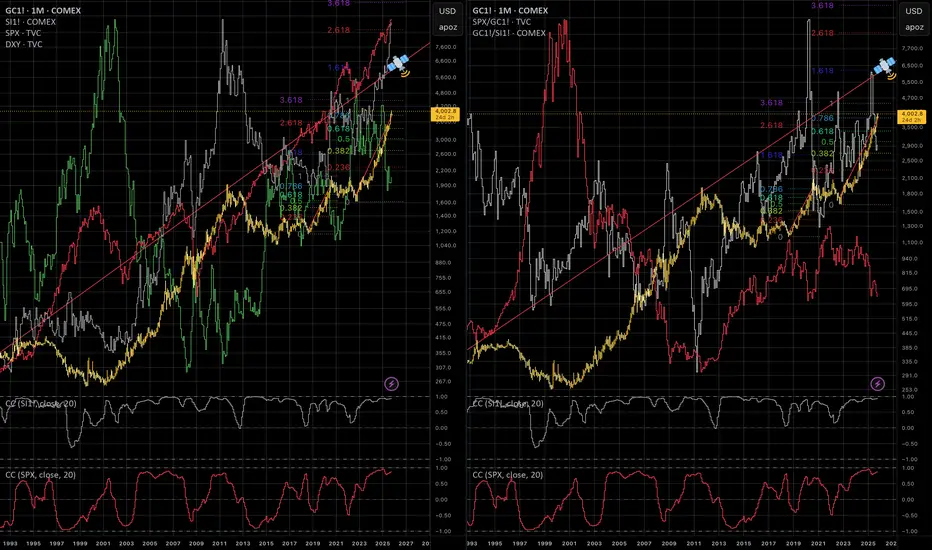
Gold futuresOver the past four weeks, gold futures have continued their rally, climbing above the 3800 mark. Formally, the trend remains bullish; however, from a historical perspective, it has already lasted nearly 1000 days, which leaves little room for further growth. In the event of a downward correction, gold could target the support level in the 3200-3300 range.
Long-term trend: Up
Resistance level: 3800
Support level: 3200-3300

GC 9/2615min TimeFrame.
I didn't post yesterday but I updated the levels as if I did and made them dotted as "tested"
dashed lines = "untested"
dotted 2x = origin levels where trends originate / bridge&Flip scenarios.
Yesterday we saw how pandora's box operates by laddering into a wedge. We'll watch as it breaks tomorrow.
at a quick glance it looks like a 15min timeframe is where $ is at. I didn't follow the breadcrumbs into the 5min timeframe but sure there are levels down there influencing price and break out scenario better than the 15min timeframe but we'll still see it breakout.
Gold analysis So Gold is in a consolidation in a form of a symmetrical triangle.
I think even though the trend overall is bullish, but we still in a consolodation, and likely the price visits the lower trendline.
other than that, price will break out above the upper trendline, and then we flip bullish then.
Dont go with size on that bearish trade as i could be very very wrong in my analysis.
Global news might have us Stalling on Gold! Chart Context (MGC Futures, H1/H4)
Price stalled out after rejecting the H4 bearish zone (3791.4–3769.9).
Yesterday’s downside move lost steam before fully reaching the deeper H4 bullish demand (3746.3–3735.2).
We’re now compressing between Daily High (3792.1) and Daily Low (3752.0).
Fundamentals:
U.S. geopolitical/military headlines (Defense Secretary Pete Hegseth ordering hundreds of generals/admirals to an urgent meeting at Quantico, Sep 30) are creating uncertainty, which could trigger safe-haven flows in gold.
Bias Going Into Friday:
Watching for liquidity sweep of yesterday’s lows (~3752/DL). If swept and reclaimed, could trigger bullish continuation.
Alternatively, a clean break & hold above yesterday’s high (~3792/DH) sets up momentum longs targeting 3812+ (previous imbalance).
No trade in the middle of the chop — patience until liquidity is taken on one side.

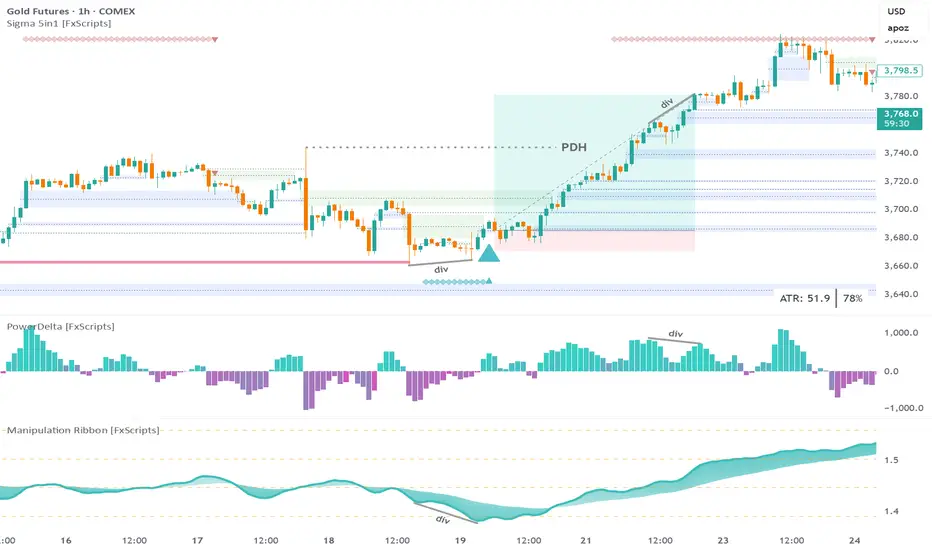
GC Futures 15m: 6.6:1 trade executed using Sigma Trading SystemStep 1: wait for a sweep of daily liquidity
Note: the sweep must be confirmed for any of the other confluences to be valid
Step 2: wait for a bullish marker to be drawn by the Reversal Print indicator
Tip: set an alert if you don’t want to spend all day staring at the chart
Step 3: look for a divergence with either the PowerDelta Oscillator or, in this case, the Manipulation Ribbon
Info: the Manipulation Ribbon detects areas of price manipulation by Market Makers vs areas where it is trading in a natural, price-driven state
Step 4: the entry is a tap of the most recent confirmed FVG
FYI: all the drawings on the main chart are created by the Sigma 5-in-1 indicator
SL: low of first candle that forms the entry FVG
Tip: for a more conservative approach the recent swing low could also be used
TP: bearish divergence with the PowerDelta Oscillator
Note: gold was at an all-time high so anything beyond the Previous Day High (PDH) posed a risk however for a more conservative approach you could exit half your position at the PDH