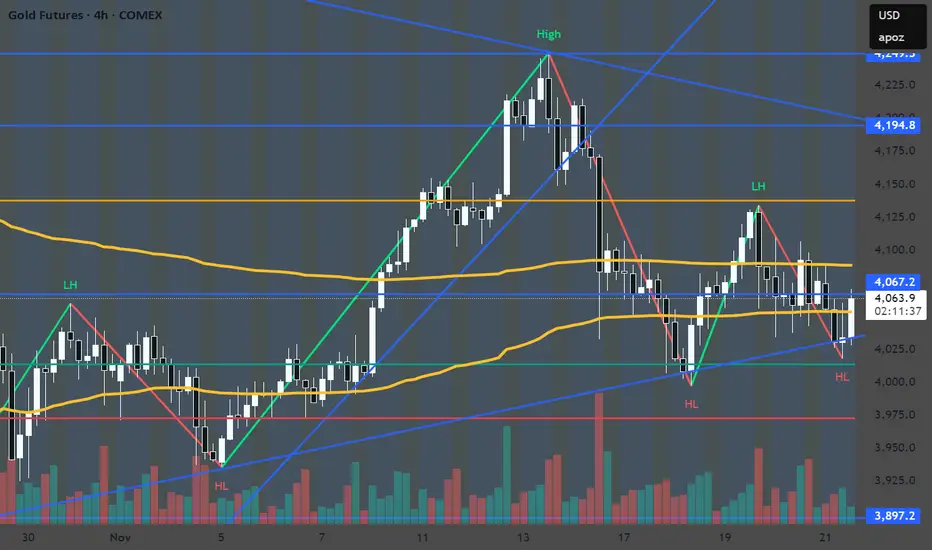
Gold holding trendline push towards 4194 possibleA Long position towards 4194 is likely as we see that this trendline holds firm.
Trade ideas
GOLD (XAU-GC) BUY PLAN📊 Market Sentiment
Market sentiment for GOLD remains strongly bullish. One of the key drivers is the aggressive accumulation by global central banks. Recession concerns and persistent inflation fears continue to position gold as one of the most attractive safe-haven assets.
📈 Technical Analysis
Price has completed the expected accumulation phase and broke out strongly from the accumulation range. This former range has now turned into a clear demand zone. Price has pulled back into this zone again and is currently testing the $4060 level.
📌 Game Plan
The $4060–$3900 zone is my primary buy zone. I will continue accumulating within this range.
My first target is $4250, followed by $4400, which aligns with new all-time-high expectations.
If price closes below $3900 on the daily, this idea becomes invalid. Therefore, my stop is a daily close under $3900.
💬 If this breakdown aligns with your outlook, like and comment below.
For deeper sentiment and strategy insights, subscribe to my Substack free access available.
⚠️ This analysis is for educational purposes only and does not constitute financial advice. Always conduct your own research before trading or investing.

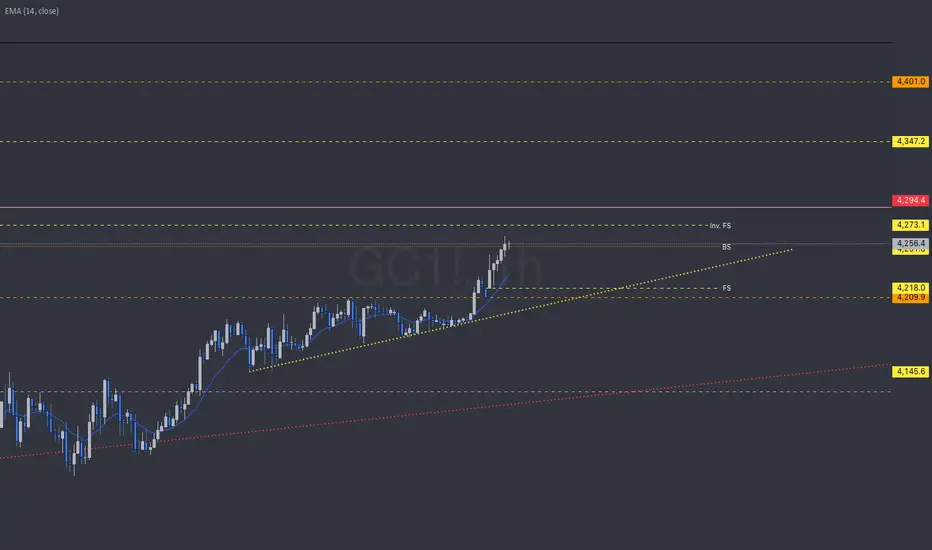
GC | Week 49 | 1hr chartT.A explained -
BackSide (BS)
FrontSide (FS)
Inverse BS (Inv.BS)
Inverse FS (Inv.FS)
BS & FS levels are expected support when dashed lines, tested when dotted and resistance when solid lines.
The inverse is true for the Inv. BS Inv. FS levels, they are resistance as dashed lines, tested as dotted and support as solid lines.
Monthly timeframe is color pink
weekly grey
daily is red
4hr is orange
1hr is yellow
15min is blue
5min is green if they are shown.
strength favors the higher timeframe.
2x dotted levels are origin levels where trends have or will originate. When trends break, price will target the origin of the trend. its math, when the trend breaks, the vertex breaks too so the higher timeframe level/trend that breaks, the more volatility there could be as strength in the orders flow in to fuel the move.
Triple Top - Double Bottom. Go Next Golden Shift4125 for a potential reload (supply area). 4275 - to make it all back.

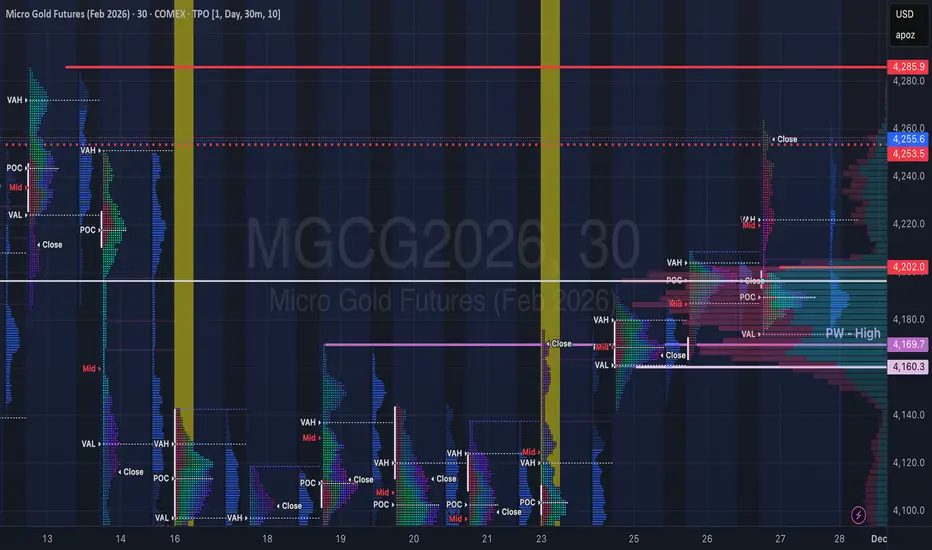
Gold Context: December Open & Holiday Inventory CheckCOMEX_MINI:MGCG2026 COMEX:GC1!
Traders. Here is the context update as we transition into the new month.
Market Context (Holiday Drift): The auction drifted higher on thin volume during the Thanksgiving and Black Friday shortened sessions. This extension was largely driven by a lack of sellers rather than aggressive buying, leaving us with a "thin" structure.
Structure & Inventory: We have significant inventory resting back at 4200 – 4170, sitting just above the Previous Week High (PWH).
Current Action: Price is holding the holiday extension.
The Problem: The move up lacks heavy volume support. We have "unfinished business" below at the breakout zone.
Plan & Execution: Monday marks the start of fresh December flows. I am not interested in chasing this extension at these highs.
Stance: Flat / Patient.
The Test: I want to see Gold rotate back to test the inventory at 4200 – 4170 first.
Decision: We need to verify if buyers will defend this zone (turning old resistance into support) before committing to a new directional bias.
Talk to you for the next update.
1H Rally-Base-Rally Long Setup | Weekly & Daily AlignedMarket structure remains bullish across the higher timeframes with the Weekly, Daily, and 1H all trending upward. I’m focusing on the most recently created valid 1H Rally-Base-Rally demand zone for a potential long entry.
This zone is high quality because it:
✅ Removed opposing supply zones
✅ Broke a valid trendline on departure
✅ Shows strong impulsive buying pressure
✅ Is the most recent institutional demand on the 1H
Plan is to wait for price to return into this zone for continuation with the higher-timeframe trend. As always, patience and risk management first no chasing price.

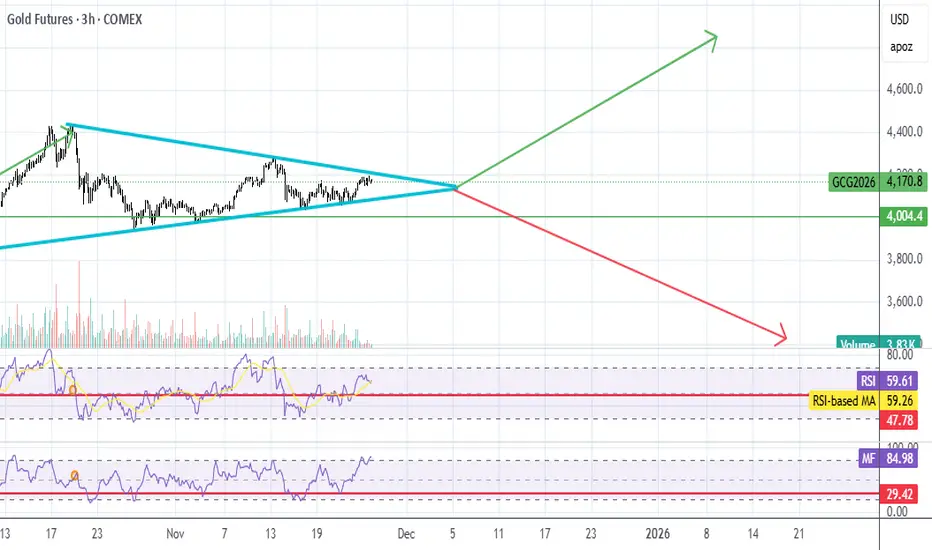
GC UpdateMFI hasn't quite hit oversold, but it looks like it's melting up out of the pennant. Went long on Dec 26 GLD calls, going for a longer term strategy this time, so I'm not just cycling when MFI goes oversold on the 3 hr.
With longer term calls, it's not a big deal if it does dip.
Gold continuation underway?On a 4 hour time frame, looking like we potentially completed a reacc model.
Price potentially continuing to retest and blow through highs.
Will be looking for entries on day trades in the green highlighted area if we start to squeeze.
Ultimate target will be the 1.61 fib of the range. (I use fibs as targets when we are running blue skies.
I will want to see us riding the 10EMA on the hour, entries will be made on the 1 min on flag breakouts while above and riding the 10EMA on the 1 min.

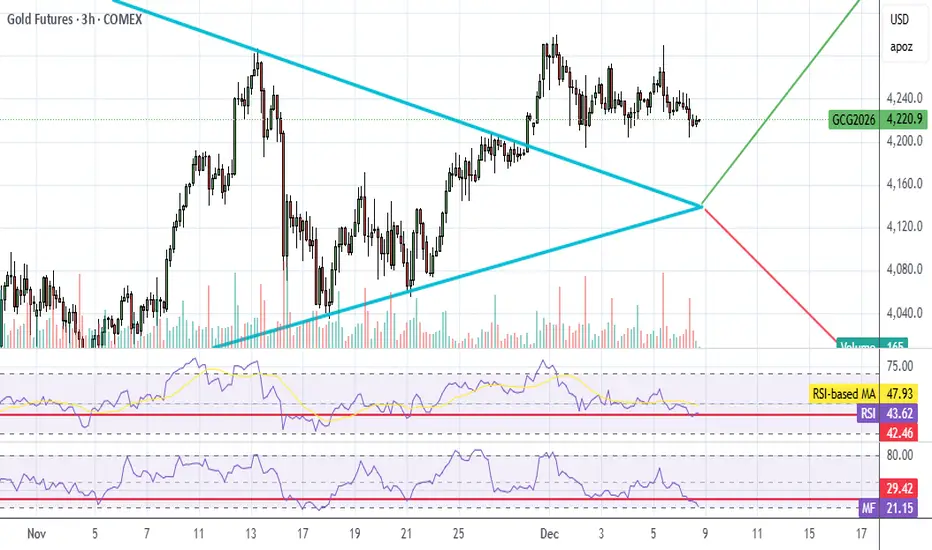
GC UpdateI probably should have gone long when it hit the bottom of the pennant. Waiting for it to come back down.
GC | Week 50 | 1hr chart T.A explained -
BackSide (BS)
FrontSide (FS)
Inverse BS (Inv.BS)
Inverse FS (Inv.FS)
BS & FS levels are expected support when dashed lines, tested when dotted and resistance when solid lines.
The inverse is true for the Inv. BS Inv. FS levels, they are resistance as dashed lines, tested as dotted and support as solid lines.
Monthly timeframe is color pink
weekly grey
daily is red
4hr is orange
1hr is yellow
15min is blue
5min is green if they are shown.
strength favors the higher timeframe.
2x dotted levels are origin levels where trends have or will originate. When trends break, price will target the origin of the trend. its math, when the trend breaks, the vertex breaks too so the higher timeframe level/trend that breaks, the more volatility there could be as strength in the orders flow in to fuel the move.

GC (gold) updateMFI is touching oversold....
Might take a shot at some GLD calls tomorrow, not sure because Fed meeting on Wed.
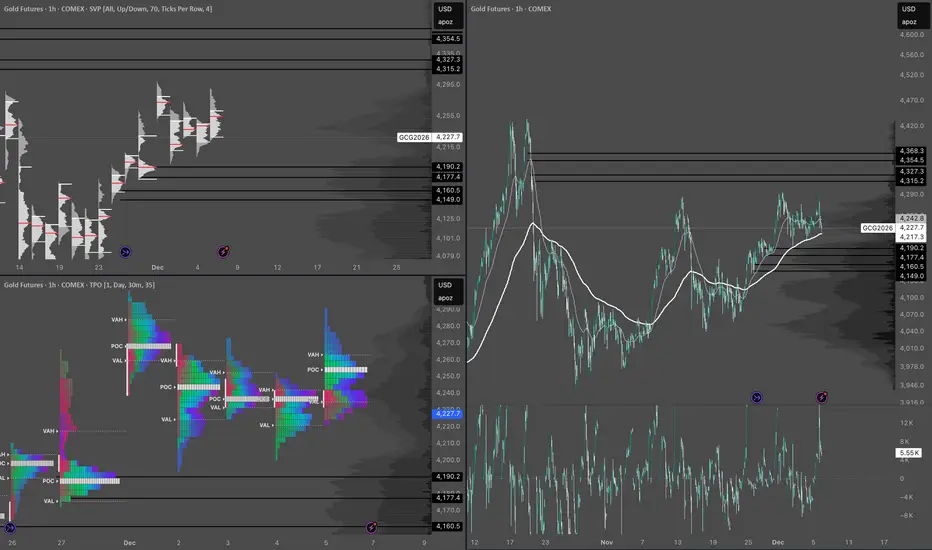
Gold Outlook – Key Levels I’m WatchingThese are the zones I’m currently expecting on gold. If price continues to move lower, those are the areas I’ll be watching for potential long entries. I’m noticing relatively high volume in the lower region, which suggests the market feels comfortable operating within those levels.
However, in the upper zones, volume drops significantly, indicating we are outside the fair value area. In these regions, you don’t need heavy market buy volume to move the price, which implies volatility is likely to increase once price returns there.
Gold Value Rotation & Lack of ConvictionFOREXCOM:XAUUSD COMEX_MINI:MGCG2026 COMEX:GC1!
Traders. Context update for the remainder of the week.
Market Context (The Rotation):
The auction has rotated back into yesterday's Value Area and POC (Point of Control).
• The Driver: This move was primarily driven by mechanical short covering rather than initiative buying.
• The Problem: There is no evidence of "new money" (OTF) entering the market to sustain a directional trend. The auction is simply balancing.
Structure & Inventory:
• Balancing: Price is chopping between the GEX levels (Gamma levels), finding acceptance around the 4244 POC.
• Momentum: Stalled. The market is waiting for a catalyst from the Dollar (DXY), which is currently consolidating at lows.
• Behavior: Every breakout attempt is failing to find follow-through, confirming a mean-reversion environment.
Plan & Execution:
Given the lack of conviction, I am not looking for trend trades this week.
• Stance: Range Bound / Two-Way Trade.
• Tactics: Fade the edges of the balance. Expect price to remain tethered to the POC until new information enters the market.
Talk to you for the next update.
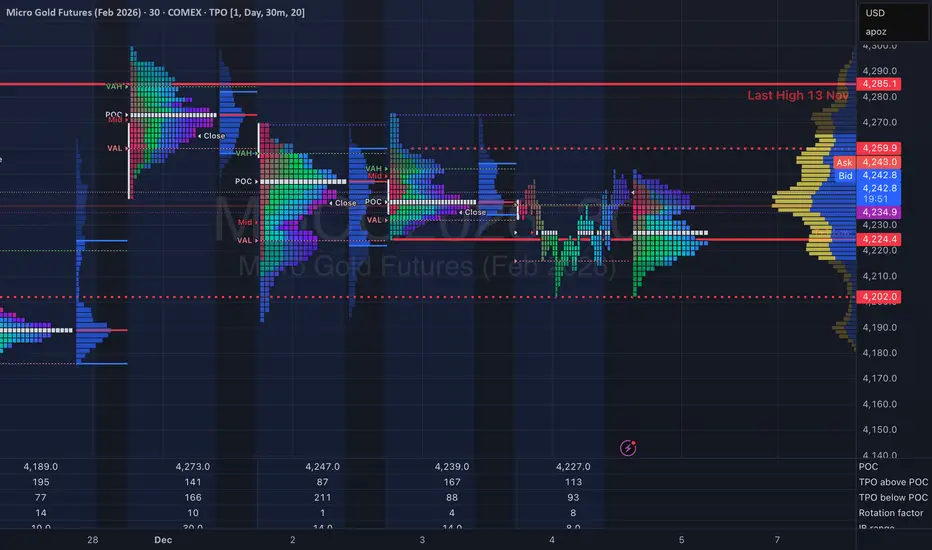
Balancing Range & The 4190 PivotCOMEX:GC1! COMEX_MINI:MGCG2026 FOREXCOM:XAUUSD
Traders. Update on the current auction structure.
Market Context (No New Money): We have yet to see any "New Money" or Initiative Buying enter the market. Yesterday developed as another Balance Day, capped by some late-session liquidation.
The Reality: The auction remains range-bound between 4,290 (High) and 4,190 (Low). Without a fresh catalyst, price is simply rotating within this established bracket.
Structure & Key Levels:
Bullish Scenario: If Gold can hold acceptance above Yesterday's Low, the rotation favors a re-test of the upper distribution around 4,260 – 4,270 later this week.
Bearish Scenario: The line in the sand is 4,190. A breakdown and acceptance below this level changes the context significantly, likely dragging the auction down to repair the November Balance Area (~4,100).
Plan:
Stance: Neutral / Range Trading.
Execution: Fading the extremes of the 4290-4190 range until we see a breakout with volume confirmation.
Talk to you for the next update.

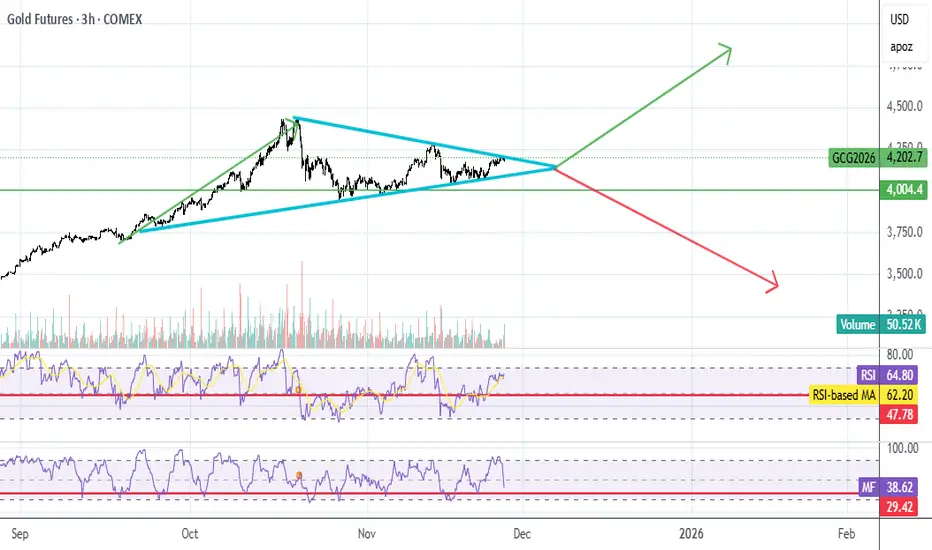
Symmetrical Triangle🟦 Symmetrical Triangle Behavior
It represents a volatility contraction and indecision.
It usually follows a strong prior move — and in this case, the run-up before November 27–28.
Because the run-up was bullish, statistically the probability leans slightly toward a bullish breakout, but breakouts must be confirmed, not predicted.🚨 What Matters Most
🧾 Levels to Watch (approximate)
These need validating as price evolves, but based on your drawing:
Breakout Zone (Bullish): ~4,260–4,270
Breakdown Zone (Bearish): ~4,190–4,200
📉 If It Breaks Down
Targets could be measured using the height of the triangle:
Rough move target: 40–60 points from breakout/breakdown.

Gold (GC1!) Forecast: The Squeeze & Release Path via DSRTL MatriCategory: Trend Analysis / Chart Patterns
Symbol: GC1! (Gold Futures)
In this analysis, we use the DSRTL-ML (Dynamic Support & Resistance) engine to map the current structural context for Gold. The indicator is tagging the state as “TESTING RES – Bias: Neutral”, highlighting a consolidation phase right underneath a major resistance band. Structurally, this is a spot where static friction meets dynamic momentum.
1. The Current Structure: Compression Phase
The Matrix currently sits at S2 | D3 (Testing Resistance).
- The Ceiling (Static R): Price is capped by a high-volume resistance node (orange zone: ~4.24K–4.31K), acting as a lid on price action.
- The Floor (Dynamic S): At the same time, the rising DSRTL trend line (dynamic support) is pushing the lows higher inside the channel.
Taken together, this can be viewed as an early ascending-triangle–style squeeze: price is consolidating between a flat static lid and a rising dynamic floor, while DSRTL keeps the official bias neutral and labels the state as a resistance test.
2. Path of Least Resistance
The dashboard shows a positive Net Delta of +8.36K, suggesting that buyers have been active right below the resistance band.
- Projected Path: In the absence of a clear break, price can continue to oscillate within this narrowing pocket between static resistance and the rising channel.
- Breakout Vector: The combination of constructive volume flow and an upward-sloping dynamic channel creates a supportive backdrop if an upside break occurs, even though DSRTL itself still prints a Neutral bias here.
3. Scenario & Structural Objectives
- Trigger: A confirmed close above the top of the Static R band (~4.31K) would move the Matrix out of its S2 “testing” state toward an S1-type breakout environment.
- Next Structural Area: Above that level, the next area of interest becomes the upper rail of the DSRTL dynamic channel (pink line), where the system could start migrating toward its higher “extension” states.
Invalidation:
If price breaks and closes below the rising pink dynamic support, the bullish squeeze thesis is invalidated. In that case, the Matrix would likely rotate toward Neutral/Bearish or Bearish-Pullback configurations, depending on how price interacts with the underlying static support band.
Disclaimer: This forecast is based on structural scenarios derived from the DSRTL-ML engine and is provided strictly for educational and illustrative purposes.

GOLD - H12Since October 27 Gold is recovering into an upward move. The chart is still respecting the Major Blue ascending channel. But recently a new Purple one evolved inside the Blue channel.
The Strong support zone was retested twice pushing the chart into a favorable bullish momentum. The 2nd Support zone is actually being confirmed as solid, right now.
If it holds, we will have a strong upward move inside the purple channel, or a less powerful one potentially respecting the middle blue line. Both Scenarios will be eventually on the way to breach the red zone & making a new Top.
If the actual support zone is weak, Gold will breach down the purple channel, back to the Blue one, closing in again on the Strong Support zone.
I still favor an Upward move even if it might go a bit sideways 1st.
Trade Safe.

Gold | Zone-Based High-RR Long Setup | Bullish BiasGold | Zone-Based High-RR Long Setup | Bullish Bias
I currently carry a bullish bias on Gold. Price is approaching a pre-defined demand zone marked on the chart — this is a reaction area, not a prediction. I only engage after confirmation from within the zone. If the zone holds, continuation toward the marked resistance is expected. If it fails, the idea is invalidated immediately. IT WORKS 90% OF THE TIMES THOUGH!
This setup is independent of session or time. Execution, risk management, and psychology decide the outcome — analysis only provides the framework. Risk is always predefined. No chasing. No emotional trades.
Trade the zone. Manage the risk. Let the market do the rest.
Happy Trading.

Short Covering vs. New Money (Waiting for the Catalyst)COMEX:GC1! COMEX_MINI:MGCG2026 FOREXCOM:XAUUSD
Traders. Mid-week context check as we wait for institutional commitment.
Market Context (The Mechanical Bounce): As noted in the previous update, yesterday's rotation was driven by Short Covering—old money exiting profitable shorts—rather than Initiative Buying (New Money) entering fresh longs.
The Trap: Short covering can lift the auction, but it lacks the sustained energy to break new highs. We are seeing price drift without aggressive volume.
Inventory: We are currently balancing above the Previous Week High (PWH). This zone is holding, but the auction feels "heavy" without fresh inflows.
The Fundamental "Hold" (Why Big Funds are Waiting): "Big Funds" are likely sidelined ahead of the tier-1 data dump. They need clarity before deploying serious capital for the week.
Today (Wed): ADP Payrolls & ISM Services.
Friday: The NFP (Non-Farm Payrolls).
The Reality: Until these numbers drop, we may remain in a "chop" or "balance" phase as institutions hedge rather than commit.
Plan & Execution:
Bias: Slightly Long, strictly conditional on holding above the PWH.
The Trigger: I need to see Follow Through. We need a volume spike (Initiative Buying) to confirm that "New Money" has arrived to defend this breakout.
Caution: If we fail to find acceptance higher and lose the PWH, expect a rotation back inside the previous balance to find liquidity.
Talk to you for the next update.

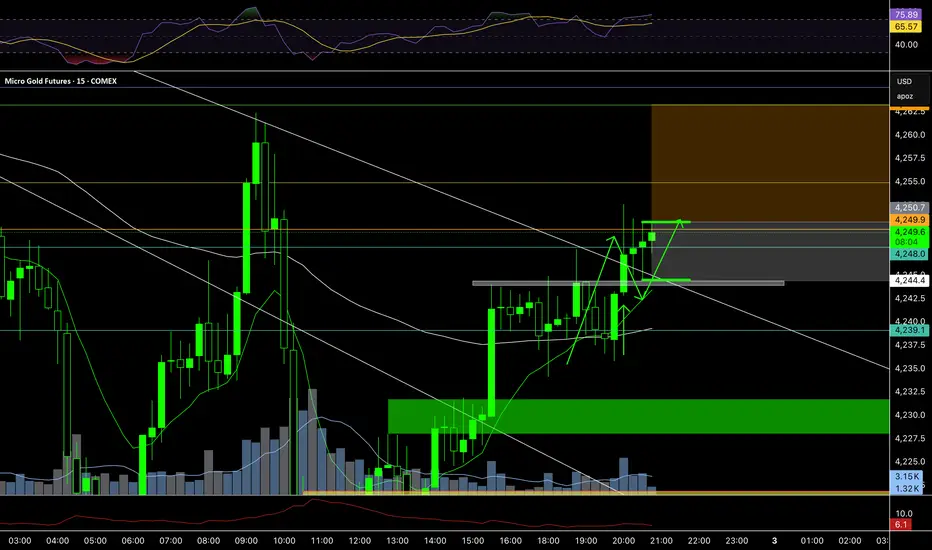
ASIA: B&R/RSTime: 20:45 GMT
4H Setup: REV/IBM
4H Confluences: EMA13, RSI reversal break, Weekly Level
15m Setup: B&R/RS
15m Confluences: EMA13, EMA89, EMA Cross
Target: 2R
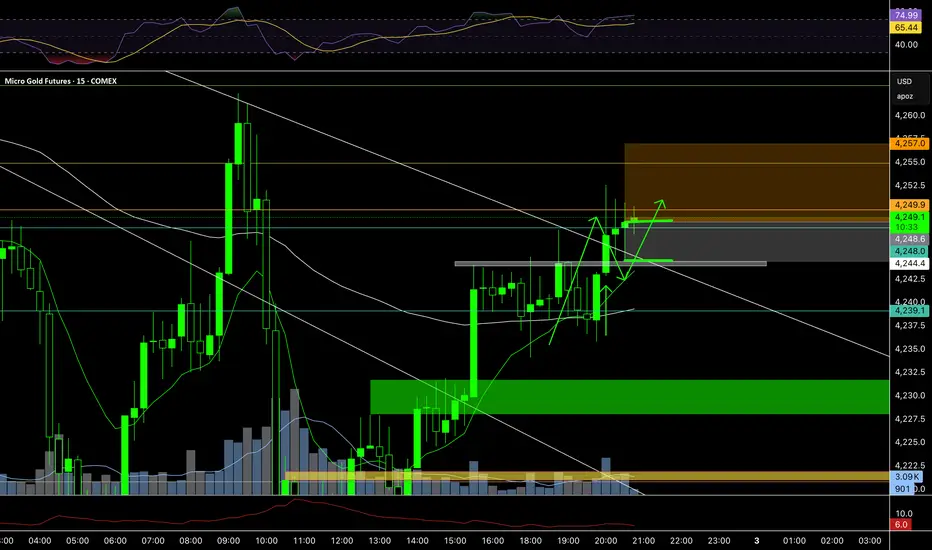
ASIA: B&R/RTime: 20:45 GMT
4H Setup: REV/IBM
4H Confluences: EMA13, RSI reversal break, Weekly Level
15m Setup: B&R/R
15m Confluences: EMA13, EMA89, EMA Cross
Target: 2R
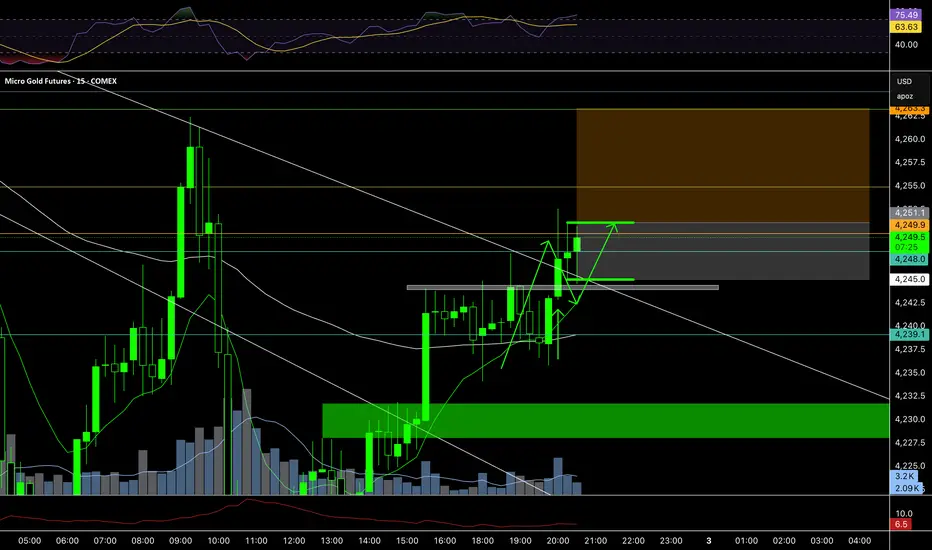
ASIA: B&R/OBMTime: 20:30 GMT
4H Setup: REV/IBM
4H Confluences: EMA13, RSI reversal break, Weekly Level
15m Setup: B&R/OBM
15m Confluences: EMA13, EMA89, EMA Cross
Target: 2R Bread & Butter
ASIA: BO/MTime: 20:15 GMT
4H Setup: REV/IBM
4H Confluences: EMA13, RSI reversal break, Weekly Level
15m Setup: BO/M
15m Confluences: EMA13, EMA89, EMA Cross
Target: 2R Bread & Butter
