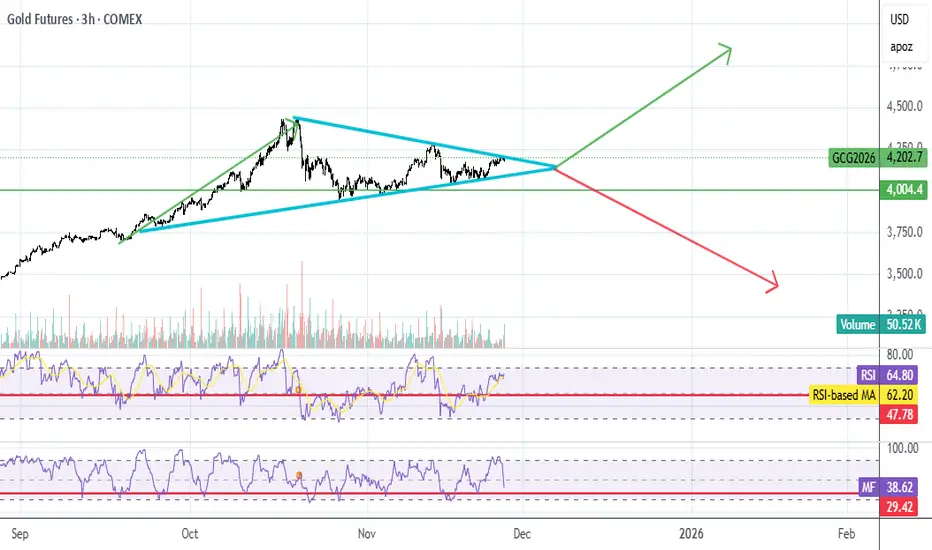
GC UpdateMFI hasn't quite hit oversold, but it looks like it's melting up out of the pennant. Went long on Dec 26 GLD calls, going for a longer term strategy this time, so I'm not just cycling when MFI goes oversold on the 3 hr.
With longer term calls, it's not a big deal if it does dip.
Micro Gold Futures
No trades
Market insights
The Truth About Timeframe Analysis – Chapter 2FAFO – F*-AROUND-FIND-OUT FRAMEWORK”**
If timeframes misalign, the market punishes you — every single time.
1️⃣ Trend / Impulse Check
Last impulse >2× previous → momentum, not trend.
Momentum alone = FAFO
Check last candles → volume continuation or fade
Context decides survival.
2️⃣ Zones Only Count With Confluence
Align with:
✔ Trend
✔ HTF
✔ Clean break/retest
✔ Rejection candle
✔ Multiple TFs clean
No confluence = decoration, ignore.
3️⃣ Candles = Evidence, Not Setups
Single candles ≠ signal
Must fit context + confluence
Wrong context → FAFO
4️⃣ Confluence = Survival
2 variables aligned + 1 neutral = potential
Any contradiction = dead setup
No guessing. No opinions.
5️⃣ Timeframe Conflicts → Wait
H1 bullish, M15 bearish → NO TRADE
Waiting = capital protection, not inactivity
Force a trade → FAFO
6️⃣ Context = Weapon
Strong trend + HTF resistance + fading volume = conflict → do not trade
Market shakes out amateurs here
Respect context or get cleaned
7️⃣ Golden Rule
Never trade against HTF unless MTF confirms reversal:
✔ Structure shift
✔ Volume shift
✔ Rejection candle
✔ Alignment
Trade anyway → RR small, execution precise
8️⃣ 10-SECOND CLASSIFICATION CHECK
HTF → bullish / bearish / conflict
MTF → aligned / challenging / opposite
LTF → entry / noise
Zone → fresh / retested / dead
Candle → supportive / neutral / invalidation
Confluence → 2 aligned + 1 neutral = tradeable
Contradiction → NO TRADE
9️⃣ FAFO Examples
Bearish M15 at HTF demand = FAFO
Momentum into dead zone = FAFO
Giant candle in consolidation = FAFO
10️⃣ Rule Stack
HTF owns the market
MTF decides opportunity
LTF executes only
Two variables aligned = potential
One contradiction = dead setup
Momentum ≠ trend
Zones need confluence or they don’t exist


MGC / GOLD 15/4h/D🧠 Multi-Timeframe Alignment – XAUUSD
Daily + 4H demand are in control ✅
15M structure is bullish ✅
Although price is currently high in the range, this 15M demand is valid because it just displaced and removed the opposing light red zone.
With lower timeframe confirmation and HTF alignment, I’m projecting price to continue higher and remove the 4H opposing zone.

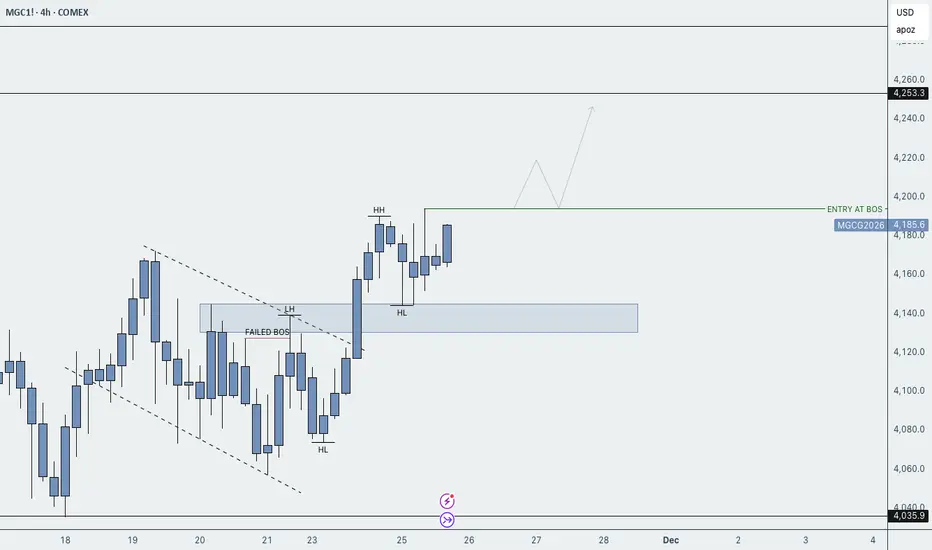
Possible MGC BuyPrice broken structure and formed a HH:HL retesting the level. Momentum continued then stalled into consolidation, so I'm waiting for a break of the inside before I look to buy again.
GOLD directional trade with this week Analysis + ORB Pro entryGold is heading up to the previous OB. We are using our Rapid ORB indicator to entry. This a live update.

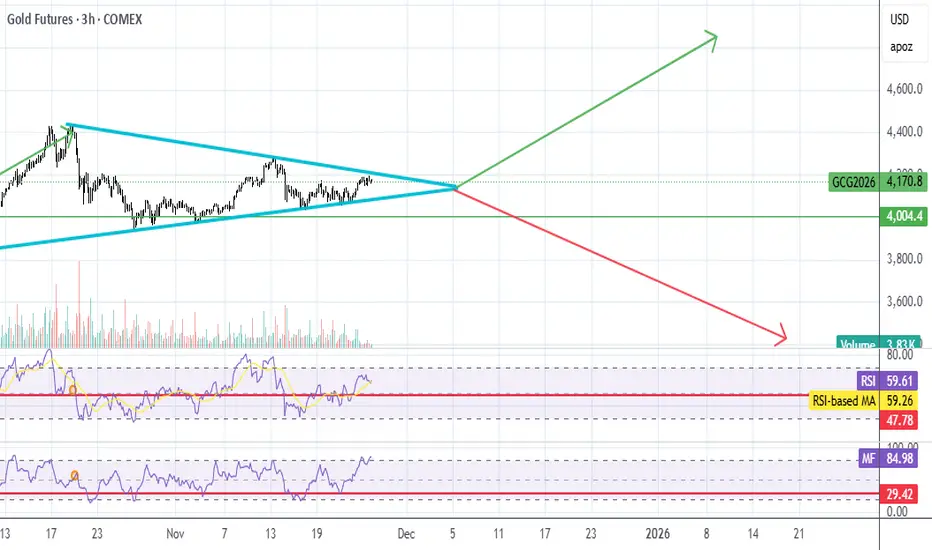
GC UpdateI probably should have gone long when it hit the bottom of the pennant. Waiting for it to come back down.
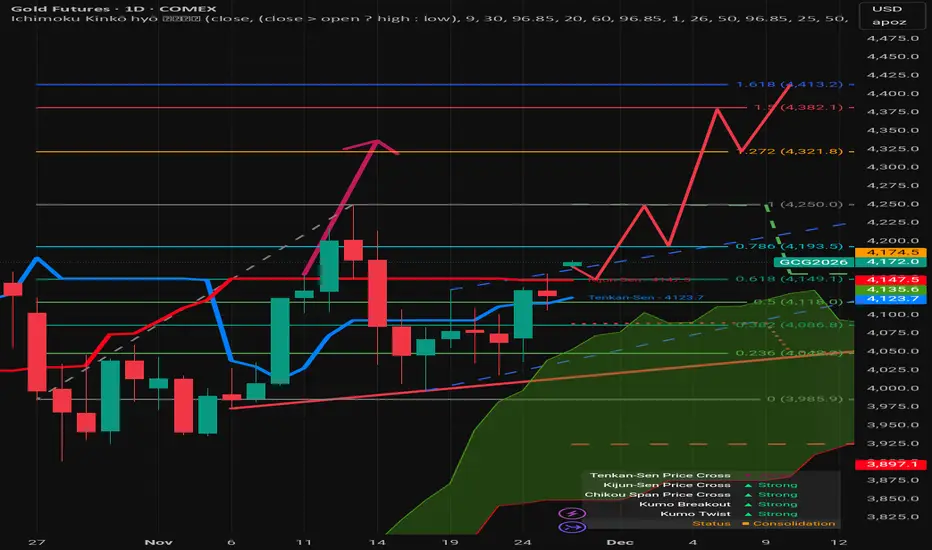
Recovery phaseFollowing a "Double Bottom," currently testing key resistance levels within a broader bullish context (indicated by the large green Ichimoku cloud).
The price has successfully reclaimed the 0.618 level (4,149.1). Holding above this level is crucial for the bullish thesis to continue.
The price is approaching the 0.786 level (4,193.5). A breakout here usually opens the door for a retest of the previous high.
If the price breaks the previous high (Level 1 at 4,250), the chart projects targets at the 1.272 extension (4,321.8) and the 1.618 extension (4,413.2).
The price is trading well above the Green Kumo (Cloud), which acts as a major dynamic support zone. This generally indicates a long-term bullish trend.
The Tenkan-Sen (Blue, 4,123.7) is currently below the Kijun-Sen (Red, 4,147.5), which is technically a weak signal. However, the current price (4,167) has moved above both lines, which is an early signal of renewed momentum. The status box at the bottom right notes "Status: Consolidation," likely waiting for the Tenkan to cross above the Kijun for a confirmed "Strong" buy signal.
A clear "Double Bottom" pattern formed around the 3,985 level (the 0 Fib line). This is a classic reversal pattern that provided the floor for the current rally.
There is an annotation for a "Bear Asc. Head and Shoulders." However, the price action has pushed up through the right shoulder, largely invalidating this bearish setup.
Current Move: A breakout from the consolidation zone between 4,080 and 4,150.
Short-Term Pullback: The projection anticipates a small dip or retest (likely bouncing off the 4,250 resistance initially).
Breakout: The projection implies a final surge breaking the 4,250 high, aiming for the Fibonacci extensions at 4,321 and 4,413.
Pivot/Support 4,149 (0.618 Fib) Must hold to maintain immediate bullish momentum.
Major Support 4,118 - 4,123 Confluence of 0.5 Fib and Tenkan-Sen. Loss of this level turns the trend neutral/bearish.
Key Resistance 4,193.5 The 0.786 Fib level; the next hurdle to clear.
Breakout Target 4,250 Previous High. Clearing this confirms the resumption of the macro uptrend.
Insight
The chart suggests a Bullish Bias. The "Double Bottom" provided a strong floor, and the price reclaiming the 0.618 Fibonacci level is a sign of strength. The primary risk is the "Consolidation", watch for the Tenkan-Sen (Blue line) to cross above the Kijun-Sen (Red line) to confirm the next leg up.
Upper zoneMight break out or break in to the zone on GC
Volume traded looks very thin on the upper level
We also filled in the gap from the sell off earlier this month.

Pre Open heads up on Gold. And overall draw. Bullish it isCOMEX:GC1!
Looking for higher prices on Gold. It should deliver towards the buyside and successive highs from here on. Need a CISD on the 4H timeframe

XAU/USD Plot Twist?XAU/USD: From 4106.7 to 4200 – The Comeback Tour (Featuring a Quick Dip at 4060.3)
Trade Idea Explanation:
Current Situation:
Price has successfully broken above the previous resistance at 4106.7, confirming bullish momentum.
Expected Move:
A pullback toward 4060.3 is anticipated before resuming the upward trend. This level aligns with potential support from the breakout structure.
Bullish Target:
After the pullback, the next upside target is 4200, which represents the projected extension of the bullish move.
Alternative Scenario:
If price breaks the current resistance at 4152.0, it could extend higher toward 4195 (first short entry) and 4220 (second short entry), where sellers may step in and initiate a reversal.
Enjoyed this? Show some love with a LIKE and share your thoughts in the COMMENTS! 💬
Disclaimer
My trading strategy isn’t a signal — it’s more like therapy for my brain. I’m just here crying over candlesticks while pretending it’s ‘learning market structure.’ Sharpening my skills? Sure. Building my trade journal? Absolutely. But deep down, it’s just me whispering to the charts: ‘Please love me back

Gold Dropped and gave me an Entry.Entry taken and just waiting to be cooked or cook. What's your take on this?

Upcoming GOLD is most likely going upThe upcoming outlook for gold is bullish.
The external structure remains bullish, and the internal structure has now shifted bullish as well after breaking the internal lower high. Price completed a clean retracement into the 78% Fibonacci level and has since begun pushing upward.
Gold is currently bouncing from the FVG and is heading toward the upside Unicorn Zone. Before revisiting the all-time high, price is expected to pull back into the major support area and then continue higher toward the double-top all-time-high region.


Reaching upper levelGold reaching upper level from a volume perspective
Will it break out or continue to consolidate?

MGC LongsPrice is forming a rounded double-bottom structure right on the rising trendline (blue), suggesting buyers are quietly stepping back in after multiple rejections from the lower demand zone (4,050–4,060).
We’re currently pushing into a key mid-range resistance at 4,085–4,095. This level has acted as a heavy decision zone for several sessions, so I’m watching for one of two things:
Primary Bias (Bullish)
A controlled pullback into the 4,060–4,065 demand zone
Buyers hold structure above the trendline and EMAs
Break and hold above 4,090
Then continuation toward 4,110 → 4,130 liquidity pockets
The white projection illustrates the ideal retest-and-continue scenario.
Key Notes
EMAs are beginning to curl up and tighten — early sign of momentum shift
Liquidity sits above 4,105–4,115 from prior wicks
Clean invalidation below the trendline / demand at 4,050
Overall, this is a reversal-structure forming at higher-timeframe support, with a potential push into the next major supply zone if intraday demand continues to hold.

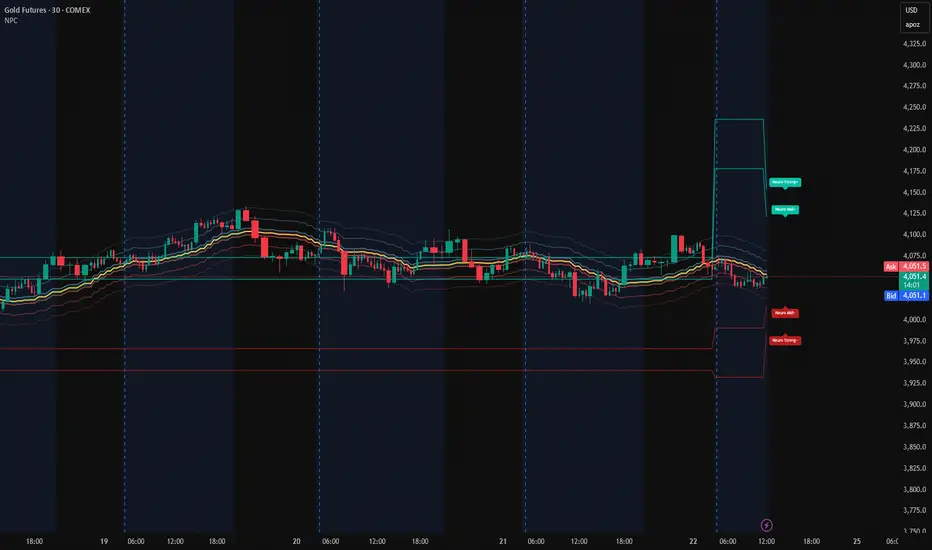
Gold (30m) – NPC Volatility Zones After Range CompressionGold Futures (COMEX), 30m using NeuroPolynomial Channel (NPC)
After the recent range compression, Gold is sitting inside a nonlinear stabilization pocket rather than a momentum phase.
Current Statistical Position:
• Price hovering near NPC Core Cluster
• Distance from lower stress band: ~1.2%
• Distance from upper expansion band: ~2.0%
• Compression vs prior leg: ~0.58
NPC Volatility Map:
• Upper Expansion Zone: +1.8% → +2.3%
• Core Equilibrium: Current range
• Lower Rejection Band: −1.2%
• Breakdown Re-Entry Zone: −2.6%
Scenarios (not predictions):
Holding above core → rotation towards upper band
Losing core → retest lower volatility zone
This is a structure + probability map, not a trade signal.
GOLD BEARSThe price is testing the upper boundary of the trend channel; I'm anticipating a reversal to the downside and will look for a short position, unless there is a strong bullish breakout followed by a retest of the channel as new support.

XAU/USD Prophecy: Will 4200 Shine Bright?Greetings, Traders! Market Prophecy: XAU/USD in Action
Gold isn’t just sparkling—it’s plotting moves like a secret agent with Fibonacci codes! Here’s what the charts are whispering:
🔍 The Setup
XAU/USD has strutted its way to the 50% Fibonacci level, but if history is any guide, gold loves to go the extra mile—often stretching beyond 61.8% like it’s chasing a bonus level in a video game. Translation? There’s still some golden runway left for the bulls.
📈 The Technical Drama
On the 1-hour timeframe, we’ve got a trendline breakout—cue the fireworks!
The 30-minute chart? Resistance smashed like a piñata at a birthday party.
Now, all eyes are on the 4107 level. If price breaks this resistance, expect a pullback that could be your golden ticket for a long entry.
🎯 The Target
If the bullish momentum keeps flexing, we’re eyeing 4200 as the grand finale. Think of it as gold’s victory lap.
💡 Trading Idea
Break → Pullback → Long → Profit. Simple, but with style. Just remember: markets can be as moody as a cat, so manage your risk like a pro.
If you found this helpful, hit LIKE & COMMENT ❤️

XAU/USD Weekly Drama: Resistance vs. Persistence!Welcome back to Market Prophecy...
Gold (XAU/USD) recently broke below its support level and the lower trendline, signaling bearish pressure. However, the price failed to breach the critical $4,000 mark, indicating strong buying interest at lower levels.
For the upcoming week, the bias shifts toward a bullish outlook, with the first key resistance located at $4,106.43. A confirmed breakout above this resistance and the trendline will serve as a strong entry signal for long positions.
Trading Plan:
Breakout Confirmation: Wait for price to close above $4,106.43 and the trendline.
Pullback Opportunity: If the breakout occurs, monitor for a retracement back to the support zone for an optimal entry.
Upside Target: The next major resistance is projected near $4,200, which will act as the primary profit target.
Key Levels to Watch:
Support: Previous breakout zone
Resistance: $4,106.43 (initial), $4,200 (target)
good luck all
**My trading strategy is not intended to be a signal. It's a process of learning about market structure and sharpening my trading my skills also for my trade journal**
Thanks a lot for your support

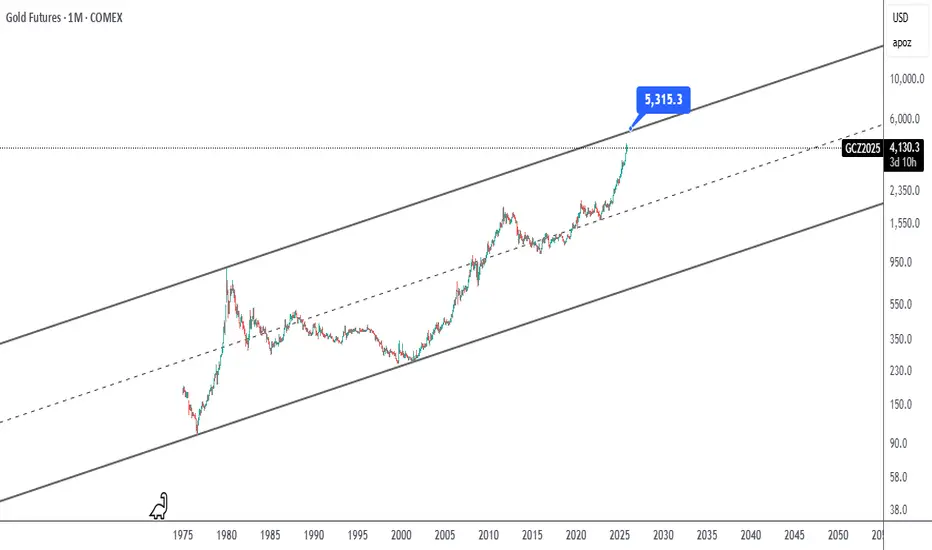
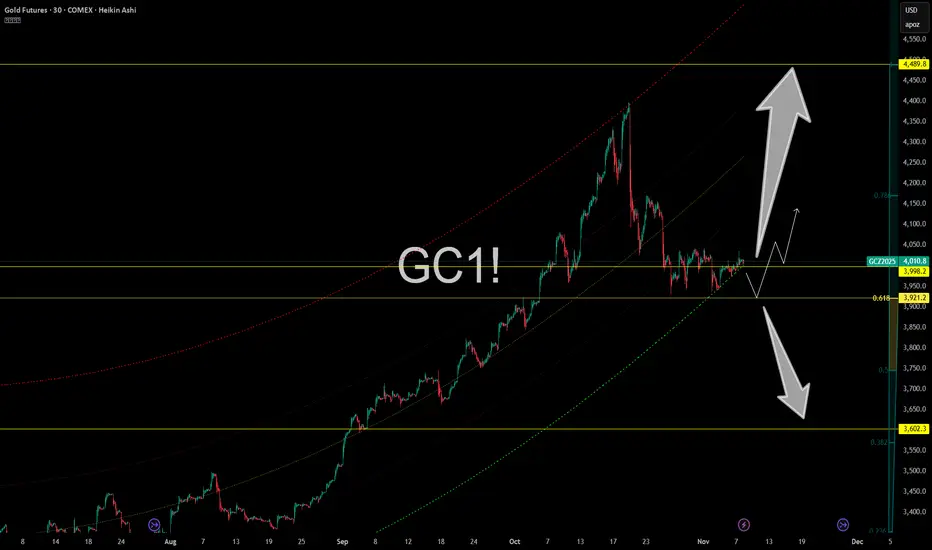
Gold Futures – Compression Before Explosion?Gold (GC1!) is coiling tightly just above the $3,998 level, teasing a big move as it hugs the 0.618 fib zone at $3,921. It’s the definition of compression — and when gold coils like this, something always gives.
📍 Key levels on the radar:
$3,998 – Current pressure zone
$3,921 – Fib support + breakout base
$3,602 – Worst-case flush if demand fails
$4,489 – Fibonacci extension target if this rips
We’ve got an ascending pitchfork, clean market structure, and a massive range breakout setup. These kinds of patterns don’t sit idle for long.
Gold remains a beast in uncertain macro conditions — don’t underestimate what happens when fear, rates, and inflation mix.
Trading Wisdom 📜
The bigger the coil, the nastier the move. Don’t focus on direction — focus on readiness. Gold pays those who stay patient and deadly.
Disclaimer: What you read here is not financial advice — it’s high-level market philosophy from the FXPROFESSOR himself. Risk is real, and your capital is your responsibility. Learn, adapt, evolve.
One Love,
The FXPROFESSOR 💙
Gold Bearish OutlookExpecting CSE:GC TVC:XAU to be bearish for the rest of the month
- Seasonals lean bearish till EOM
- Commercials are highly short while Small traders are highly long
- OI relatively high
- CLEAR Market structure break
- CLEAR IRL to ERL target
