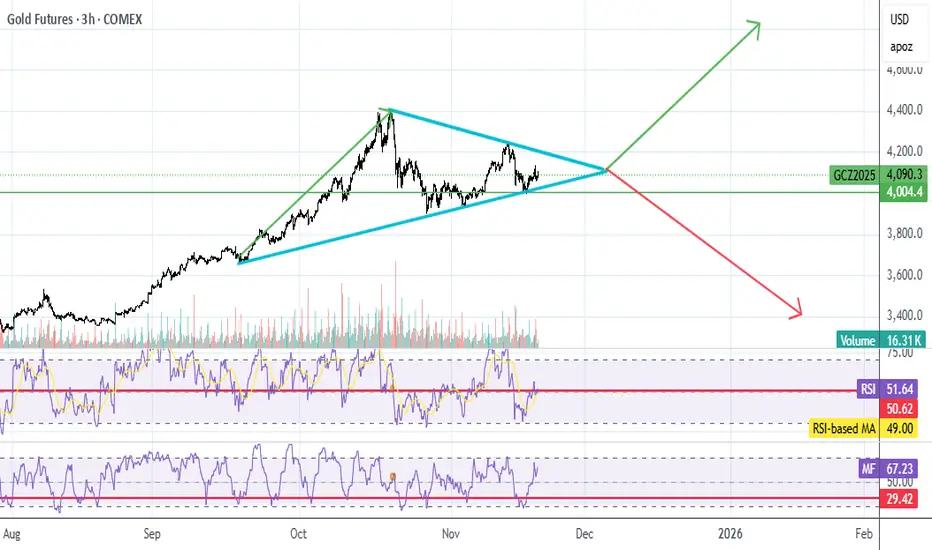
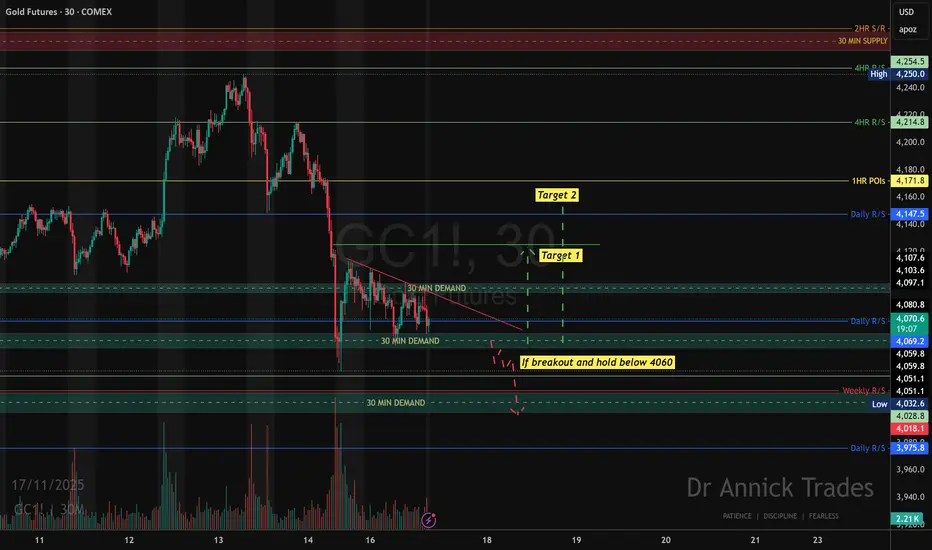
Gold Bearish OutlookExpecting CSE:GC TVC:XAU to be bearish for the rest of the month
- Seasonals lean bearish till EOM
- Commercials are highly short while Small traders are highly long
- OI relatively high
- CLEAR Market structure break
- CLEAR IRL to ERL target
Gold (Mini) Futures
No trades
Market insights

Thursday1. How do I read the open and close price of each candle after it prints?
2. Can I get out of a trade before it stops out? Like right before it stops out.
3. Was there any way to have made this trade a winner?

Gold Mega MCX Futures — Inverse Head & Shoulders - Pattern TradeMCX:GOLD1!
By Chart Pathik | 20 November 2025
Gold Mega MCX Futures — Inverse Head & Shoulders Breakout Suggests Positional Bullish Reversal
Market Overview
Gold Mega MCX Futures
have constructed a textbook Inverse Head & Shoulders pattern on the 15-minute chart, indicating a notable bullish reversal opportunity after an extended downtrend. This structural pattern reflects gradual absorption of supply, leading to a strong recovery scenario for positional traders.
After testing the lows near 121,800 (forming the head), gold has rebounded to repeatedly test resistance at the neckline around 124,455. The right shoulder completed with a swift reversal, and prices are now pressing against breakout territory. Sustained closes above the 124,455 neckline confirm classic breakout conditions for a multi-session rally.
Technical Structure and Pattern Logic
The Inverse Head & Shoulders structure, observed here, is a high-probability bullish reversal setup favored by institutional participants at the end of persistent downtrends.
The "head" forms at the extreme swing low (121,800), with each "shoulder" forming on higher lows, reflecting indifference turning into accumulation and finally conviction.
The pattern's neckline resistance is sharply defined at 124,455, which, when broken decisively, unlocks the full post-breakout measured move potential. Early aggressive entries are possible on high-volatility tests of the right shoulder at 123,255, setting up for add-on positions if a neckline breakout occurs.
Breakout Validation and Volume Confirmation
Key volume expansion on rallies above the neckline is crucial for confirming the breakout. A surge in open interest or strong momentum during/after a breakout candle provides additional confirmation and increases the probability of a sustained move.
Pattern Target Projection
Pattern Target: 128,100
This target is projected by measuring the distance from the neckline (124,455) to the head (121,800), then adding it above the neckline breakout.
Key Levels to Watch
Early Entry: 123,255 (for aggressive traders on pullbacks toward the right shoulder)
Break-Out Entry: 124,455 (confirmation on a convincing breakout and close)
Stoploss (Positional): 121,800 (well below head formation, protecting capital and structure)
Pattern Target: 128,100 (full measured move from bottom to neckline)
Scenario Analysis
If gold closes above 124,455:
Momentum is likely to accelerate toward 128,100, with the trend reinforced by any volume spike and reduced selling pressure at higher prices.
If gold fails at the neckline and closes back below 123,255:
A failed breakout or pattern trap could lead to a retest of 121,800 or even a deeper corrective phase if macro sentiment or global cues turn adverse.
Broader Market Context
This reversal setup comes as broader market volatility in precious metals fades and macro conditions appear stabilizing. Physical demand, safe-haven flows, and a potential resurgence in global risk aversion could further support the bullish thesis.
Historical Significance
The Inverse Head & Shoulders pattern is respected by traders for timing momentum shifts at major turning points. A similar structure triggered a sharp rally in gold Mega MCX Futures during Q4 2020, and the post-breakout rally then lasted for several weeks.
Market Psychology and Trader Positioning
This pattern shows a market transitioning from capitulation and fear (the head), through reluctant bullishness (shoulders), to widespread conviction (neckline breakout).
Large players will often accumulate around the shoulder and neckline and then aggressively push prices through resistance once weak hands exit.
Outlook
In the coming sessions, a sustained breakout above 124,455, validated by strong candle closes and higher volume, should favor multi-session long positions targeting 128,100. Pullbacks into the 123,255–124,455 area are accumulation zones for swing or positional traders.
Chart Pathik View
This pattern marks a structural turning point after a corrective phase. Patience on retests, strict risk management with stoploss at 121,800, and riding the full pattern target are the ideal tactics.
As gold transitions from a downtrend into a potential expansion phase, structure, discipline, and measured scaling are essential to positional success.
Last time this Inverse Head & Shoulders pattern on MCX Gold Futures produced a similar outcome was in June 2020, leading to a 10% rally in the following weeks.


GC UpdateLooks to me like gold is forming a big pennant, more than likely a continuation pennant.
Certainly not acting like it;s topped out.
Gold Takes out Swing High??If we can break the previous resistance, Thad be in indication buyers are in control. A simple pullback off a 15m would be an ideal entry

Gold Looks 50/50, Will it show a bearish momentum?Gold! Gold! Gold! I called you thrice, please drop.


GoldBoth symbols look bullish to me, even though the overall price has been moving down — they’re targeting mitigated areas that usually don’t hold for long.

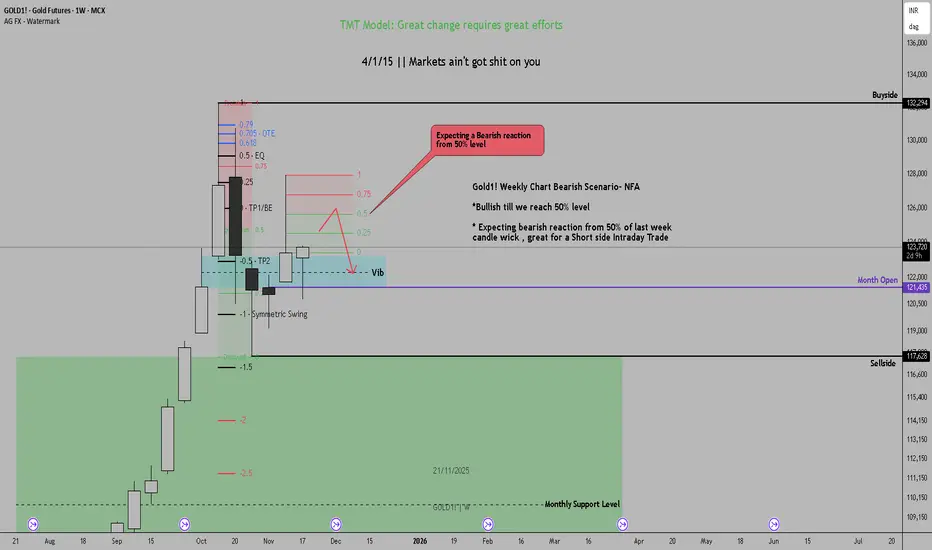
Gold1! Weekly Chart Bearish Scenario- NFAGold1! Weekly Chart Bearish Scenario- NFA
*Bullish till we reach 50% level
* Expecting bearish reaction from 50% of last week candle wick , great for a Short side Intraday Trade
Gold Holds $4000Gold has retraced lower from last week’s high, though it is holding above 4000 for now. Two bullish pinbars have also formed on the daily chart, hinting at a potential swing low. A break above yesterday’s high could see bulls target the 4200 handle, with a move through the 4250 high bringing the 4300 handle and monthly S1 into view.
However, keep in mind the weekly chart may be forming a Wave B within a broader ABC correction. I’ll also be watching for signs of a swing high on the daily chart and a potential resumption of the move lower from the record high. A 100% projection of Wave A from B implies a downside target near 3800.
Matt Simpson, Market Analyst at City Index.

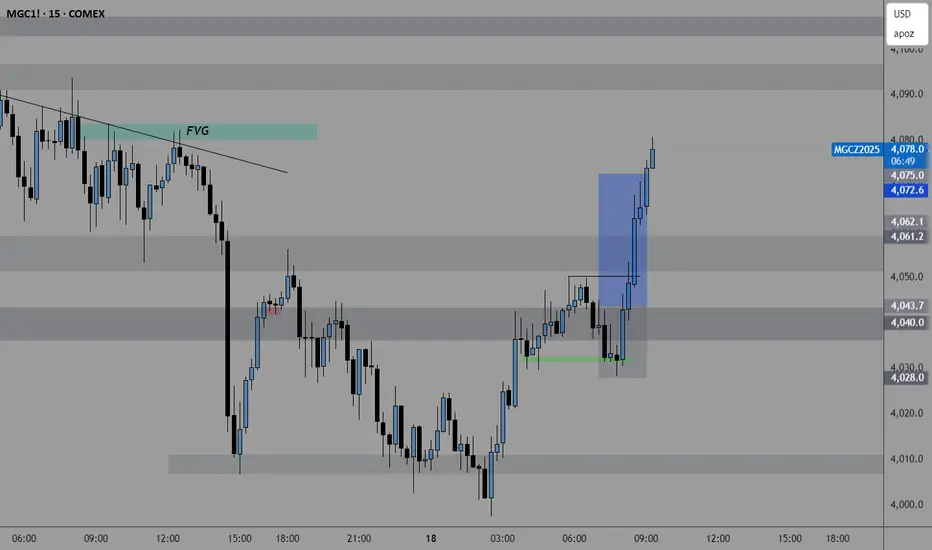
The Calm Before the Expansion — Gold Pre-Setup MapGold rejecting the Asian Range low and showing early signs of reversal. Missed the London setup after oversleeping, but tonight I’m watching for a retrace back into the H1 FVG + lower HVN. That pocket sits just under 50% of yesterday’s Asian range and lines up with weekly volume sitting just outside of value. If price pulls back into that zone and shows displacement, I’m looking for continuation to the upside and potential expansion toward the H4 FVG above. Premature breakouts tonight may be traps.


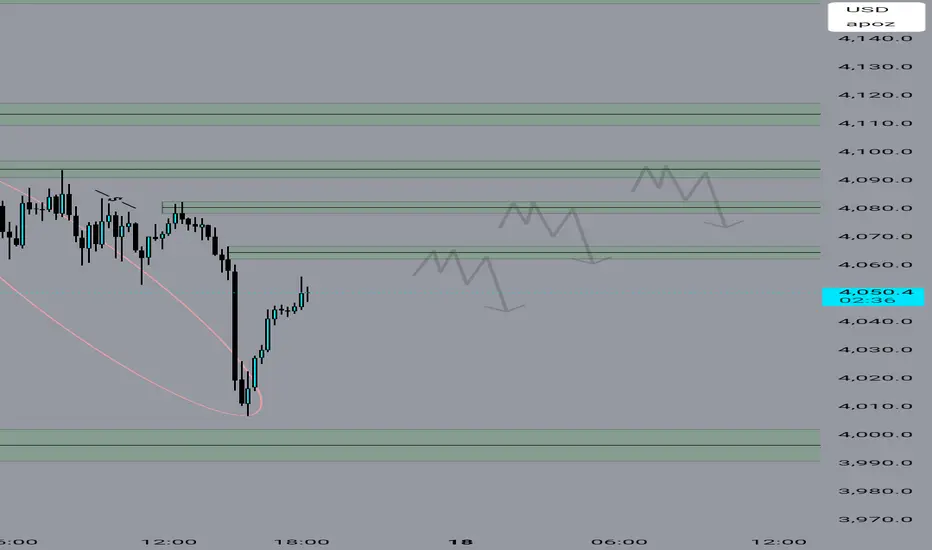
Looking for the Sweep leading into a bigger Play! Price bled lower through the entire Asian session after yesterday’s late breakdown, continuing the move away from the prior value area. We’re now trading inside a cluster of intraday inefficiencies with clean liquidity sitting below at 4013 and the psychological 4000 level.
My focus going into London and NY is patience.
Asia’s slow descent is typically a continuation phase, not the actual entry. I want to see:
A sweep of 4013 or 4000
A clear displacement reaction
A retrace back into a fresh M5–M15 FVG
Then structure confirming continuation or reversal
Until that happens, this remains a bearish environment with untested Weekly imbalance still below. If buyers don’t defend 4013 with force, the algo will likely reach for the 4000 liquidity pocket next.
Staying reactive, not predictive.
London will reveal whether this breakdown continues or sets the trap for a reversal.

GOLD is retracing only to drop againTarget is 4000. We need to wait for confirmation when it gets to the marked zone.
Gold hold this trendline and we see a move upwards.If gold can hold this trendline at $4000 we could see a move up, wait for the daily open.

Gold BullishWe are definitely bullish, with the market after hours slowly building back profit. I believe that gold will follow, it slowly building back momentum will be a green light for the Asia session today 11/17 as well as future days.
The reason that I am very adamant about this is because the market has been very low lately but with NVDA earnings coming out I believe that the market will go up this week including Gold, Nasdaq and S&P 500.

Where To Next?I am currently focused on the consolidation zone (see the green rectangle) that formed a few days ago. Following a breakout to the upside, price promptly retested and closed yesterday just above the top boundary of that consolidation. However, today’s action saw a failure to sustain outside the zone and a return back into the prior consolidation range. While I hope this view proves incorrect, my expectation is for further weakness in gold over the coming days.
Technical considerations driving this outlook:
• The breakout lacked follow-through and the retest did not hold beyond the breakout level.
• Re-entry into the consolidation zone signals a potential loss of upward momentum and increased risk of a reversal or deeper pull-back.
• As traders, given the current structure we should err on the side of caution—if the market cannot sustain above the breakout level, then the likelihood of downside increases.
Let’s keep the risk-reward clearly defined—if gold (XAU/USD) fails to reclaim the breakout zone convincingly, I will lean toward short or neutral positioning rather than placing bullish bets under current structure.
⸻
Supporting quote from the latest news:
“MCX Gold futures are currently navigating a critical juncture… marked by a retreat from significant trendline resistance and the establishment of a sideways market structure. … The immediate outlook suggests short-term bearish pressure.”
I’m sitting out until I can see clear structure and direction.

Gold "World"
(this is my plan): If end-of-year 2025 gold around 3800-4000, it might be low 3500 in first quarter of 2026.. then i buy asap physical gold and trade online. You know why ?? here is my buy physical gold/trade online journey (short long my story):
- year 2006: first time gold reached $600, i bought asap.. and i know gold never come back.
- year 2015: beginning of year gold went down from ~$1900, it was ~$1000, i bought physical gold asap until gold reached almost $4000 for now.
- present: waiting for going down $3500-$3000 in future, will buy 3rd time in my life.
Life is a game.. i just wanna secure my life in next 10 yrs :))
Disclaimer: Whatever i said is my planned.. might not your plans.

Elliott Wave - Final leg down.Not completely certain that W4 is complete. Could be given how the last high is formed.
Not exactly where W5 will end, anywhere from 0.5 - 1.272 ext. is my guess if W4 is complete.

GC! Level watchGold's resistance remains above current levels $4,150+ with a slightly bearish short‐term tone, so given the slightly weakened momentum and the presence of headwinds (stronger USD, hawkish Fed commentary), the most likely scenario for today is range-bound to mildly downward action, unless a strong catalyst emerges. So, if price holds above the ~$4,000–$4,050 support band, a rebound attempt toward ~$4,120–$4,150 is plausible. Conversely, if support breaks, we could see a move toward ~$3,900 or even ~$3,800 in an aggressive sell-off.
The Leap Update - November CompetitionHere is some analysis on the pairs I am in in this Leap round. Quite a bit away from the top 10 place, but anything is possible. Remember, luck plays a part, but it flattens itself out more over a period of time. There is a month to trade, so just stay in your own lane and you will do better than worrying too much about how someone else is doing. Nobody has consistently even made it in the top 10 consecutively.
Hope you enjoyed the analysis.
R2F Trading
