Gold Bulls Are Making Hard Work of New HighsI remain sceptical of gold’s latest bounce and continue to look for signs of a swing high. A less-dovish — or relatively hawkish — Fed cut this week could be the catalyst for a stronger US dollar and lower gold. Either way, it’s hard to imagine gold breaking back above its record high without a meaningful dip first.
Matt Simpson, Market Analyst at City Index.
Gold (Mini) Futures
No trades
Market insights

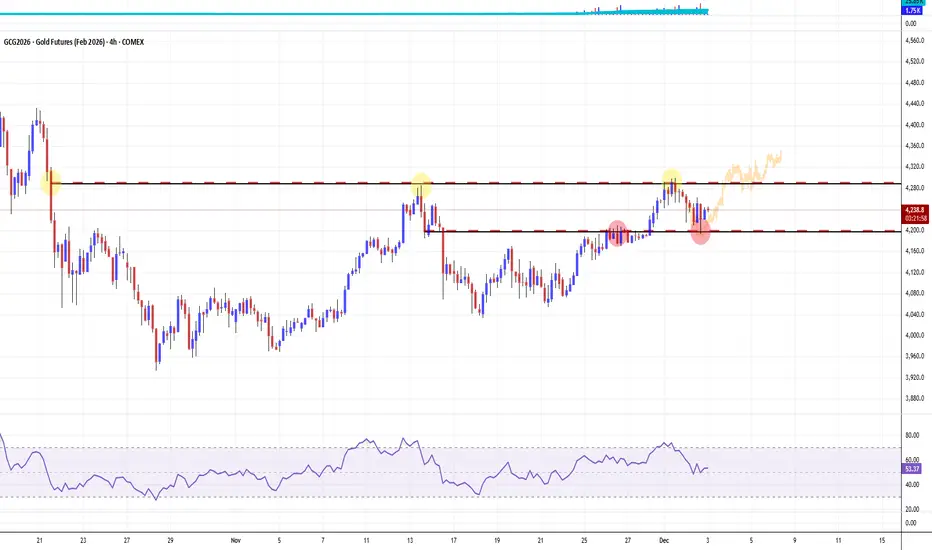
Triple Top - Double Bottom. Go Next Golden Shift4200 for a potential reload (supply area). 4300 - to take it more bag.
How to Use ATR in TradingViewMaster ATR using TradingView's powerful charting tools in this step-by-step tutorial from Optimus Futures.
ATR, or Average True Range, is a volatility indicator that helps traders measure market movement, set appropriate stop losses, and adjust position sizing based on current market conditions.
What You'll Learn:
Understanding ATR as a volatility measurement tool that tracks price movement regardless of direction
How ATR calculates the average range between highs and lows over a specified period — typically 14
Why rising ATR signals increasing volatility and larger price swings
Why falling ATR indicates decreasing volatility and quieter market conditions
Using ATR to set dynamic stop losses that adjust to current volatility rather than arbitrary dollar amounts
How to calculate stop distances by multiplying ATR by factors like 2x or 3x
Applying ATR for position sizing to maintain consistent risk across different volatility environments
Setting profit targets based on ATR multiples to align with actual market movement
Filtering trade setups using ATR levels to avoid low-volatility periods or confirm breakout momentum
How to add ATR on TradingView via the Indicators menu
Understanding the default 14-period setting and how shorter or longer periods affect responsiveness
Practical examples using the E-mini S&P 500 futures chart
Applying ATR across daily, weekly, and intraday timeframes for risk management and trade planning
This tutorial is designed for futures traders, swing traders, and risk-focused analysts who want to integrate volatility-based risk management into their trading approach.
The methods discussed may help you set smarter stops, size positions appropriately, and adapt your trading strategy to changing market conditions across multiple markets and timeframes.
Learn more about futures trading with TradingView: optimusfutures.com
Disclaimer
There is a substantial risk of loss in futures trading. Past performance is not indicative of future results. Please trade only with risk capital.
We are not responsible for any third-party links, comments, or content shared on TradingView. Any opinions, links, or messages posted by users on TradingView do not represent our views or recommendations.
Please exercise your own judgment and due diligence when engaging with any external content or user commentary.
This video represents the opinion of Optimus Futures and is intended for educational purposes only. Chart interpretations are presented solely to illustrate objective technical concepts and should not be viewed as predictive of future market behavior.
In our opinion, charts are analytical tools, not forecasting instruments.

GC (gold) updateMFI is touching oversold....
Might take a shot at some GLD calls tomorrow, not sure because Fed meeting on Wed.
Looking to buy GCGC fell on Friday leaving inefficiency above. 4H closed bullish with expansion candle. Looking to buy from 15M engulfed candle (order block). Going for bit more than 2R. 4H candle high is the first target

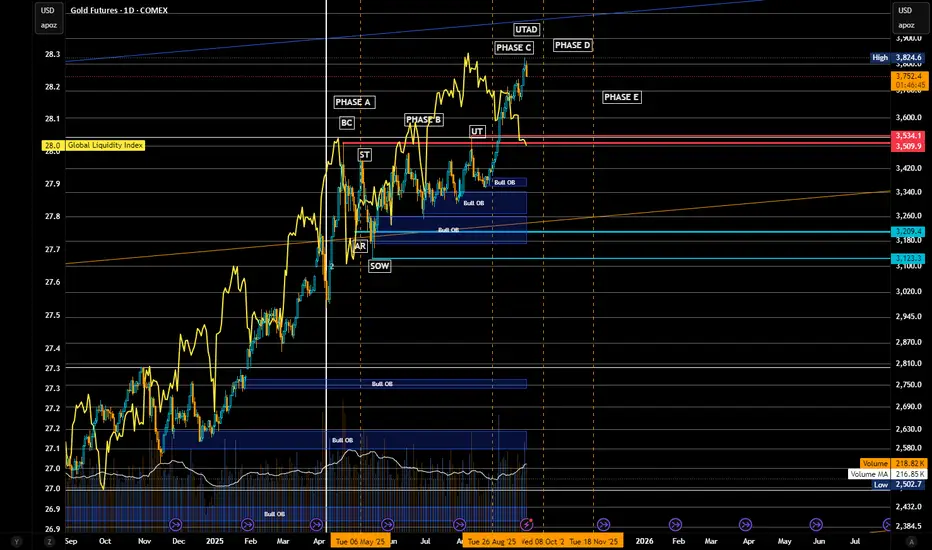
Gold Futures (GC) – “Top Is In” Schematic ReviewExecutive Snapshot 🧭
Primary stance: Bearish swing/top-in thesis (Wyckoff Distribution complete via UTAD).
Bias strength: High, while price remains below 3,825–3,860 and fails to accept above.
Game plan: Fade strength into supply; look for Phase D → E breakdown confirmation → target 3,534/3,509 → 3,209 → 3,123 then extended 2,970–2,795 if momentum accelerates.
Multi-Framework Confluence:
A) Wyckoff (your schematic) ♟️
Phases:
A/B: BC/ST established range highs; AR/SOW tagged mid/low of range.
C: UT → UTAD (new high on diminishing relative spread & mixed volume).
D (now): Throwback rallies holding beneath UTAD; look for LPSY near 3,760–3,825; failure → Phase E markdown.
Validation: Lower highs after the UTAD and repeated rejections of the supply shelf 3,760–3,825.
Confirmation trigger: Break and accept below ICE/Creek = 3,534–3,509 (your pink band) → distribution confirmed.
Macro Frame 🌐
Gold’s cyclical up-leg is extended; near-term macro supports a pause/reversion:
Real yields/beta & USD shocks can catalyze a value-seeking dip.
COMEX time-and-price run suggests heat above without equivalent build in value → mean-revert first, trend later.
Invalidation & Risk:
Hard invalidation (swing): Weekly close > 3,860 and acceptance above for 2–3 sessions (no swift rejection).
Soft invalidation (tactical): Daily close back inside 3,760–3,825 after a breakdown → step aside, wait for next LPSY.
Position/Risk Template:
Initial risk: above 3,825 (or 3,860 for wider swing).
Size: start ½–⅔ unit at first tag/reject; complete size on breakdown retest of 3,534–3,509.
Trailing: swing stop > last LPSY high once 3,534 is lost.
Momentum & Internals (Quick Read) ⚙️
RSI/ultimate RSI (your panels): persistent bearish divergence into UTAD zone.
MACD: high, curling; ripe for signal cross on daily if price slips under 3,600s → 3,534.
Squeeze/Momentum: elevated; release down would align with the distribution thesis.
Execution Checklist ✅
Pre-break:
Fade 3,760–3,825 on rejection candles/footprint absorption.
Track delta & volume—no expansion = stronger distribution read.
Break event:
Daily close < 3,534 → reduce discretion, execute plan; seek retest → LPSY to add.
Manage:
Cover +30–50 handles into 3,209–3,180; roll runner.
Data to watch: USD DXY spikes, GLD OI/put skew, dealer GEX flips around GLD 300.
One-Page Risk Map 🗺️
Bearish while: < 3,825–3,860.
Confirmation: < 3,534–3,509 (close/accept).
Targets: 3,209 → 3,123 → 2,970 → 2,795 → 2,541.
Stop/Invalid: > 3,860 w/ acceptance.
Marked UTAD and supply stack 3,760–3,825 present a clean risk-defined top. Until the market accepts above 3,860, the probabilistic path favors Phase E markdown back toward 3,2xx value and possibly the 2,9xx–2,795 extension if momentum breaks loose.
Gold update 🚨 Gold Traders: Don’t Get Trapped in the Holiday “Thin Tape”! 🚨
We’re heading into the final full week of 2025, and the Order Flow is telling a fascinating story. While retail is dreaming of a "Santa Rally," the Heatmaps are showing where the real battle is being fought. 🔍
Here is the Breakdown for Next Week:
✅ The Resistance: Gold is hitting a wall at $4,385 - $4,395. We’re seeing heavy sell-side absorption here. Unless we get a high-volume breakout, expect a "fake-out" at these highs. 🛑
✅ The Value Zone: I’m watching the $4,297 - $4,310 area closely. This is where the institutional "Buy" orders are stacked. A dip into this zone could be the perfect entry for the next leg up to $4,400. 📈
✅ The Risk: It’s Christmas week! 🎄 Liquidity will be low. Remember: Low volume = High Volatility. Don't let a "Stop Run" knock you out of a good position. Keep your stops wide or your position sizes small.
My Plan: I’m a buyer on the dips near $4,300, targeting a year-end retest of the All-Time Highs. 🚀
What are you trading this week? Tech rotation or Gold safe-haven? Let me know in the comments! 👇
#Trading2025 #GoldFutures #OrderFlow #PriceAction #NinjaTrader #Bookmap #InvestSmart

Gold target 152k maxGold target 152k max after which don't buy at all or else I feel u will be n trap for very long time.

Gold Weekly Review: Balance at 4360 & The Holiday Breakout?FOREXCOM:XAUUSD FOREXCOM:XAUUSD
COMEX:GC1!
Analysis
1. Market Context (Value Established)
Reviewing the week's auction, Gold has spent significant time hovering between 4350 and 4370 .
• Weekly POC (4360): The market has established 4360 as the "Fairest Price" or Point of Control for the week. This indicates a market in Balance .
• The Test: We breached the 4380/90 resistance earlier, and late Friday's action brought us back to test 4380. This persistence at the upper extreme suggests buyers are probing for higher prices.
2. Next Week's Scenarios (ATH vs. Balance)
• Bull Case (Acceptance): If Gold can trade and build acceptance above 4380 next week, it confirms Initiative Buying leading the auction away from the 4360 value. The path to the All-Time High (ATH) opens up.
• Bear Case (Rejection): Failure to hold 4380 would likely rotate price back to the "gravitational center" at the 4360 POC.
3. Holiday Warning (Thin Market)
Next week is the Christmas trading week.
• Risk: Be extremely careful. Markets will be "thin" (low liquidity). Moves in thin markets can be exaggerated and emotional, often lacking the structural integrity of "New Money" participation.
Plan & Execution
• Focus: 4380 is the pivot. Above = ATH context. Below = Rotation to 4360.
• Advice: Reduce size or stand aside due to holiday volatility.
Talk to you next week.

GC | Wk 51T.A explained -
BackSide (BS)
FrontSide (FS)
Inverse BS (Inv.BS)
Inverse FS (Inv.FS)
BS & FS levels are expected support when dashed lines, tested when dotted and resistance when solid lines.
The inverse is true for the Inv. BS Inv. FS levels, they are resistance as dashed lines, tested as dotted and support as solid lines.
Monthly timeframe is color pink
weekly grey
daily is red
4hr is orange
1hr is yellow
15min is blue
5min is green if they are shown.
strength favors the higher timeframe.
2x dotted levels are origin levels where trends have or will originate. When trends break, price will target the origin of the trend. its math, when the trend breaks, the vertex breaks too so the higher timeframe level/trend that breaks, the more volatility there could be as strength in the orders flow in to fuel the move.

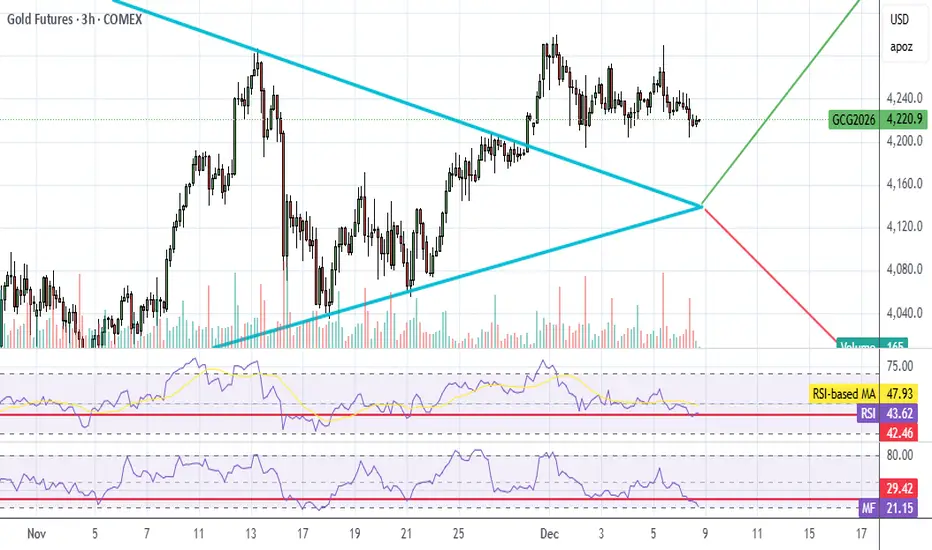
GC Short Trade IdeaGot levels of resistance here. If we get through the resistance we have a strong high above for a possible short there also.

Based on recent Elliott Wave analyses, the undertone for MCX GolBullish Outlook: The primary trend for gold on MCX is considered positive (bullish) from an Elliott Wave perspective.
Wave Structure: Gold has consolidated in a corrective wave 4 and is likely unfolding in wave 5 of a larger primary wave 5.
Support & Resistance: Key support is identified around ₹120,000, while a break above ₹124,600 is considered a positive reversal signal.

Gold Short Term Move (Less Than 12hr for TP/SL)Marking out .68 &.79 levels on 5min,15min,1hr charts. Once price respects zone we enter. Confirmations for respected zone are 5min fvg and ifvg respected, also closing and retesting of the zone.
Take Profit 1- Equilibrium of the move that goes down into the 15min GZ
Take Profit 2- Fibinocci extension .50
Take Profit 3- Any other Golden zone it can be going.
Take Profit 1** I take %99 of the time Take Profit 2** with strong momentum and volume i say i take %75 of the time and Take Profit 3** is a 50/50 split because it usually consolidates or retraces and could wick a stop loss.

Gold Context: Breakout from 4-Day Balance & Holiday ThinnessFOREXCOM:XAUUSD COMEX_MINI:MGCG2026 COMEX:GC1!
b]Analysis
1. Market Context (The Breakout)
We have observed Short Covering extending above the recent 4-day balance.
• Structure: Yesterday's push brought us nearly to the All-Time High (ATH). Today being Friday, the auction is positioned to test that extreme.
• The Driver: To sustain this breakout and reach the ATH, the initial short covering must transition into New Money buying (Initiative). Without this transition, the move risks being just an emotional inventory adjustment.
2. Scenario & Structure (The Tail)
• Bull Case: If short covering continues and attracts new buying interest, the ATH is the natural magnet.
• Bear Case (The Tail): Yesterday left a selling tail at the highs. If we see Liquidation (failure to hold gains), it confirms that the tail was a valid rejection by Higher Timeframe (OTF) Sellers defending the highs.
3. Holiday Caution (Thin Market)
We are approaching the Christmas and New Year holiday window.
• Risk: Trading volume is thinning out. Low volume markets can be erratic and lack structural integrity. Be careful of "false" moves driven by lack of liquidity rather than genuine value migration.
Plan & Execution
• Bias: Leaning toward the ATH test, but cautious of the "Tail" overhead.
• Invalidation: A drop back into the 4-day balance would negate the breakout and suggest the higher prices were rejected.
Talk to you for the next update.

Multi Top - Multi Bottom. Go Next Your Golden Shift4500 to take a bag (supply area). 4400 - to jingle that.
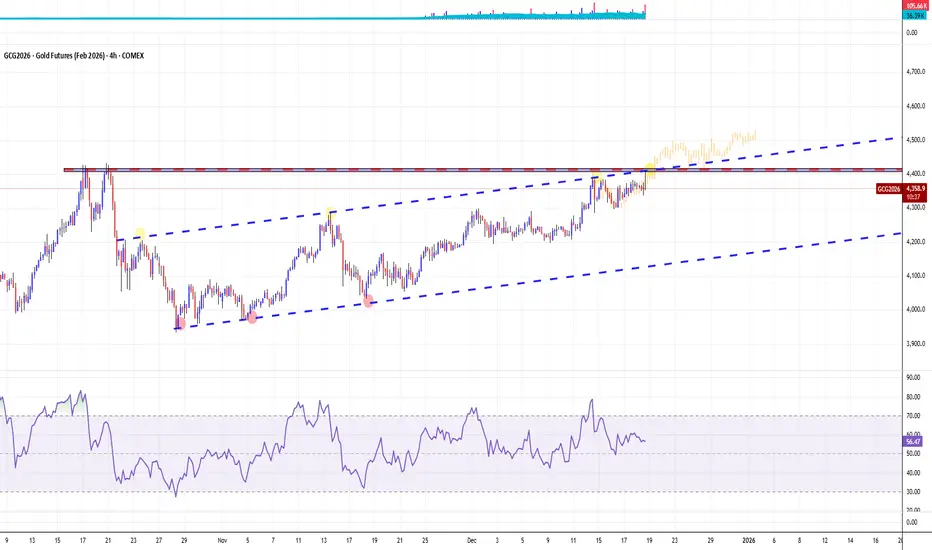
Gold strong bullish momentumHere we can see my channel projection lines and how the bullish momentum just keep on getting stronger and stronger. Now here is the question. Will the bulls pick up more momentum pushing the price even higher to the projected channel line?
Love to hear your opinion, leave a reply.
#Gold

Gold Context: The "Picket Fence" Highs & USD WeightCOMEX:GC1! COMEX_MINI:MGCG2026 FOREXCOM:XAUUSD
Analysis
1. Market Context (Lack of Acceptance) We are observing a classic "Picket Fence" at the highs. Gold has probed last Friday's high nearly every day, yet we see no acceptance (time + volume) above it.
The Structure: Repeatedly testing a level without breaking through often indicates that Short-Term Traders are dominating the auction. They are fading the extremes but lack the "New Money" power to expand the range.
The Risk: In Market Profile, "failure to facilitate trade" in one direction usually leads to a rotation in the opposite direction. If we cannot discover value higher, the auction will seek liquidity lower.
2. Fundamental Weight (USD Resilience) The upside is being capped by a resilient US Dollar (DXY).
The Driver: The divergence between a "Wait-and-See" Fed (Hawkish Cut) and a weak Europe is keeping a structural bid under the Dollar.
Correlation: As long as DXY holds its liquidation lows and yields remain firm, Gold lacks the macro fuel to break this mechanical resistance.
3. Scenario (Inventory Adjustment) The repeated failure at the highs increases the probability of Long Liquidation .
Target: A rotation back to the 4300 breakout level.
Rationale: This is not necessarily a trend change, but an inventory adjustment to flush out the "laggards" who bought the highs expecting an immediate breakout.
Plan & Execution
Bias: Cautious/Neutral.
Trigger: Watch for a "look above and fail" or a breakdown of the intraday lows to trigger the move to 4300.
Talk to you for the next update.

Gold Futures (GC) Technical Analysis at Key ResistanceGold futures are approaching a major higher-timeframe resistance between 4,414.4 and 4,399.4. This analysis focuses on price behaviour, volume reaction, and institutional participation rather than prediction. No trade is taken until price reaches the zone and confirms intent through volume and structure.

Approaching important fractal Hitting a very important fractal on gold, will we break though or mean revert?

GOLD 17.12.2025Today’s market was quite choppy, especially Gold. I let price develop during the first part of the session, and it became clear that institutions were seeking liquidity, which was found around the previous day’s POC. From that area, price reacted aggressively and pushed toward the upper zone, where it started trading into a non-fair value area formed two days ago.
This area had relatively strong volume, and during the second part of the session, price was met with aggressive sellers. On the CVD, we can see that during the pullback buyers remained active, forming an interesting accumulation within the downtrend.
With the confluence of the 0.618 Fibonacci level and the moving average, price reacted nicely, resulting in a clean and disciplined 3R trade.

FVG RejectionCaught this trade during the Tokyo session. An FVG was formed that took out a swing low. The FVG was retested and rejected. I entered at the fractal BOS and targeted Sell Side Liquidity (SSL). My SL was out above the FVG.

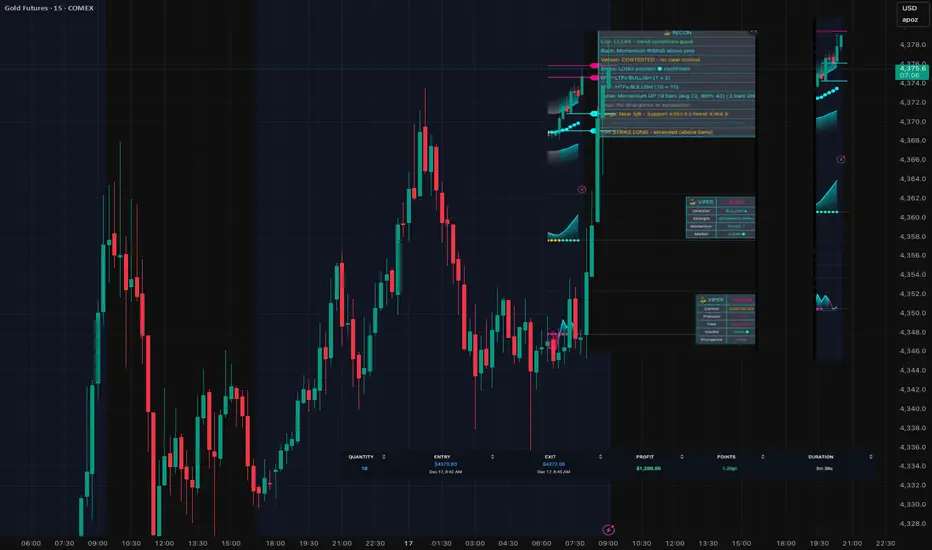
SignalViper Suite — Quick Scalp on Gold FuturesSignalViper Suite — Quick Scalp on Gold Futures (GC)
3-minute trade.
$1,200 profit.
Here's the setup:
RECON showed full alignment:
• Coil: CLEAR — no chop
• Strike: LONG confirmed
• Rush: Momentum RISING
• MTF: All timeframes bullish
• Fangs: Near key S/R levels
The missing piece? Venom was showing CONTESTED — buyers and sellers fighting for control.
I waited.
Next bar, Venom flipped to BUYERS.
That was my trigger. Entry: 4370.80 Exit: 4372.00 Duration: 3 minutes
Result: +1.20 pts on my Apex Trader Fund account. No guessing. No FOMO. Just waited for all 8 indicators to align, then executed. That's what confluence looks like.
Gold Context: Mechanical Balance & The Poor HighFOREXCOM:XAUUSD COMEX_MINI:MGCG2026 COMEX:GC1!
Analysis
1. Market Context (Mechanical Balance)
The auction has entered a phase of Mechanical Balance . By maintaining trade above 4300 for a week, the market is signaling acceptance of higher prices, but the momentum has paused.
* The Behavior: The test of yesterday’s Midpoint/POC and the "mild" activity confirms that Short-Term Timeframe traders are currently dominant. They are trading off visual references rather than creating new value.
2. Structure (The Poor High)
We have a structural anomaly at the 4380/90 area : a Poor High .
* Implication: A poor high lacks "excess" (a buying tail), which indicates the auction did not finish properly. Selling wasn't aggressive; buying simply dried up. This leaves "unfinished business" to the upside.
* The Nuance: While the destination is likely higher to repair this poor high, the market may lack the immediate energy to do so without an inventory adjustment first.
3. Short-Term Scenario (Liquidation)
The mild, mechanical trade increases the odds of Long Liquidation .
* The Flush: A rotation back toward the 4300 shelf would test the lower limits of this balance.
* The Opportunity: If we flush to 4300 and find responsive buying, it re-energizes the market to finally go up and repair the 4380/90 poor high.
Plan & Execution
* Bias: Neutral-to-Bullish (awaiting repair).
* Observation: Watch the 4300 test. Do we get a "look below and fail" (bullish) or acceptance lower? The poor high remains a magnet for the future.
Talk to you for the next update.
