TradeCityPro | COMPUSDT Ready for a Long Setup!👋 Welcome to TradeCityPro!
Let’s dive into the analysis of COMP, one of the active DeFi tokens that has recently been seeing a noticeable increase in its 24-hour trading volume — making it worth paying attention to.
🌐 Bitcoin Overview
Before we begin, let me remind you once again that at your request, we’ve moved the Bitcoin analysis section to a dedicated daily report — allowing us to analyze Bitcoin’s trend, dominance, and overall market sentiment in greater depth each day.
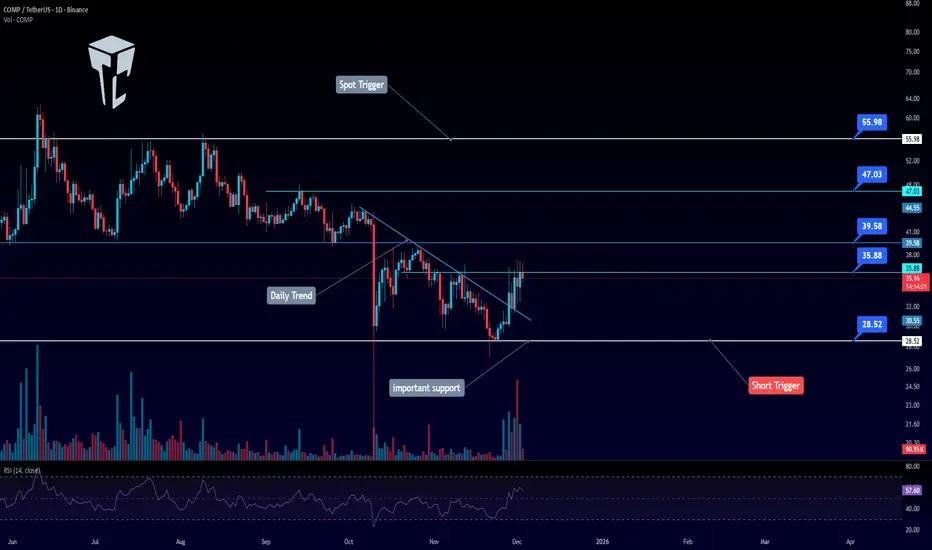
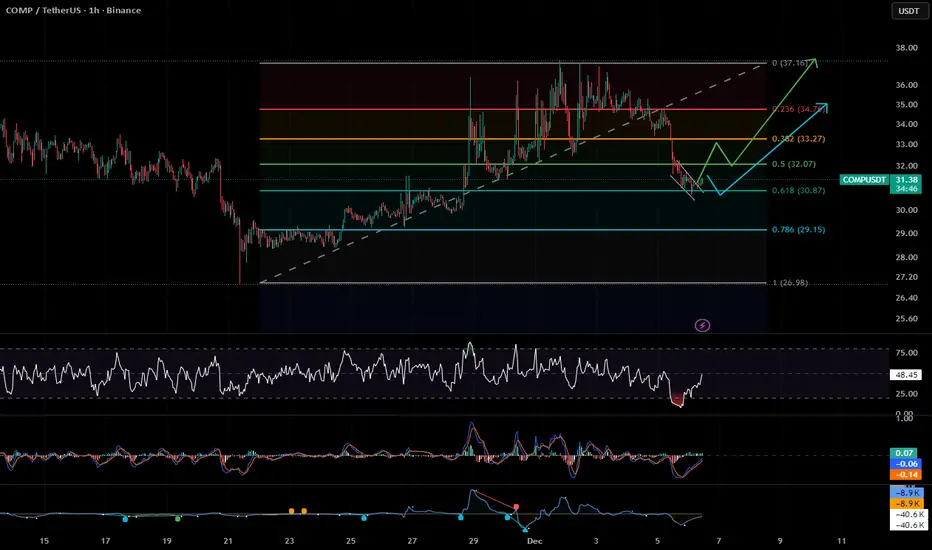
On the daily timeframe, after the sharp decline that broke $39.58, the price dropped toward the major support at $28.52.
Price was supported from that level, and despite several attempts to break below it, the zone held strong — leading to a bounce and eventually a breakout of the daily trendline.
Currently, price is sitting just below the trendline trigger.
Since this trendline break is part of a reversal structure, we still need confirmation.
A break above $39.58 would provide a clear long trigger and open the way for bullish continuation.
However, if you have entered a position anywhere within this range, it’s best to place your stop-loss below the $28.52 support zone, and manage your risk accordingly.
📝 Final Thoughts
Stay calm, trade wisely, and let's capture the market's best opportunities!
This analysis reflects our opinions and is not financial advice.
Share your thoughts in the comments, and don’t forget to share this analysis with your friends! ❤️
Trade ideas
COMP READY FOR COMEBACKCOMP showing strong Bullish Technicals after years of Accumulation on HTF. COMP’s fixed 10M supply (9.67M circulating) leaves limited new emissions. COMP’s price hinges on executing growth initiatives (RWA adoption, emission reforms) while navigating institutional sell pressure. While not a direct catalyst, COMP benefits from narrative-driven flows into governance tokens perceived as undervalued. Use Proper Risk Management

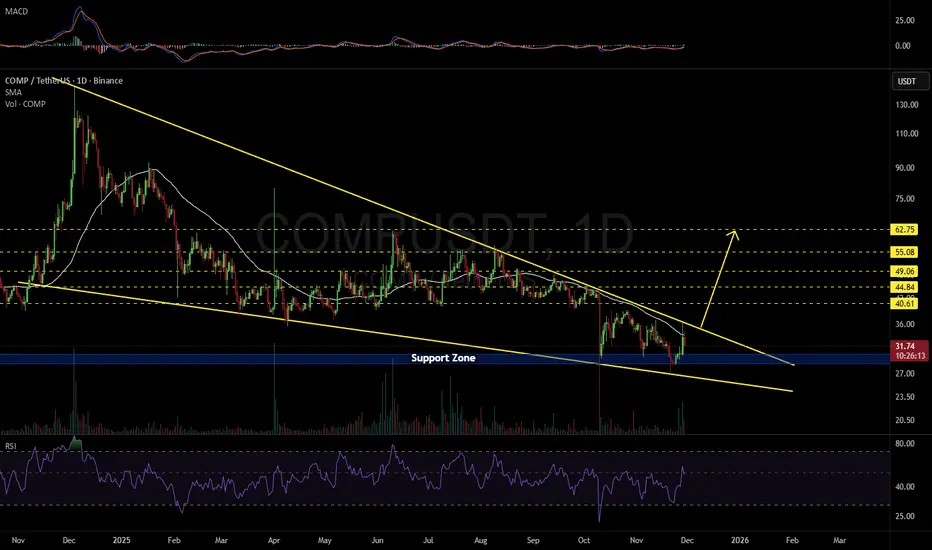
COMPUSDT 1D#COMP is moving inside a falling wedge pattern on the daily chart. Its first breakout attempt was rejected at the wedge resistance, and the second attempt was rejected at the daily SMA50. Consider buying a small bag near the support zone. If price breaks above both the wedge resistance and the SMA50, the potential upside targets are:
🎯 $40.61
🎯 $44.84
🎯 $49.06
🎯 $55.08
🎯 $62.75
❌ Invalidation: a daily candle closing below the wedge support.
⚠️ Always remember to use a tight stop-loss and maintain proper risk management.
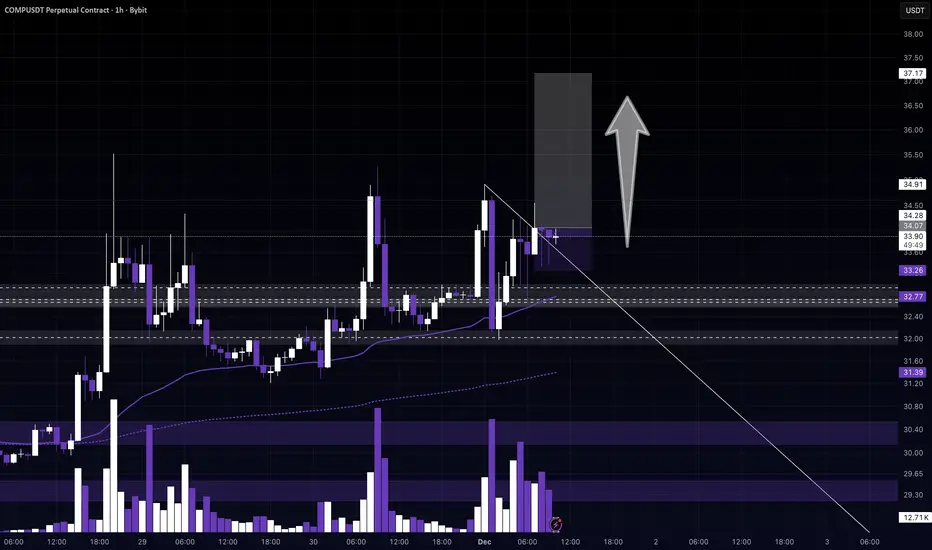
COMPUSDT – Up Move?Alright guys, we had a major liquidation party this morning —
half the market got slapped, carpets pulled, stop-losses harvested… the usual crypto breakfast.
But COMPUSDT?
This thing is holding like a champion.
Barely flinched.
Didn’t panic.
Didn’t cry.
Just stood there like:
“Is that all you got?”
What do I expect?
A potential Bitcoin bounce today, and if BTC decides to stop being dramatic for 5 minutes, COMPUSDT could easily catch a nice follow-up pump.
BUT —
(there’s always a ‘but’ in crypto)
We never know for sure.
Ever.
So the only thing 100% guaranteed today is:
👉 Risk management ON POINT.
👉 Keep your capital safe.
👉 Don’t get caught in another round of liquidation Olympics. 😄
Good luck traders, stay safe and may COMP behave better than the rest of the market today! 🚀💜
COMP is developing bullishCOMP is developing bullish divergences on the 1H TF.
However, a safer approach is to wait for a confirmed breakout and close above the 0.5 Fib zone, followed by an entry with a properly placed stop
COMP/USDT — Final Accumulation Zone Before the Next Macro Move?
“History doesn’t repeat, but it often rhymes — COMP returns to the same accumulation box that launched previous rallies.”
For more than two years, COMP has been trading inside a wide multi-year range, and price has once again reached the major accumulation zone at 33.5 – 25.5 USDT (yellow block).
This area has acted as a strong demand base since 2022 — every touch within this zone has historically triggered sharp rebounds.
Now, COMP is back at the exact same level — and the market is asking one critical question:
Is this the beginning of a new macro cycle, or the last breakdown before capitulation?
---
📊 Technical Structure & Pattern
Demand Zone (33.5 – 25.5 USDT): Long-term support where buyers have consistently stepped in.
Multi-Year Range: Extended consolidation suggests major supply exhaustion and possible accumulation by strong hands.
Deep Wick (~9.8 USDT): Indicates a historical liquidity sweep — often a signal of final bottom testing.
Layered Resistances: 55 → 89 → 118 → 173 USDT — potential upside targets once momentum shifts.
---
📈 Bullish Scenario — “The Rebirth Setup”
If COMP manages to hold above 25.5 USDT and forms a strong rejection candle, the stage could be set for a major macro reversal.
Initial confirmation: Weekly bounce or bullish engulfing within 33.5–25.5 USDT.
Trigger for continuation: Weekly close above 55 USDT.
Target zones: 55 → 89 → 118 → 173 USDT.
This structure represents a potential transition from accumulation to markup phase,
where renewed attention could return to DeFi blue-chip projects like COMP.
> “If this box holds, COMP could mark the start of a new macro cycle — a quiet base before the next major wave.”
---
📉 Bearish Scenario — “The Last Line of Defense”
Failure to hold this yellow zone could be critical.
If COMP closes a weekly candle below 25.5 USDT, it would signal a breakdown of the long-term structure,
potentially opening the door toward the psychological 10 USDT area.
Such a breakdown would confirm the failure of the multi-year accumulation,
possibly leading to a final capitulation event before any long-term recovery can begin.
---
📍 Conclusion
COMP is now standing at a decisive turning point.
Holding above 25.5 → potential macro reversal.
Breaking below 25.5 → deeper downside risk toward single digits.
> “The market is testing conviction — this 33.5–25.5 USDT zone will decide who’s positioned for the next major move.”
---
#COMP #Compound #Crypto #DeFi #AccumulationZone #MacroCycle #TechnicalAnalysis #ReversalSetup #SwingTrading #CryptoMarket
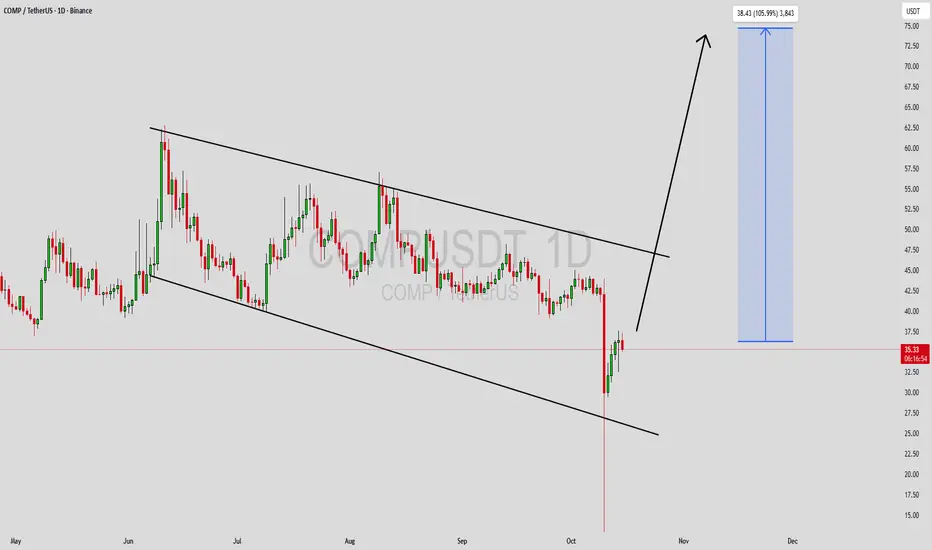
COMPUSDT Forming Falling WedgeCOMPUSDT is showing a strong falling wedge pattern, which often signals a potential bullish reversal in the market. After a period of sustained downward pressure, the price action is now consolidating within a narrowing range, indicating weakening selling pressure and growing buyer confidence. The good trading volume further confirms this pattern, hinting that a breakout may be on the horizon. If the resistance trendline breaks decisively, COMPUSDT could experience a powerful surge of 90% to 100%+ gain, aligning with its historical tendency for sharp recoveries after extended consolidation phases.
The current market sentiment toward COMP is improving as investors begin to recognize its strong fundamentals and the potential for a rebound. The falling wedge is typically a precursor to a strong upward breakout, especially when accompanied by rising volume and renewed momentum. As COMP approaches key resistance levels, traders are positioning themselves for a potential trend reversal that could ignite a new bullish wave in the coming sessions.
Additionally, with broader market confidence returning and decentralized finance (DeFi) tokens regaining traction, COMPUSDT appears well-positioned to capitalize on this shift. The pattern suggests that once the breakout occurs, the price could target significant upside zones as momentum accelerates. This setup makes COMP one of the coins to watch closely for traders seeking medium-term growth opportunities.
✅ Show your support by hitting the like button and
✅ Leaving a comment below! (What is You opinion about this Coin)
Your feedback and engagement keep me inspired to share more insightful market analysis with you!
COMP daily on geometry and gann fanare these circles predicting the daily move of comp. the fan on 1/3... will it stop the sideway movement? let s see through november

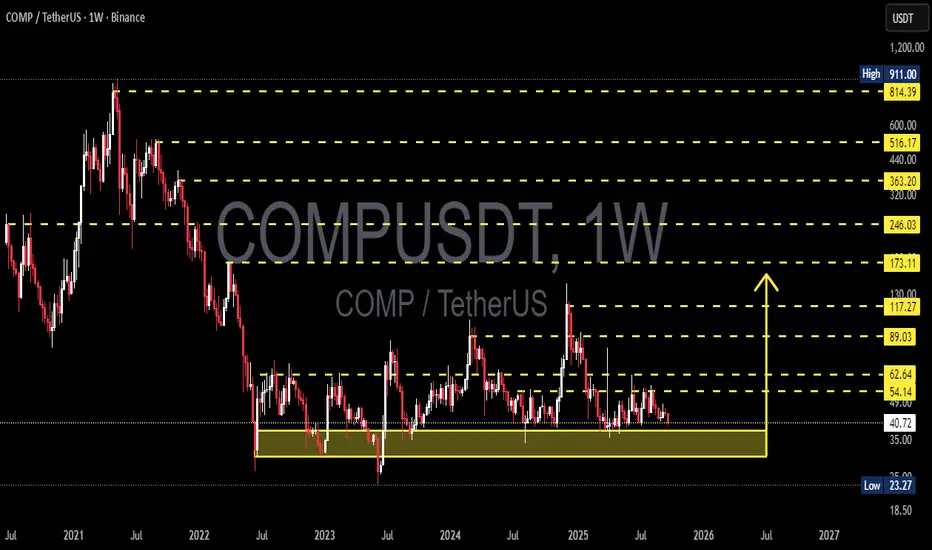
COMP/USDT — Accumulation Zone That Will Define the Next Big MoveCOMP/USDT is currently at a critical crossroads.
For months, price has been consolidating inside the long-term accumulation range between 23.27 – 40.88 (yellow box). This area has acted as a historical demand zone since 2022, and multiple retests have reinforced its importance.
Such prolonged sideways movement often signals an accumulation phase, where the market builds up energy before a significant breakout or breakdown. The direction of this move could define COMP’s trend for the coming months or even years.
---
🔹 Structure & Market Dynamics
Main trend: COMP has been in a macro downtrend since its 2021 peak, but now forming a potential accumulation base.
Strong range: 23.27 – 40.88 is a multi-tested support box that holds the key to the next move.
Key resistance: 54.14 – 62.64 is the crucial breakout zone. A close above this will shift mid-term momentum to the bulls.
Potential move: Long consolidations like this usually lead to explosive breakouts once the range is broken.
---
🔺 Bullish Scenario
1. Trigger: Weekly close above 62.64 with strong volume → signals bulls regaining control.
2. Targets:
Measured move projection: ~58.5 (first step).
If momentum follows: 89.03 → 117.27 → 173.11.
3. Reversal confirmation: Formation of higher highs & higher lows on the weekly timeframe could mark the start of a new bullish cycle.
---
🔻 Bearish Scenario
1. Trigger: Weekly close below 23.27 → confirms demand exhaustion.
2. Impact: Breakdown from this long-term support may trigger a capitulation sell-off, driving prices much lower.
3. Confirmation: Repeated rejection from resistance + rising sell volume would validate continuation of the bearish trend.
---
🎯 Key Takeaways
The longer the consolidation, the bigger the potential breakout.
23.27 (support) and 62.64 (resistance) are the two most important levels to watch.
Traders can use this area for measured accumulation with tight risk controls, or simply wait for confirmation of breakout/breakdown before positioning with the trend.
---
📌 Conclusion
COMP is at a critical inflection point. A breakout above 62.64 could open the door for a multi-layered bullish rally toward 173+. On the flip side, a breakdown below 23.27 would likely extend the bearish cycle and push COMP into new lows.
This 23–40 zone is where the ultimate battle between buyers and sellers is taking place — and the outcome will decide COMP’s long-term trajectory.
---
#COMP #COMPUSDT #Compound #Crypto #Altcoins #DeFi #TechnicalAnalysis #PriceAction #WeeklyChart #CryptoTrading
Swing playNot financial advice, take it lightly
Wbullishbreaker golden zone, mitigation.
Wbearishbreaker untested golden zone or at least 45% expected

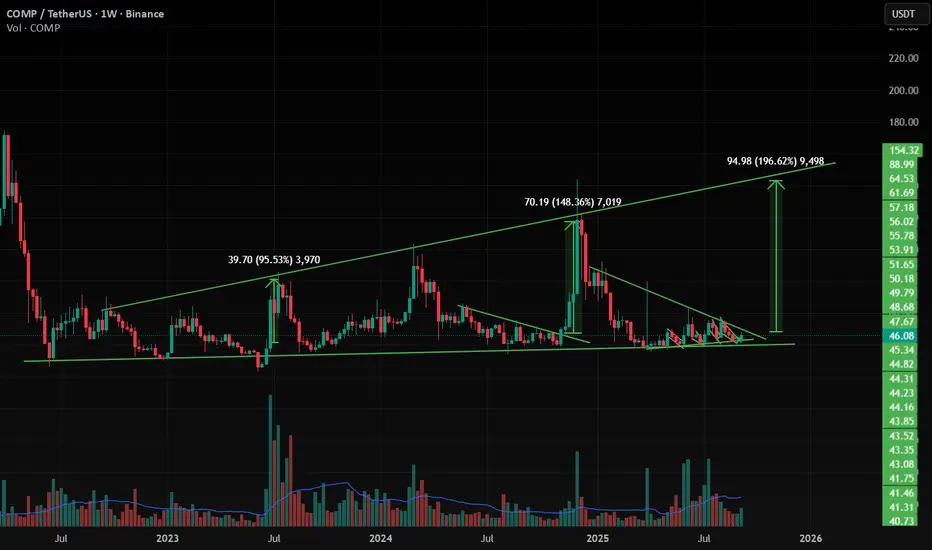
COMP/USDT , 1W , Bullish COMP has moving same as previous moves , so it will give nearly 200 % UP move very strong if it breaks the upper trendline in Weekly and strong candle close .
it has forming Expansion channel pattern inside it is giving good up movement when it touches
support zone and breaking out from the pattern in weekly time frame .
and at the same time Bitcoin dominance is decreasing and altcoins dominance is started increasing , so look on all the altcoins
and follow proper risk management , it has very good chances to move UP side but first we have to protect the down side , where risk management comes into game .
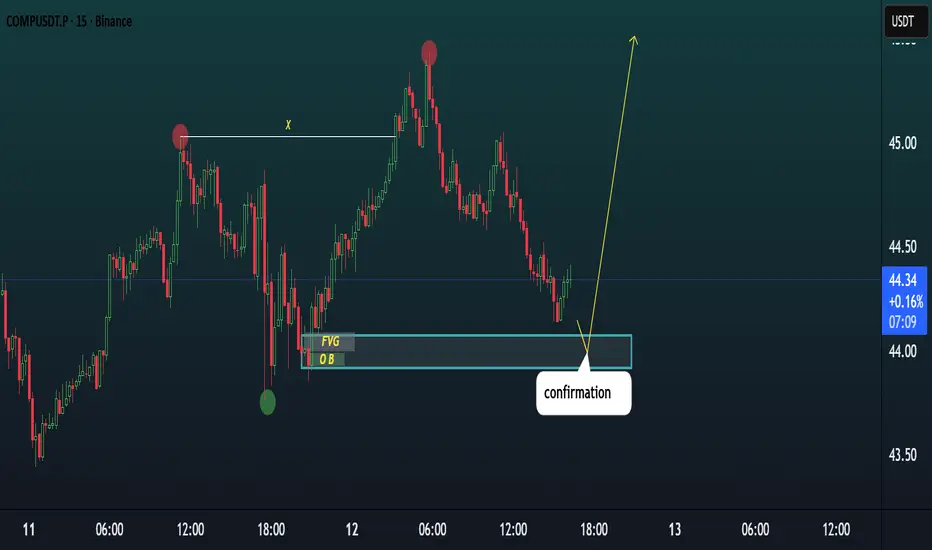
COMPUSDT TRADE IDEA.COMPUSDT (15m) Market Outlook
Price hasn’t reached the OB + FVG demand zone yet.
The marked POI around 43.9 – 44.1 is still untouched.
We’re waiting for price to drop into this zone and then form a bullish confirmation candle (engulfing / CHoCH) to validate the setup.
Until price reacts, the setup remains unconfirmed.
Next move depends on whether buyers defend this zone or price breaks lower.
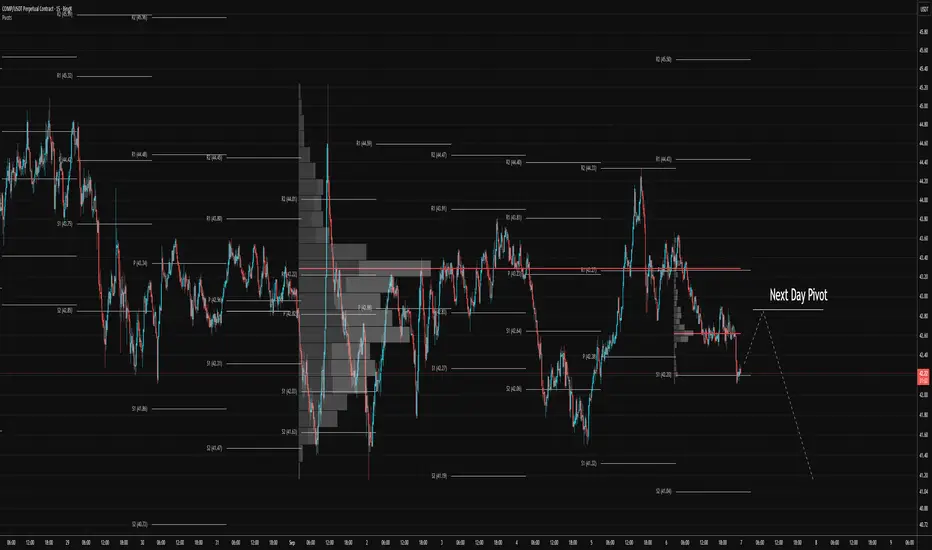
COMP: Pivot PlayExperimenting with stop orders on COMPUSDT and a few other altcoins.
Overnight, COMPUSDT might be attracted to the daily PIVOT for the next day and then fall again to continue the trend.
Elliot Wave charting in altcoins is almost pointless. Instead, I have to rely on simple tricks like pivot levels, POC, and trend indicators.
Can continue going down, though.
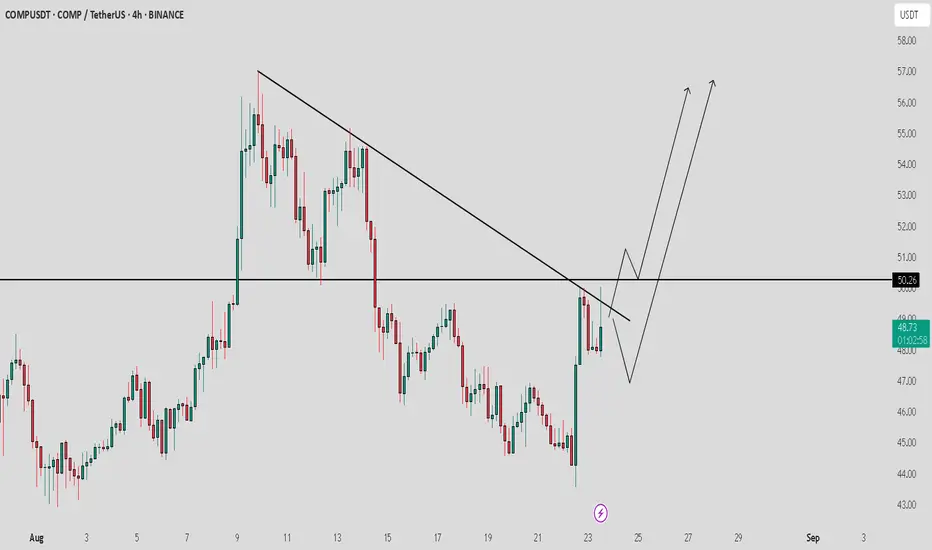
Comp / USDT : Looking bullishCOMP/USDT is approaching a key trendline resistance and looks ready for a breakout. A successful move above this level could trigger a strong rally toward $56–58 in the short term.
For the mid-term outlook, the next target zone stands around $80 if momentum continues.
Keep a close watch and trade with proper risk management — confirmation is the key to avoid traps.
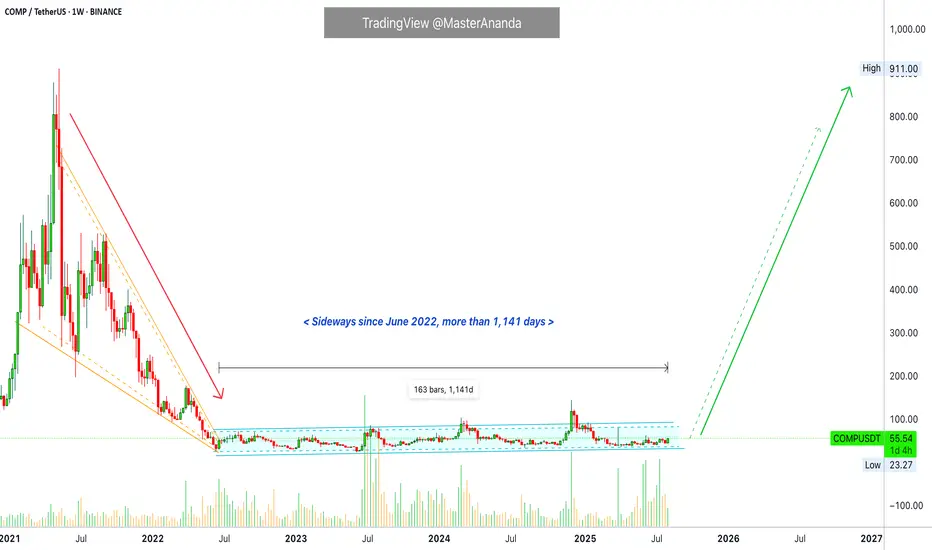
Compound 1,141 Days Long Consolidation EndsCompound is trading at true bottom prices. Compound has been sideways for 1,141 days, more than three years.
This is not a bear market. The market has been even rising slowly within the long-term accumulation and consolidation period.
Trading volume has been big on the buy-side for years. Major buying is present always since the bear market ended in June 2022.
First we had a bear market. This is the period on the left side of the chart with decreasing prices.
Then we had a period of consolidation, the market moves sideways without producing a trend.
Last, we get a new trend, an uptrend. Since we had a bear market last, we get a bull market next. The bull market is followed by a bear market and the cycle repeats.
Some pairs can evolve but the market tends to produce similar patterns long-term.
We are going up, we know this based on past and current market action.
Namaste.
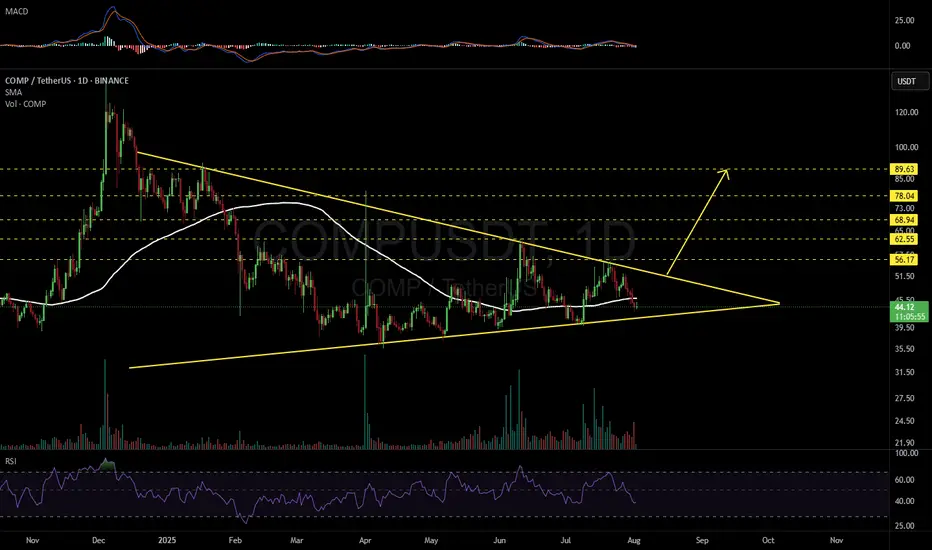
COMPUSDT 1DMany of you have been asking about #COMP.
It needs to hold the triangle’s support line and ideally reach above the daily SMA100 as soon as possible — only then can we expect a potential bullish move.
In any case, if a breakout occurs above the triangle resistance, the upside targets are:
🎯 $56.17
🎯 $62.55
🎯 $68.94
🎯 $78.04
🎯 $89.63
⚠️ As always, use a tight stop-loss and apply proper risk management.
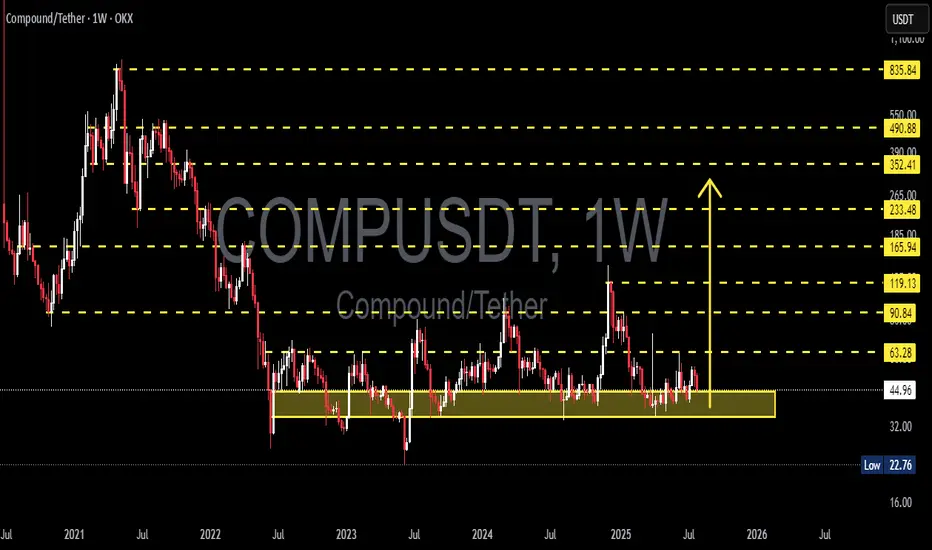
COMPUSDT in a Strong Demand Zone! Reversal Potential / Breakdown🔍 In-Depth Analysis (Timeframe: Weekly / 1W)
The COMP/USDT pair is currently hovering above a long-term demand zone that has held strong since mid-2022. Price is sitting around $44.90, just above the key support area of $32 – $45 (highlighted in yellow), which has acted as a major accumulation zone for over 2 years.
🧱 Critical Zone: Smart Money Accumulation or Exhaustion?
The $32–$45 demand zone has been tested multiple times, indicating smart money interest and hidden buying pressure.
Price action in this range forms a clear base structure or horizontal accumulation pattern, a classic setup before a large directional move.
However, the prolonged sideways consolidation hints at an imminent breakout or breakdown — momentum is building.
---
📊 Key Technical Pattern:
🟨 Rectangle Range (Accumulation Structure)
Price has been ranging between $32 and $63.28 with no clear breakout.
Strong rejections every time price dips below $35 indicate consistent buyer defense.
🔃 Mean Reversion Behavior
Repeated moves back to the mid-range reflect an indecisive market (equilibrium phase), often seen before expansion.
---
📈 Bullish Scenario (Potential Reversal):
If price breaks above major resistance at $63.28:
1. Upside Targets:
🎯 $90.84 (key resistance zone)
🎯 $119.13 (prior distribution zone)
🎯 $165.94 (macro target if sentiment turns highly bullish)
2. Confirmation needed via weekly close above $63 with strong volume.
3. A bullish breakout may form a new Higher Low and Higher High structure on both daily and weekly timeframes.
🟢 Bullish confirmation: Weekly bullish engulfing + volume breakout above $63.
---
📉 Bearish Scenario (Potential Breakdown):
If price closes below the $32 support:
1. Possible downside targets:
⚠️ $22.76 (next logical support)
🚨 $16 (last consolidation base pre-2021 rally)
2. A break below this long-term support could trigger a final capitulation flush before a potential macro reversal.
🔴 Bearish confirmation: Weekly close below $32 with increased volume and sustained selling.
---
⚖️ Strategic Takeaway:
COMP/USDT is currently at a pivotal decision zone — a crossroads between massive upside potential and deeper downside risk.
This is not just another support area, it’s a macro-level demand zone that will likely dictate trend direction in the coming months.
⏳ A major move is brewing — whether breakout or breakdown, be ready.
#COMPUSDT #CryptoOutlook #TechnicalAnalysis #AltcoinSeason #DeFi #CryptoTrading #AccumulationZone #BreakoutSetup #BearishScenario #BullishSetup #CryptoAnalysis
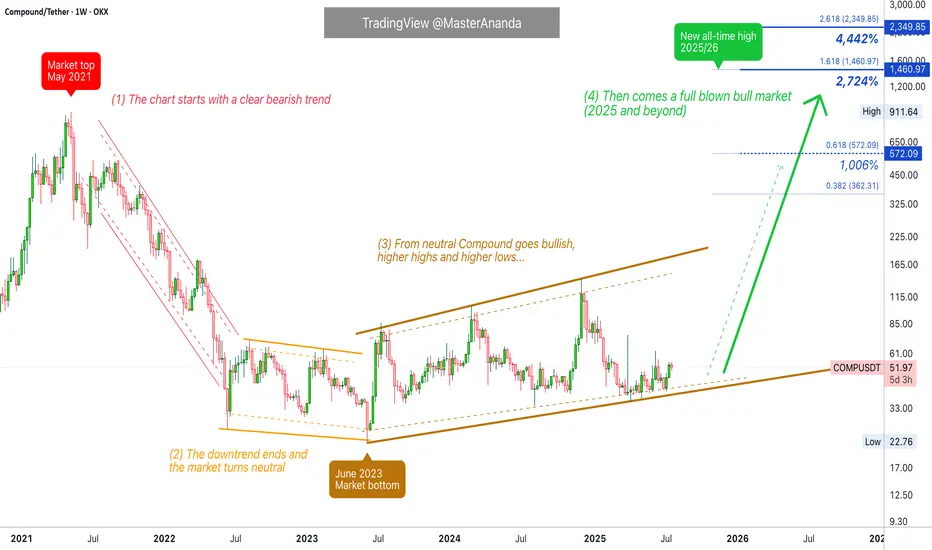
Compound Full Market Cycle · 1, 2, 3 & 4 (PP: 2,700% - 4,442%)This is the full long-term Compound (COMPUSDT) chart.
1) The market top happened May 2021. Notice how the bull market in 2021 ended early compared to 2025. While May signaled the start of a bear market, in 2025 we are already in July while trading at bottom prices.
High prices, a new all-time high, signals the start of a descent and bear market. COMPUSDT dropped from May 2021 until June 2022, more than a year. A shy lower low happened next around June 2023, a technical double-bottom.
2) Between June 2022 and June 2023 we have a neutral period, sideways. This is a "lost year."
3) Market dynamics change after June 2023. COMPUSDT stops producing lower lows and instead starts a bullish consolidation phase. Higher highs but still sideways. No major uptrend. This period lasts from June 2023 until present day, July 2025.
The pattern will break with a strong close above $150 followed by a sustained uptrend.
4) This is the 2025 bull market which can extend beyond this year into 2026, hopefully. Here instead of neutral or sideways, we should see a major uptrend as the mirror image of the 2021 downtrend. Also, a new all-time high is needed and expected to end this cycle. When the new all-time high hits, bearish conditions develop and the next bear market starts.
Potential for growth is huge, between 28 and 45X.
Thank you for reading.
Namaste.
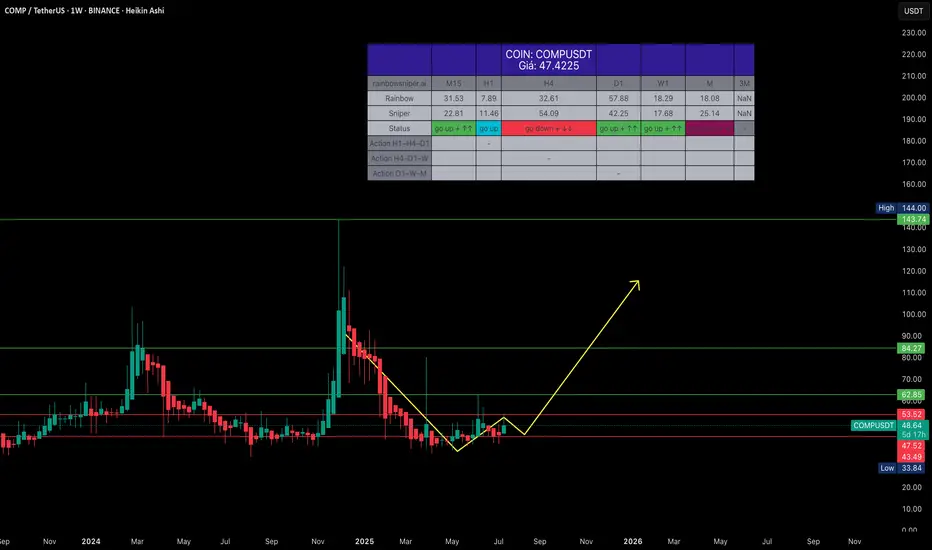
COMPUSDT – Long-term Spot Buy RecommendationCOMPUSDT – Long-term Spot Buy Recommendation
Hello,
In a market flooded with thousands of tokens, manually scanning for trending coins is exhausting and often ineffective. If that resonates with you, COMPUSDT is a worthy candidate to consider.
Current Outlook: COMPUSDT is in an accumulation phase, and the current price zone offers an ideal long-term buying opportunity. Though it's a long-term play, you can still expect to take profits within 2025.
Trade Type: Long-term Spot (2025 hold)
Entry Zone: Around $43 – $47, accumulate within this range.
Take Profit Strategy:
_Based on Weekly (W) peaks.
_Price reference points: $84 – $140.
_Strongly recommend holding above $100 for maximum gains.
Note:
If you're seeking quick profits, this isn’t the coin.
But with patience over 1-2 months, this investment should reward you handsomely.
Hỏi ChatGPT
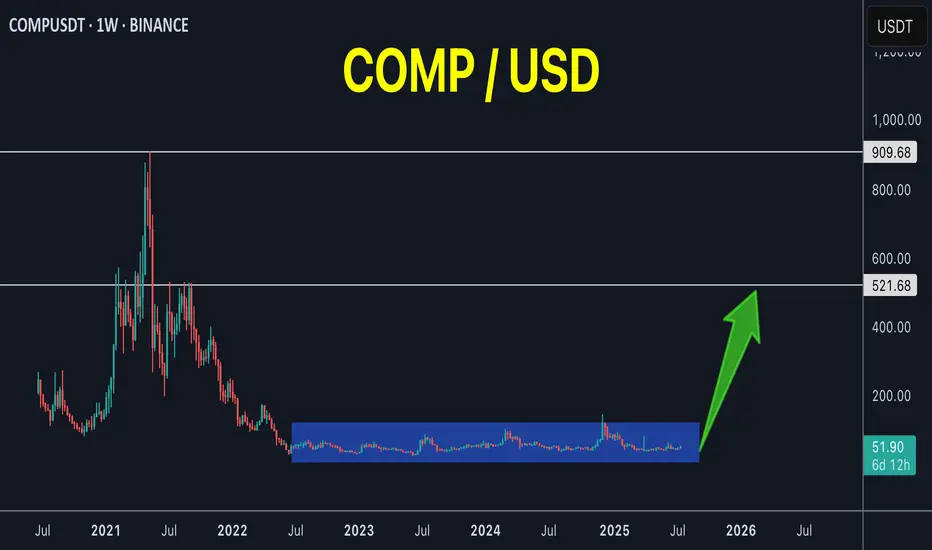
COMP 3 years of accumulation!COMP / USDT
3 years of accumulation and volume start to enter again
Just imagine if it breaks out from this long accumulation, the target will be very high but first we must breakout this accumulation box
Best of wishes
COMPUSDT longHi Traders
Today we are analysing COMP/USDT (BINANCE) on 4-hour timeframe.
The price has been consolidating heavily around $40 support level, showing multiple rejections and signs of potential exhaustion.
I recommend waiting for a slight dip below this support zone ($40) to trap late sellers and look for a potential long entry.
If the pattern holds, we could see a strong bullish reversal targeting the resistance ($60) which offers a favourable risk-to-reward setup.
Keep an eye on price action for confirmation before entering.

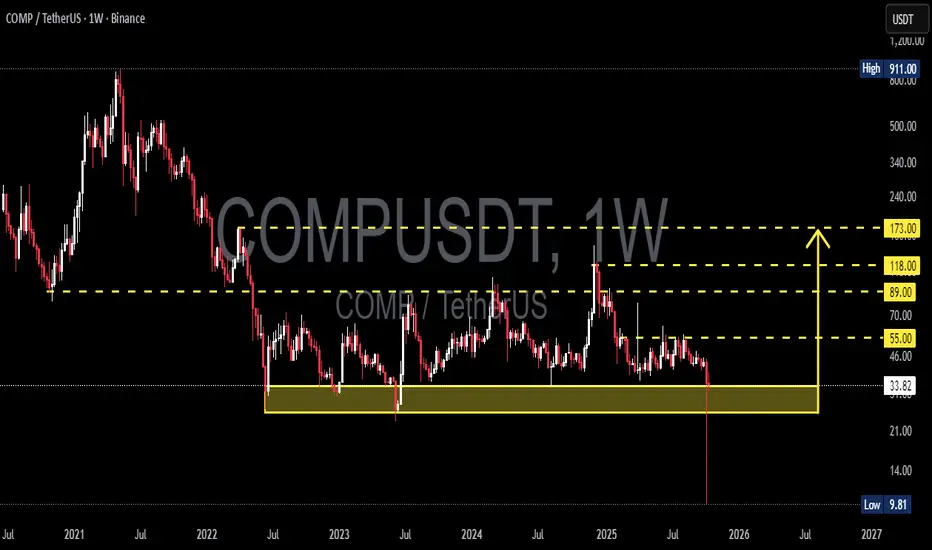
COMPUSDT Accumulation Ending? Massive Bullish Reversal Ahead!
🧠 Weekly Analysis
After peaking near $911 in 2021, COMPUSDT experienced a prolonged downtrend, followed by a wide sideways accumulation phase around the $33–$41 range.
📉 This consolidation has formed a classic Wyckoff Accumulation structure, often seen before strong bullish reversals.
🟨 Key Support & Demand Zone:
🔻 Accumulation Zone: $33–$41
This range has acted as a strong floor since mid-2022.
Multiple rejections from this zone hint at smart money accumulation.
Recent long wicks and bullish rejections from this zone signal a potential reversal brewing.
🔮 Bullish Scenario:
If the price holds above the accumulation zone and breaks key resistance, the bullish case unfolds as follows:
📈 Bullish Price Targets:
1. ✅ $62.64 — First breakout confirmation.
2. ✅ $89.03 — Minor resistance and psychological level.
3. ✅ $117.27 — Major historical resistance.
4. ✅ $173.11 — Medium-term target.
5. ✅ $246.03 — Potential full target from pattern projection.
6. 🚀 Extension Targets: $363–$516 in case of a strong altcoin rally.
🔥 Breakout Confirmation: Weekly candle close above $62.64 with volume surge.
🧨 Bearish Scenario:
If the $33 support zone breaks and closes below:
⚠️ Possible downside:
Drop toward $23.27 (2022 low)
Extreme scenario: retest of $17 zone
This invalidates the current bullish structure and resumes macro downtrend
📊 Patterns Observed:
🔹 Extended Accumulation Range
🔹 Potential Inverse Head & Shoulders (in development)
🔹 Double Bottom Structure (awaiting neckline breakout)
These patterns suggest a market gearing up for a major shift — but volume and breakout confirmation remain crucial.
📅 Summary & Strategy:
🟢 Entry Zone: $35–$42 (low-risk accumulation)
🟡 Breakout Zone: Above $62.64
🔴 Stop Loss: Weekly close below $33
➡️ Favorable risk-to-reward setup for mid- to long-term swing traders and investors.
💡 Watch for breakout volume and BTC’s direction for confluence.
#COMPUSDT #CryptoBreakout #AltcoinSeason #WyckoffAccumulation #SwingTrading #CryptoTechnicalAnalysis #COMP #BreakoutSetup #CryptoAnalysis #BullishStructure

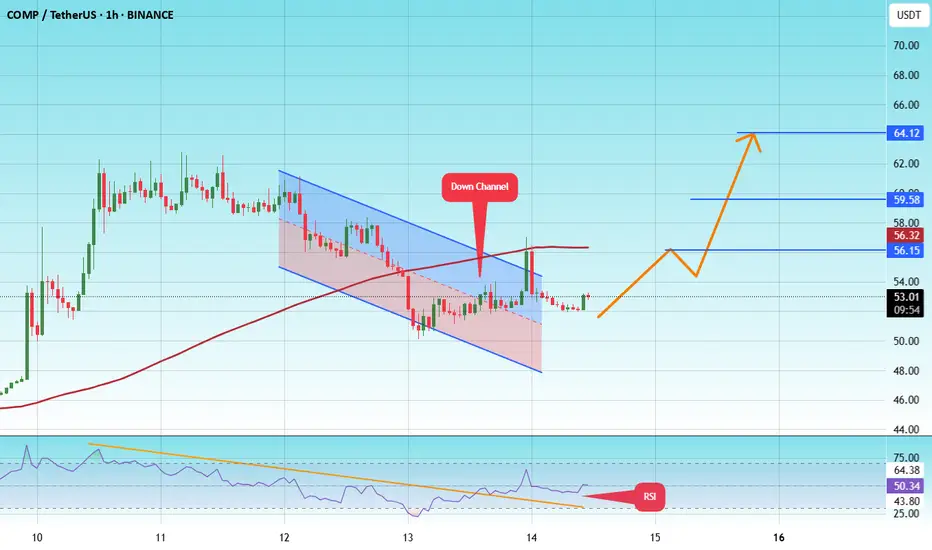
#COMP/USDT#COMP
The price is moving within a descending channel on the 1-hour frame and is expected to break and continue upward.
We have a trend to stabilize above the 100 moving average once again.
We have a downtrend on the RSI indicator that supports the upward move by breaking it upward.
We have a support area at the lower limit of the channel at 48, acting as strong support from which the price can rebound.
Entry price 53
First target 56
Second target 60
Third target 64