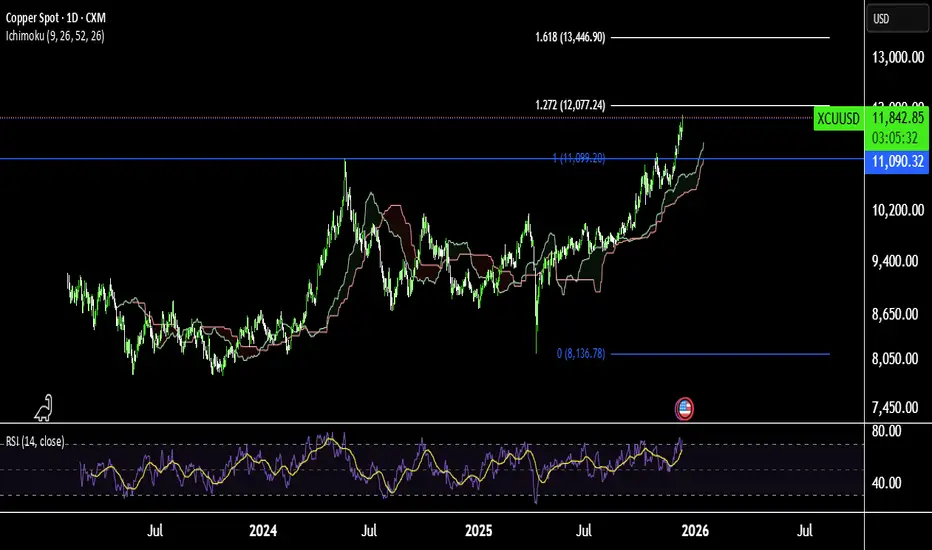
Copper Trend Acceleration! LSMA Pullback Supports the Move!🔥 XCU/USD — “COPPER VS U.S. DOLLAR”
🔧 Metals Market Opportunity Blueprint (Day / Swing Trade Edition)
📌 🔵 Market Plan: Bullish Structure Confirmed
Copper continues to showcase strong upside structure, and the LSMA Moving Average Pullback has now confirmed fresh bullish continuation momentum.
The pr
About CFDs on Copper
Copper is an essential industrial metal used worldwide. Copper prices are followed in financial markets around the globe and the metal is growing in popularity. Copper is widely used in construction and because of its electrical properties is found in wires and circuit boards. Copper is mined in open mines around the world, with Chile and the United States leading in overall copper production. The demand for copper is increasing as countries such as China and India continue to develop, while the supply remains tight. The growing demand and constrained supply is likely to keep copper prices volatile in the near future. Copper prices are commonly quoted in USD.

Copper Historic BreakoutCopper prices on the London Metal Exchange have surged above 11800 USD marking a new all time high in global markets. Over the past year this metal has delivered a strong 30% return driven by concerns over supply disruptions and rising demand from electric vehicles and AI related infrastructure. The
CopperXCUUSD
- Fair Value Gap
- Order Block
- Fibonacci Level - 78.60%
- Completed " 123 " Impulsive Waves
- Resistance Level

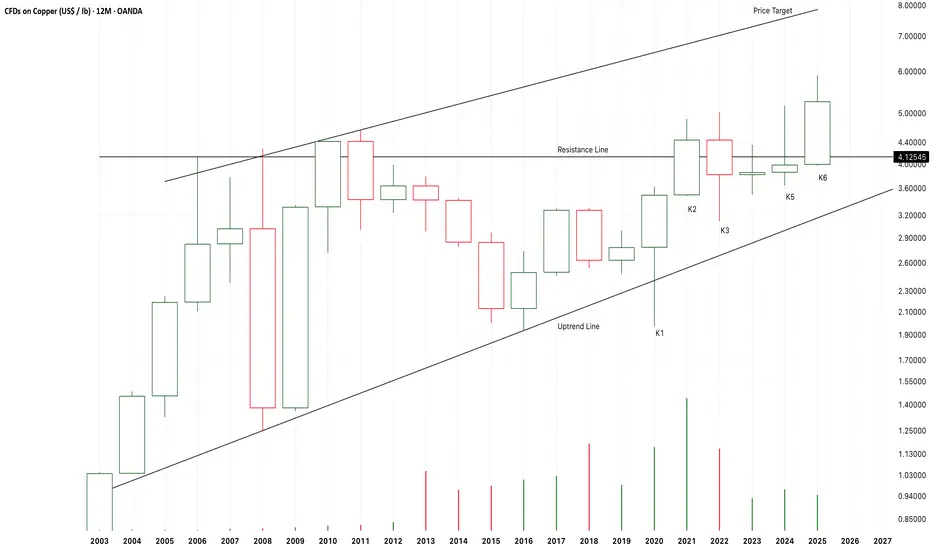
Chart Pattern Analysis of Copper.
K6 is breaking the neck line of a large scale triangle pattern,
It seems that the following candles will keep accelerating.
A nearest price target at about 8USD area.
I will try to decrease my long-term positions at gold,
And increase the positions at silver and copper.
Mostly increase my positio
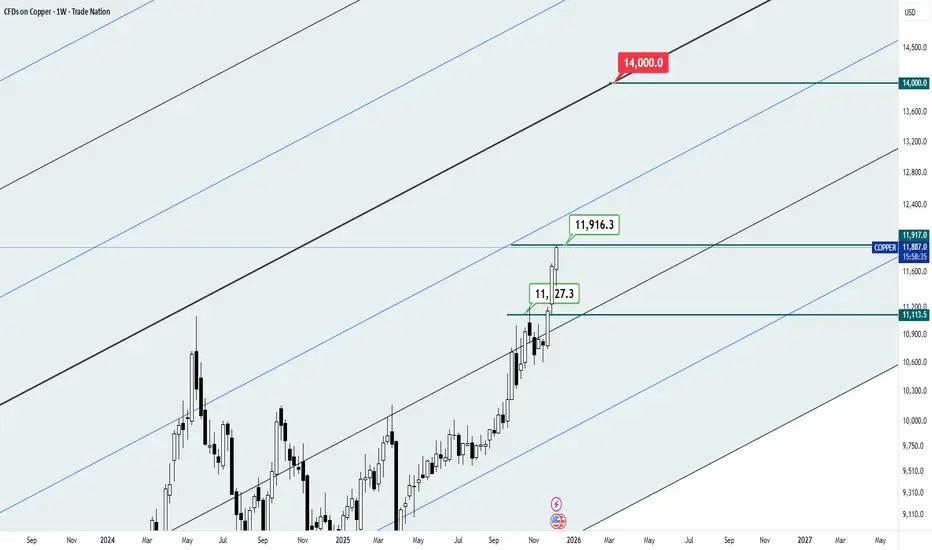
Copper continues to grow!The two price targets I envision on the chart, which indicate continued upward swings, are the powerful candles of the last two weeks that have made it easier to reach these targets in the medium term, and other than time, which requires more patience, I don't see any reason why we won't reach the d

What is the rate of 14K displayed for?According to the past analysis that you can see in the link below and the speed of its realization:
What the chart on Friday morning can do is keep the copper market active awake. The predictable rates for this metal are colorful and to hedge the risk, you should keep an eye on the future rates
Copper At A Crossroads: Rally Exhaustion Vs Macro RiskCopper just delivered a classic volatility sequence: a blow off into the 5.89 area, followed by a fast 27% flush in six days. Since printing the 4.29 low, price has been grinding higher and is now back into my short entry around 5.40, which is roughly a 26% retrace of the drop. What matters to me he

The Curious Case of Copper
Looking at the fundamentals for Copper, certain supply disruptions have pushed the market into deficits. Banks now forecast refined copper > $13 by late 2026.
Technical Analysis : As seen in the chart, Copper has traded in a clear uptrend since August. With the daily RSI near 70 and rising, mo

CopperXCUUSD
- Bullish Channel as an corrective pattern in Short Time Frame
- Resistance Level
- RSI - Divergence
- Completed " 1234 " Impulsive Waves
- BSL

CopperXCUUSD
- Fibonacci Level - 61.80% / 78.60%
- Demand Zone
- Completed " 12345 " Impulsive Waves and " AB " Corrective Wave
- Fair Value Gap
- Bullish Channel as an corrective pattern in Short Time Frame

See all ideas
Displays a symbol's price movements over previous years to identify recurring trends.