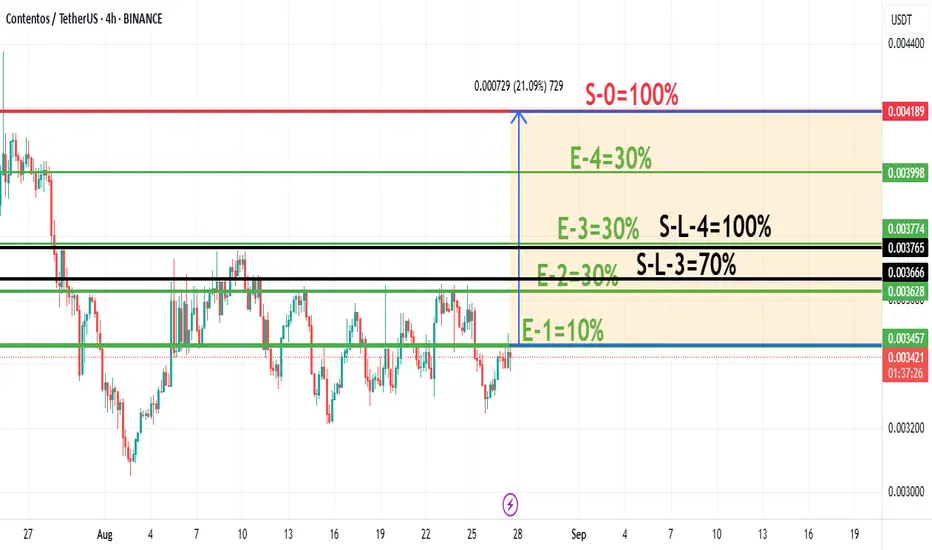
Proposed ~11% Average Gain Trade Strategy with COSThis is a 4-step buying plan where you add to your position as the price goes up. Your stop-loss automatically moves to a "breakeven" point after each phase, guaranteeing no loss if the price reverses.
1. The Entries (Buying More as it Rises):
E-1: Buy 10% at price 0.003457
E-2: Buy another 30% a
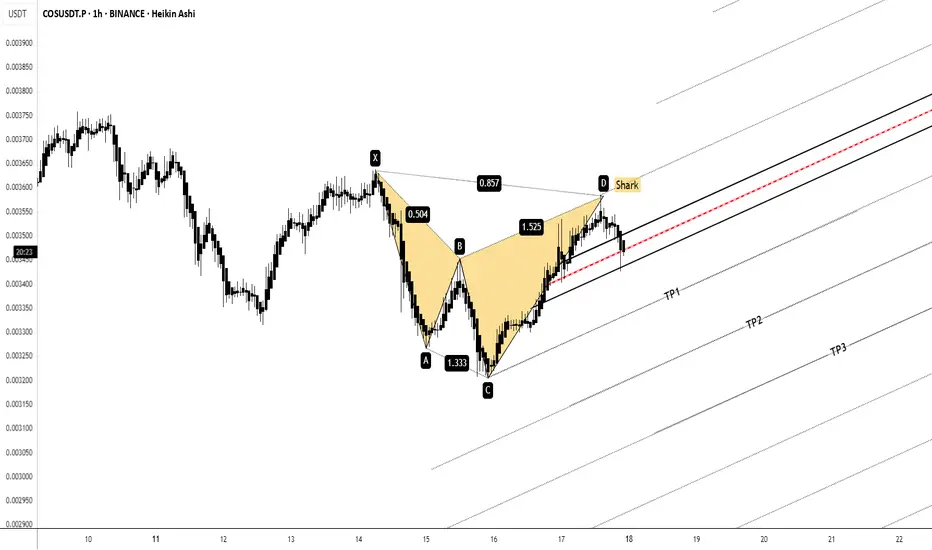
COSUSDT.P | 1H Short ThermOpening a short setup on COSUSDT.P (1H) based on the completion of a Shark harmonic pattern at point D.
🔎 Confluences:
– Shark pattern completion aligning with resistance
– TDG indicator flashing bearish momentum (Sell mode)
– Market structure respecting the pitchfork channel
📉 Setup:
– Entry: Poi
COSUSDT Forming Bullish MomentumCOSUSDT is displaying a strong bullish momentum pattern, indicating that buyers are firmly in control and pushing the market higher. This pattern reflects sustained upward pressure with minimal retracements, suggesting that market participants are confident about the asset’s future trajectory. With
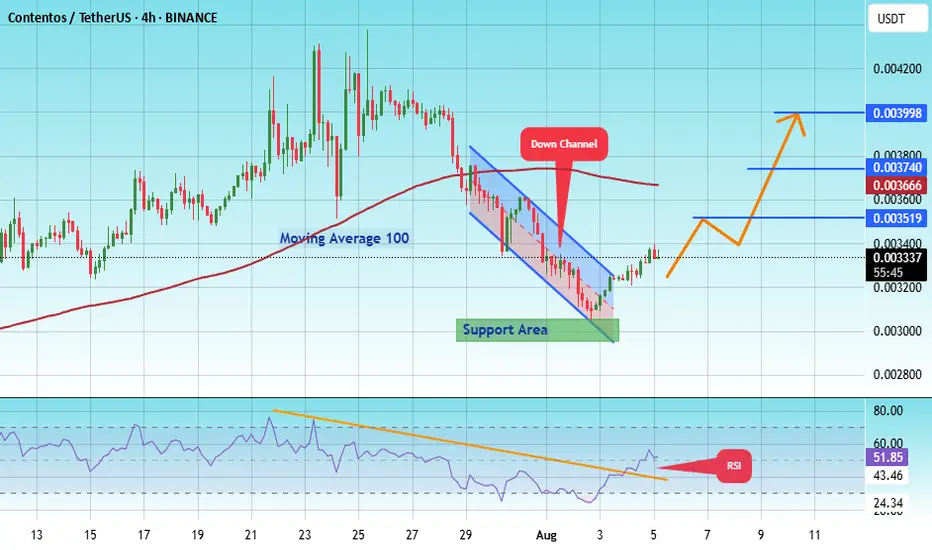
#COS/USDT : Breakout setup ? #COS
The price is moving within an ascending channel on the 1-hour frame, adhering well to it, and is poised to break it strongly upwards and retest it.
We have support from the lower boundary of the ascending channel, at 0.003071.
We have a downtrend on the RSI indicator that is about to break a
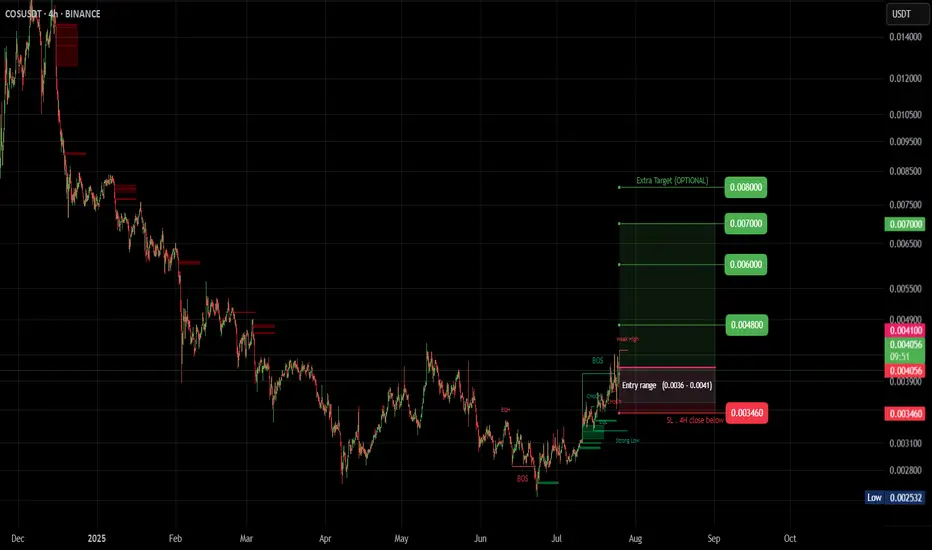
COS (SPOT)BINANCE:COSUSDT
#COS/ USDT
Entry (0.0036 - 0.0041)
SL 4H close below 0.003460
T1 0.0048
T2 0.0060
T3 0.0070
Extra Target
T4 0.0080
_______________________________________________________
Golden Advices.
********************
* collect the coin slowly in the entry range.
* Please calculate yo
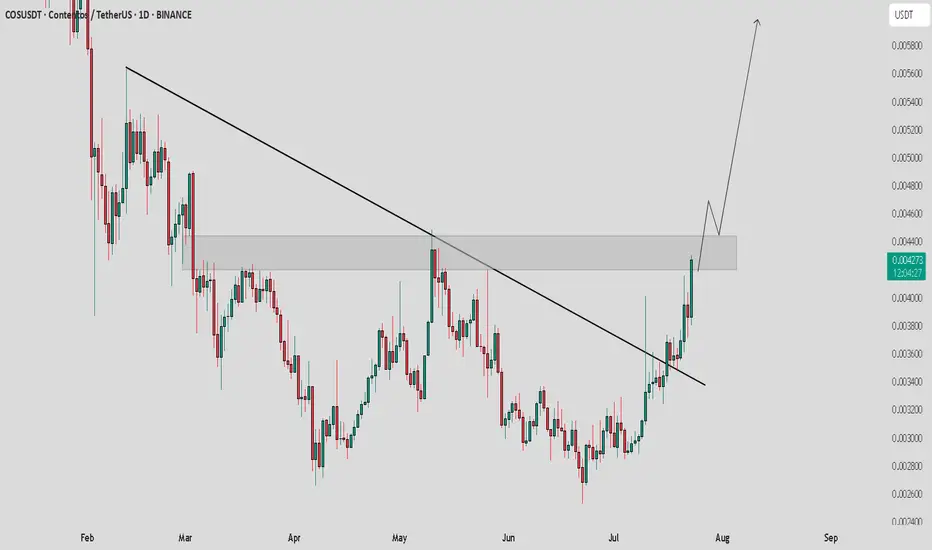
COS / USDT : Breakout setupCOS/USDT - Breakout Setup
COS/USDT is showing strong potential, currently trying to break out from horizontal resistance after a successful trendline breakout. Once the horizontal resistance is cleared, we could see a bullish move of +30% to +40%.
Bullish Scenario:
Break above horizontal resistan
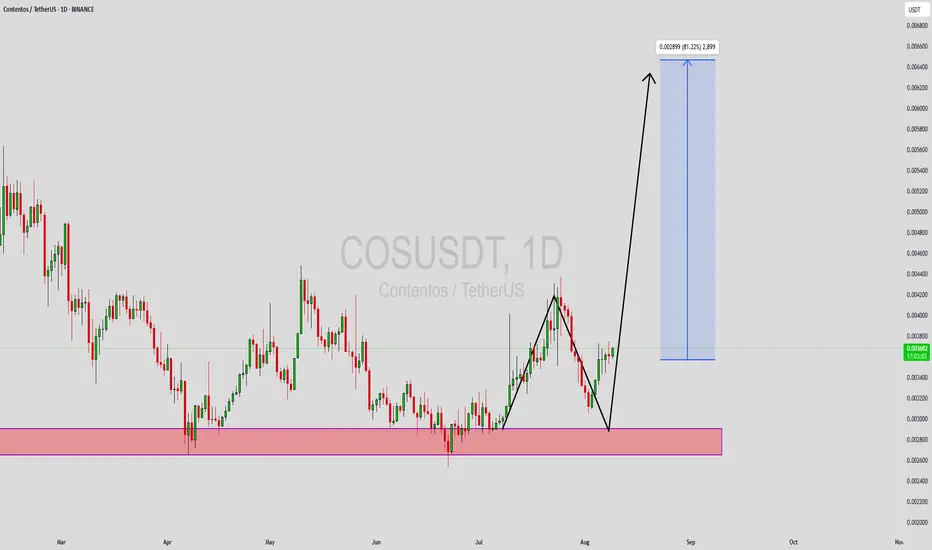
COSUSDT 1D#COS has formed a double bottom pattern on the daily chart. To confirm this pattern, it needs to break above the resistance zone.
Consider buying some here or near the support level at $0.003508.
For the bullish scenario to fully unfold, the price must break above both the resistance zone and the da

COS/USDTKey Level Zone: 0.002990 - 0.003010
LMT v2.0 detected.
The setup looks promising—price previously trended upward with rising volume and momentum, then retested this zone cleanly. This presents an excellent reward-to-risk opportunity if momentum continues to align.
Introducing LMT (Levels & Momentu

Contentos 1550% Potential, Bitcoin & The Evolution of FinanceThe previous all-time low happened March 2020, more than five years ago. The "new all-time low" happened last week, 22-June, just a few days ago.
Contentos, we traded many times before in the past and it has been mixed but mostly a success. How are you feeling right about now? Are you ready for a n

COSUSDT | Watching for a Breakout, Not Guessing OneI’m not rushing into COSUSDT just yet. The red box is still acting as resistance, and until it's broken and retested as support , there’s no valid reason to turn bullish.
This market rewards patience . Not blind hope.
Wait for structure. Wait for confirmation. That’s how you stay ahead.
“I w

See all ideas
Summarizing what the indicators are suggesting.
Oscillators
Neutral
SellBuy
Strong sellStrong buy
Strong sellSellNeutralBuyStrong buy
Oscillators
Neutral
SellBuy
Strong sellStrong buy
Strong sellSellNeutralBuyStrong buy
Summary
Neutral
SellBuy
Strong sellStrong buy
Strong sellSellNeutralBuyStrong buy
Summary
Neutral
SellBuy
Strong sellStrong buy
Strong sellSellNeutralBuyStrong buy
Summary
Neutral
SellBuy
Strong sellStrong buy
Strong sellSellNeutralBuyStrong buy
Moving Averages
Neutral
SellBuy
Strong sellStrong buy
Strong sellSellNeutralBuyStrong buy
Moving Averages
Neutral
SellBuy
Strong sellStrong buy
Strong sellSellNeutralBuyStrong buy