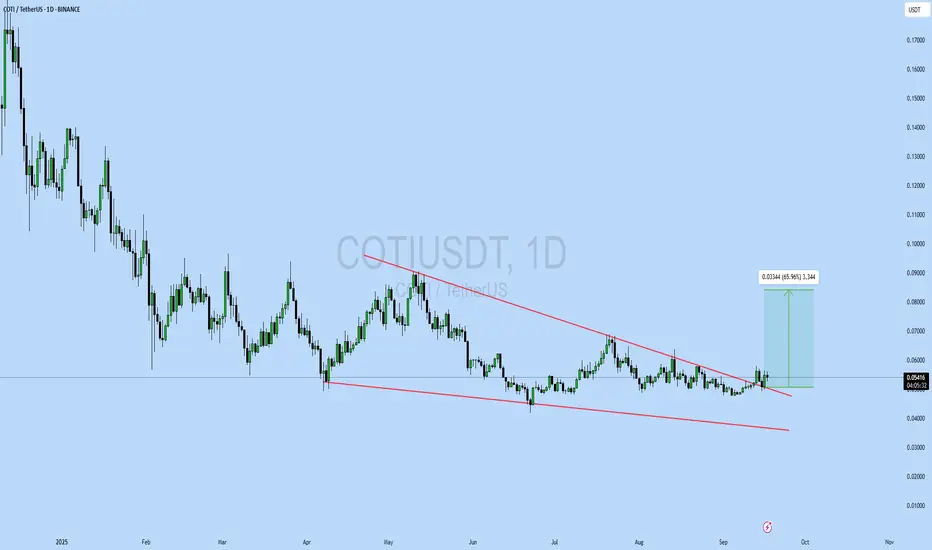
COTIUSDT UPDATE#COTI
UPDATE
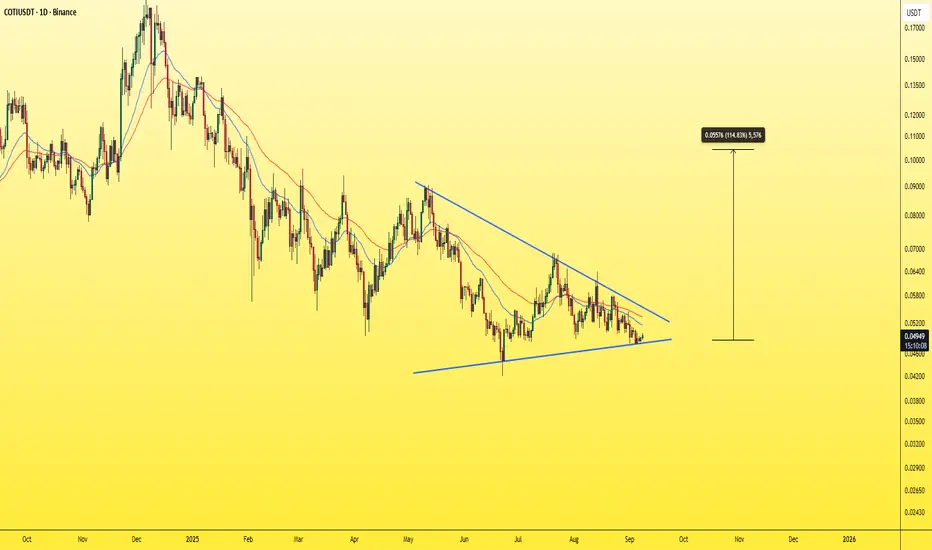
COTI Technical Setup
Pattern: Bullish Falling Wedge Pattern
Current Price: $0.0541
Target Price: $0.0875
Target % Gain: 65.96%
OTC:COTI is breaking out of a falling wedge on the 1D timeframe. Current price is $0.0541 with a target near $0.0875, showing almost 66% potential upside.
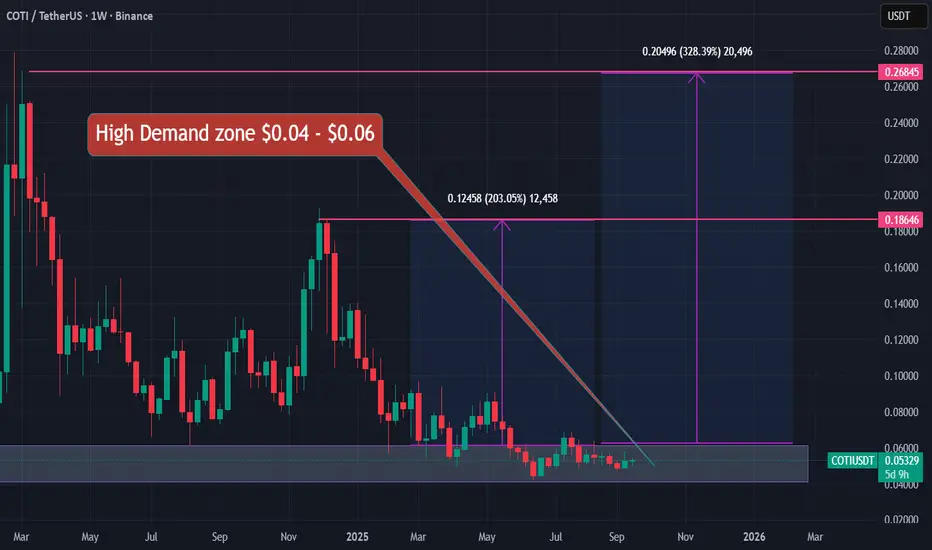
COTI/USDT potential 200%+++COTI/USDT potential 200%+++
Buy zone $0.04 - $0.06
Targets given on the chart 200% to 300%
COTI is a fast and light confidentiality layer on Ethereum. Powered by the breakthrough cryptographic protocol Garbled Circuits and secured by Ethereum, COTI introduces the most advanced and complian
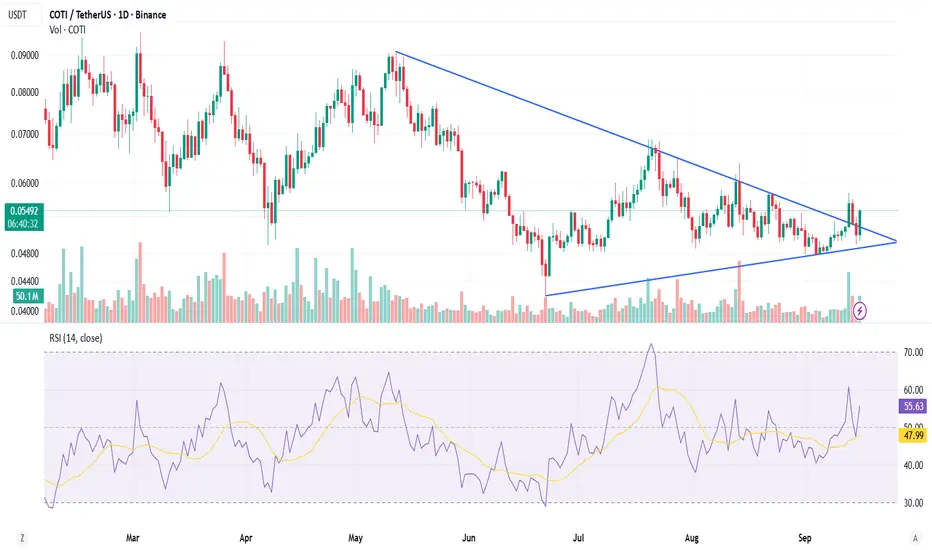
COTI/USDT – Symmetrical Triangle BreakoutCOTI has been consolidating inside a symmetrical triangle for several months, with lower highs and higher lows squeezing the price action.
🔎 Key Observations
Price has now broken out of the triangle resistance with a strong green daily candle.
Volume increased significantly on the breakout, confi
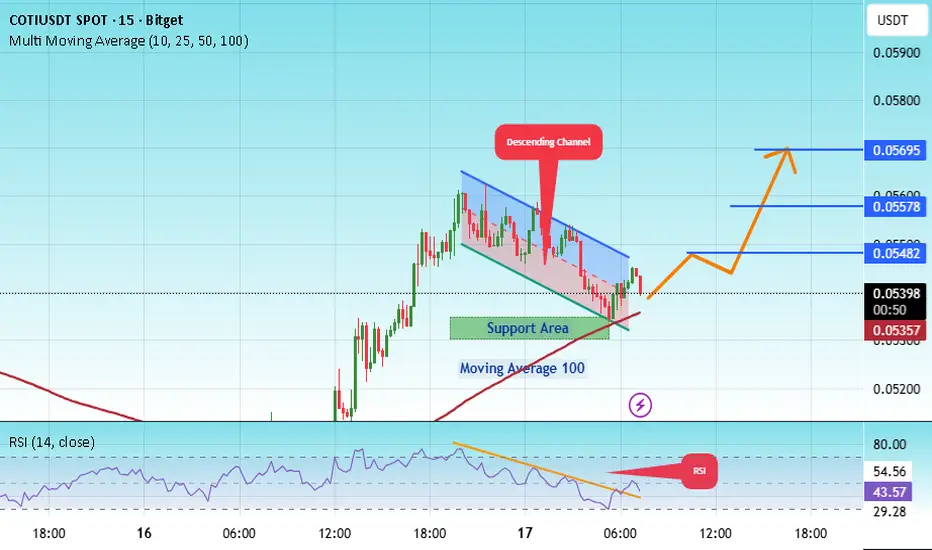
#COTI/USDT - Bottomed out!#COTI
The price is moving within a descending channel on the 1-hour frame, adhering well to it, and is heading for a strong breakout and retest.
We have a bearish trend on the RSI indicator that is about to be broken and retested, which supports the upward breakout.
There is a major support area
Long COTICOTI has just broken the resistance trendline being formed begining of 2025.
Long set-up is as in chart.
Disclaimer:
This analysis is based on my personnal views and is not a financial advice. Risk is under your control.

COTIUSDT - Bottomed out!Many coins have already reached bottom levels, and one of the strongest among them is COTI.
It has formed a symmetrical triangle pattern and is now sitting at one of its lowest levels, which is a strong support zone — buying here is almost like getting it at “nothing.”
COTI is currently gearing up
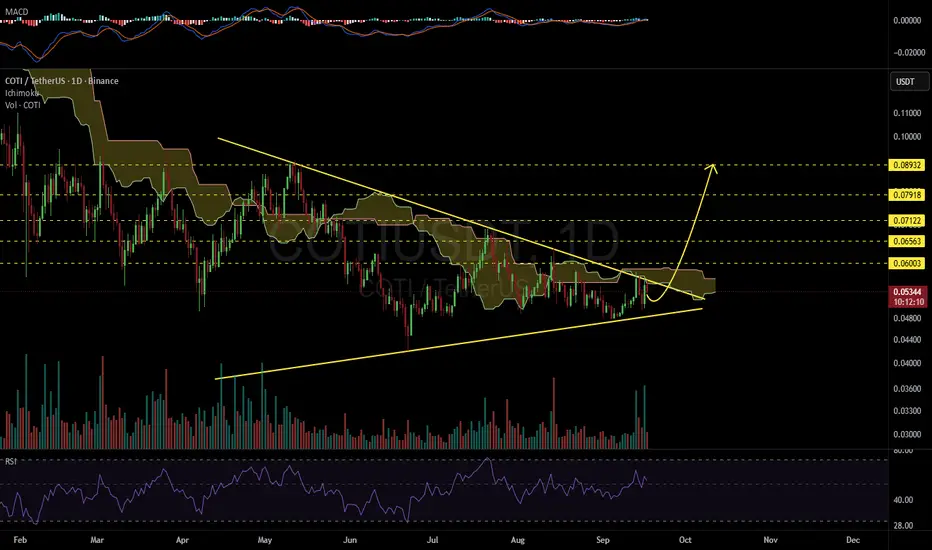
COTIUSDT 1D#COTI is moving within a symmetrical triangle on the daily chart and is currently facing both the Ichimoku cloud and the triangle resistance. If it breaks out above both, the potential targets are:
🎯 $0.06003
🎯 $0.06563
🎯 $0.07122
🎯 $0.07918
🎯 $0.08932
⚠️ Always remember to use a tight stop-loss a
Coti/Usdt10x - 100x opportunity for COTI this year. For my opinion very undervalued project. Good luck Coti

COTI/USDT 4H Technical OutlookOn the 4-hour chart, key support and resistance levels have been identified. S1 and S2 mark the downside areas where buyers may step in, providing potential rebound zones. R1 and R2 highlight the upside resistance barriers, where sellers could apply pressure or profit-taking may occur. These zones w

COTIUSDT – One Bullet, Not All-InThe blue box looks like a solid area to risk 1R — but let’s keep our feet on the ground.
This isn’t about predicting tops or bottoms. It’s about testing structure with confirmation.
🟦 A single, well-managed attempt is okay — but in case a Q3 correction kicks in, this setup could still get stopped

See all ideas
Summarizing what the indicators are suggesting.
Oscillators
Neutral
SellBuy
Strong sellStrong buy
Strong sellSellNeutralBuyStrong buy
Oscillators
Neutral
SellBuy
Strong sellStrong buy
Strong sellSellNeutralBuyStrong buy
Summary
Neutral
SellBuy
Strong sellStrong buy
Strong sellSellNeutralBuyStrong buy
Summary
Neutral
SellBuy
Strong sellStrong buy
Strong sellSellNeutralBuyStrong buy
Summary
Neutral
SellBuy
Strong sellStrong buy
Strong sellSellNeutralBuyStrong buy
Moving Averages
Neutral
SellBuy
Strong sellStrong buy
Strong sellSellNeutralBuyStrong buy
Moving Averages
Neutral
SellBuy
Strong sellStrong buy
Strong sellSellNeutralBuyStrong buy
Displays a symbol's price movements over previous years to identify recurring trends.