TradeCity Pro | CRV Testing Key Support Zone for Trend Reversal👋 Welcome to TradeCity Pro!
In this analysis, I will be reviewing the CRV coin, one of the popular DEXs, with a market cap of $954 million, currently ranked 81 on CoinMarketCap.
📅 Daily Timeframe
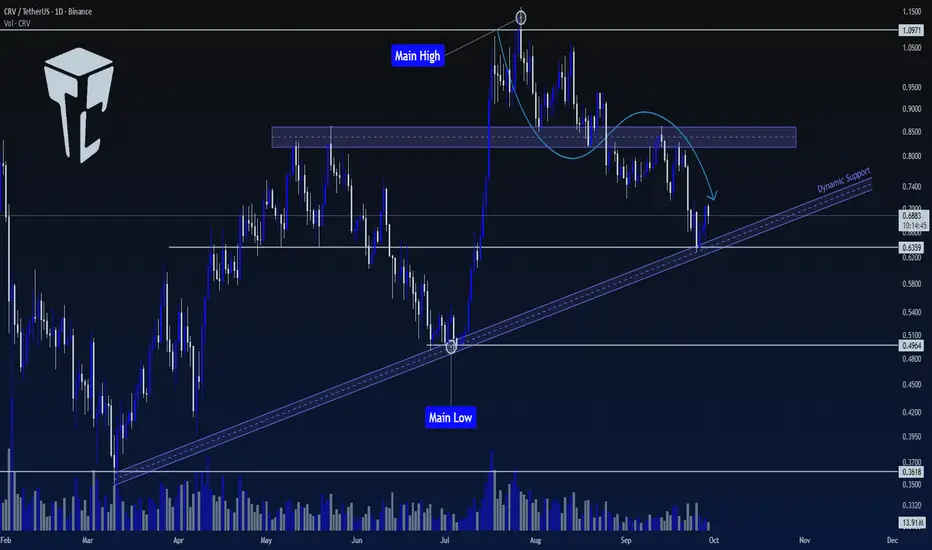
In the daily timeframe, this coin is in an uptrend with a trendline, and the price has currently reached it.
🔍 In higher cycles, the trend of this coin is bullish. However, in lower cycles, after being rejected from 1.0971, a downward movement has started, and it has corrected to the 0.6359 level.
✔️ This level is currently overlapping with the trendline and forms an important support zone.
✨ If this PRZ zone breaks, we can confirm the bearish reversal for CRV, and a short position can be opened. This trigger is one of the first signals for a trend change, and the main trend change will be confirmed after breaking 0.4964.
📈 For a long position, we will have to wait until a proper bullish structure is formed. If the price moves sharply, we will confirm the bullish trend after stabilization above the zone.
❌ Disclaimer ❌
Trading futures is highly risky and dangerous. If you're not an expert, these triggers may not be suitable for you. You should first learn risk and capital management. You can also use the educational content from this channel.
Finally, these triggers reflect my personal opinions on price action, and the market may move completely against this analysis. So, do your own research before opening any position.
CRVUSDT.P trade ideas
CRV/USDT: Range Breakdown Targets 0.57CRV/USDT: Range Breakdown Targets 0.57
Price broke out of type of range between 0.707 (resistance) and 0.674 (support).
Now, it is testing the lower side of the range, showing weakness. CRV can take a small pause in this area to reflect a bit more before it takes a clear downward movement..
If the breakdown continues, the first quick target is 0.6500.
Further bearish targets are 0.6350, 0.6000, and 0.5700.
As long as price stays below the red range zone, the bias remains bearish.
You may find more details in the chart!
Thank you and Good Luck!
❤️PS: Please support with a like or comment if you find this analysis useful for your trading day❤️

CRV 1D Analysis - Key Triggers Ahead☃️ Welcome to the cryptos winter , I hope you’ve started your day well.
⏰ We’re analyzing CRV on the 1-Day timeframe .
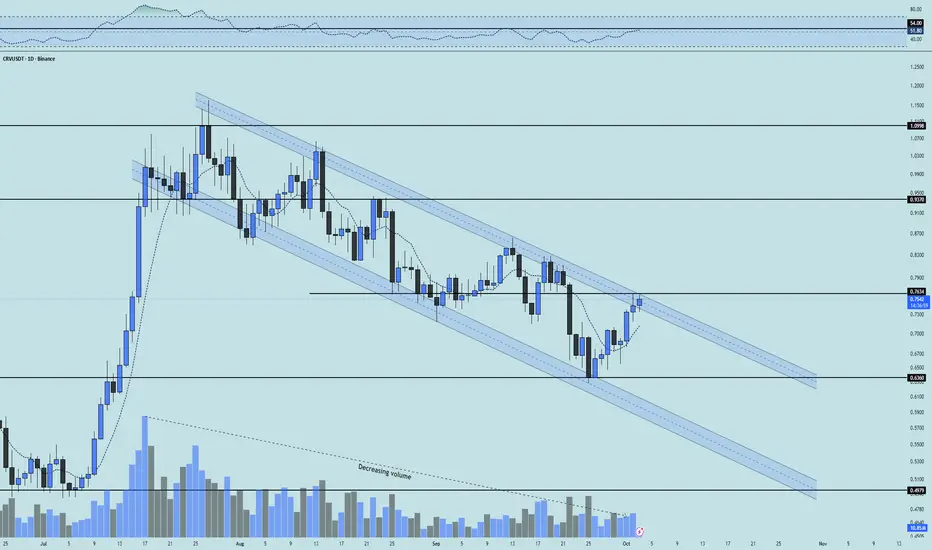
👀 On the daily timeframe for CRV, we can see that after a strong rally, the coin entered a corrective descending channel. Now there are signs of a potential breakout from this channel on this timeframe. If the channel’s upper boundary is broken — which overlaps with the key resistance at 0.7634 — we can say a new bullish trend is starting for this coin. That would mean it’s leaving this compression and correction phase and forming a new upward structure. On the USDT pair, CRV has already managed to build a higher low, and on the BTC pair, it is also gaining momentum for a move. This coin can be added to your watchlist for trading opportunities.
🧮 Looking at the RSI oscillator, after a long period fluctuating below the 50 zone, it is now heading toward its resistance near 54. If RSI pushes through this level, it could break that oscillation resistance and continue higher.
🕯 Since the start of the correction, trading volume has declined, but some long-term holders are still keeping this coin and adding more. These informed buyers may resume accumulation once the descending channel is broken. Pay attention: with an increase in volume, this coin could experience a sharp rally. Recent candles also show stronger buying pressure compared to earlier ones.
💸 On the BINANCE:CRVBTC trading pair, we see a similar descending channel as the USDT pair. If the descending channel breaks on the USDT chart, a similar breakout could occur here, drawing whale attention and fueling a pump with strong growth potential for CRV. A major resistance lies at 629 on this pair; breaking that level would significantly increase the chance of a channel breakout and a strong upward move.
🧠 For trading this coin, a long scenario exists: if the CRV/BTC pair breaks resistance, strong buying volume could flow into CRV. On the USDT pair, if the channel top is broken, with a daily candle close above the prior day’s wick and RSI confirming above 54, a new bullish structure could form for this coin.
❤️ Disclaimer : This analysis is purely based on my personal opinion and I only trade if the stated triggers are activated .
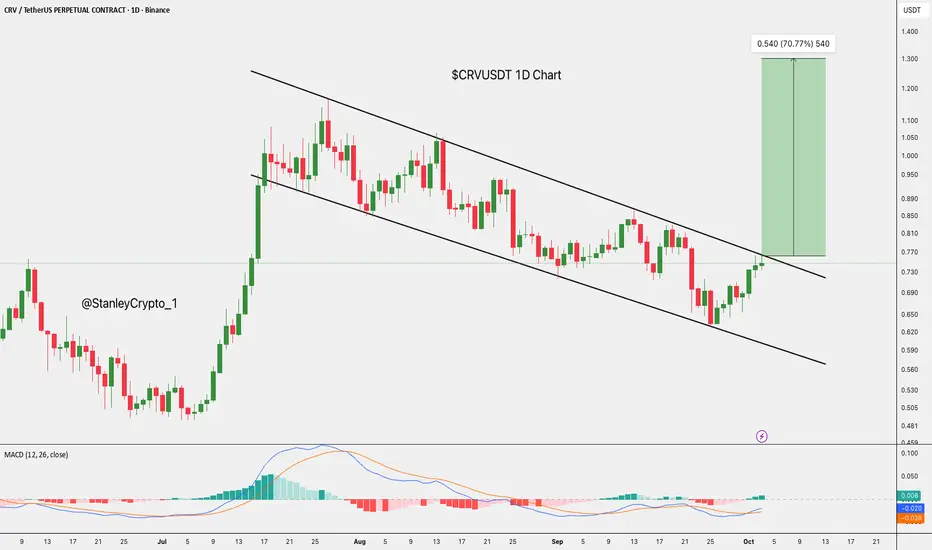
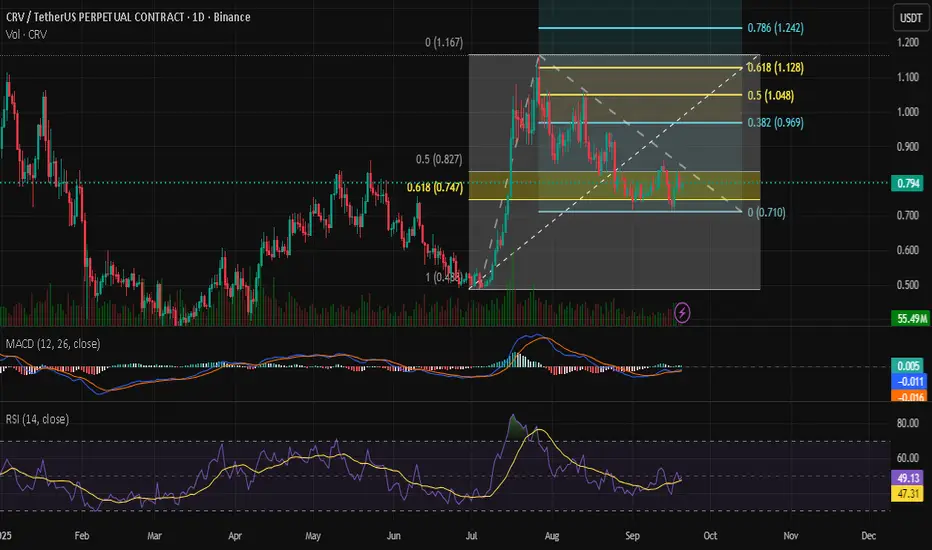
$CRVUSDT Ready to Breakout: 70% Rally Potential Ahead.CRYPTOCAP:CRV is currently testing the top of a descending channel at 0.774.
If it breaks through this level, we could see a 70% rally towards 1.312.
The MACD is showing signs of momentum, so there's a good chance for a bullish move ahead.
DYOR, NFA
CRV/USDT — Descending Channel: Reversal or Another Rejection?📊 Market Overview
Curve DAO Token (CRV) is currently standing at a critical juncture after spending several months moving inside a well-defined descending channel since early August.
This channel has consistently reflected sustained selling pressure — yet recent momentum shows buyers pushing back, testing the upper boundary of the channel, and signaling a potential shift in short-term trend dynamics.
At the moment, CRV is retesting the key resistance zone between 0.79 and 0.82 USDT, aligning with the upper boundary of the descending channel — a classic decision zone that will likely define whether the next move is a breakout or another rejection.
📈 Technical Structure & Pattern Explanation
Main pattern: Descending Channel
The structure reflects a sequence of lower highs and lower lows, contained within parallel boundaries, forming a clear bearish trend channel.
Technical validation:
Multiple touches on both upper and lower boundaries confirm strong technical respect for the pattern — making it a reliable setup.
Key horizontal levels (based on the chart):
Immediate support: 0.7970
Major resistance zones: 0.8233 → 0.9369 → 1.0000 → 1.0404 → 1.0951
High level: 1.1626
Mid-channel support: 0.64–0.70
Lower boundary: 0.55–0.60
Major structural low: 0.4893
🔥 Bullish Scenario – Breakout and Early Reversal Setup
Bullish narrative:
If CRV successfully breaks and closes a daily candle above 0.8233, it would signal a clear breakout from the descending channel — potentially marking the early stage of a trend reversal after months of downside pressure.
Confirmation checklist:
Rising volume during breakout.
RSI breaking above 50 and trending toward 60–70.
MACD showing a bullish crossover with positive histogram growth.
Upside targets after breakout:
First target: 0.9369 – minor resistance & initial breakout confirmation zone.
Second target: 1.0404 – key psychological and historical resistance.
Extended target: 1.0951 → 1.1626 – if momentum remains strong.
Trading plan & risk management:
Aggressive entry: on daily close above 0.82.
Conservative entry: wait for a retest of the upper channel as support (~0.80).
Stop loss: below 0.74–0.75 (failed breakout zone).
Take profit gradually at the levels mentioned above.
Bullish conclusion:
A confirmed breakout with strong volume could signal the transition from a medium-term downtrend to a neutral or bullish recovery phase.
⚠️ Bearish Scenario – Rejection and Continuation of the Downtrend
Bearish narrative:
If CRV fails to close above the upper trendline and faces rejection near 0.80–0.82, the descending channel remains intact — confirming that sellers still dominate the market structure.
Confirmation checklist:
Bearish candlestick formations (e.g., bearish engulfing, shooting star) near upper trendline.
Weak volume on approach to resistance.
RSI fails to cross 50 and turns downward again.
Downside targets:
First target: mid-channel area ~0.66–0.70.
Second target: lower boundary 0.55–0.60.
Final support: 0.4893 – major structural low.
Trading plan & risk management:
Entry short after confirmed rejection candle.
Stop loss above 0.85–0.90 (outside the channel).
Take profit at mid- and lower-channel zones.
Bearish conclusion:
As long as CRV remains below 0.82 and continues to respect the descending channel, the bearish structure of lower highs and lower lows remains valid.
🔍 Overall Technical Summary
The descending channel defines CRV’s structure clearly — it’s now testing the most crucial point of that formation.
A daily close above 0.8233 could trigger a trend reversal, while a rejection would extend the downtrend.
Momentum and volume confirmation will be key in determining which path unfolds next.
#CRV #CRVUSDT #CurveDAO #TechnicalAnalysis #CryptoAnalysis #DescendingChannel #BreakoutTrading #ChartPattern #CryptoTrading #PriceAction #CryptoMarket

$CRV long position OPENED @ $0.797 - reasoning (1-D)Okay so I have gotten myself into a LONG position on CRYPTOCAP:CRV after watching it for weeks waiting for this FALLING WEDGE breakout on the DAILY.
I finally got what I wanted, the breakout happened last Friday, but I didn't wanna enter when the CRYPTOCAP:BTC dominance was strong, and now it's not.
As for the chart itself, OBV has been flat while the price was declining inside the wedge, which means that holders have NOT been getting rid of their bags en masse. Commitment to the project.
RSI has been making EQUAL highs and only slightly LOWER lows while the price was in a DOWNTREND. Bullish divergences, mild ones but still BULLISH.
This trade doesn't have a perfect set-up but I took it because I think the WEDGE breakout is very likely to hit its target at $1.05 and flush accumulated LIQUIDATIONS right above (up to $1.12, see the attached HEATMAP).
STOP LOSS placed 3% below the (green line) 200 MA in order to avoid a wick down liquidation.
Lower timeframes later on today, a LOT is happening today💙👽

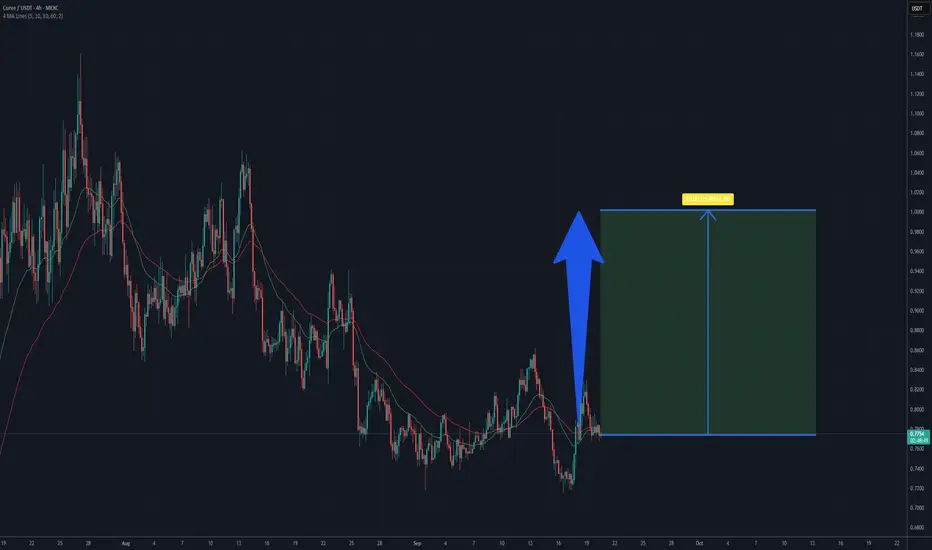
CRV / USDT : One strong move will start Massive rallyCRV is breaking out from trend line resistance. A confirmed breakout with strong momentum can open the way for a rally towards $1.00 – $1.15.
Keep a close watch, wait for confirmation, and manage risk wisely.

CRVUSDT UPDATE#CRV
UPDATE
CRV Technical Setup
Pattern: Bullish falling wedge breakout
Current Price: $0.7729
Target Price: $1.07
Target % Gain: 40.20%
CRYPTOCAP:CRV is breaking out of a falling wedge pattern on the 1D timeframe. The breakout signals renewed bullish strength with potential upside toward $1.07, offering around 40% gains. The structure supports a continuation move higher. Always use proper risk management.
Time Frame: 1D
Risk Management Tip: Always use proper risk management.

CRV/USDTCRV remains one of the OG DeFi plays on the market. With altcoin season approaching, price action is showing clear compression. Over the next ~200 days, I’m anticipating a breakout, with technicals pointing toward a $2 target, roughly 177% upside from current levels.

70 day channel wound upHasn't been in accumulation for very long, but it has swiftly exited that 2024 range and entered a very strong uptrend.
On the 4H price is currently testing the upper line of the channel. If BTC tops out soon ~140k, plenty of liquidity will be here to pump this to $1.9.
I buy spot here, no leverage.

CRV/USDTBINANCE:CRVUSDT completed its breakout and retest.
All that’s left now for CRV is to hold above the upper channel boundary at $0.7544 and see some volume coming in — it’s looking good.


$CRV (1-D): LONG ($0.797) in-play, a bit BLOODY though (UPDATE)Not a great start for my CRYPTOCAP:CRV LONG ($0.797 entry yesterday) mainly due to the US markets correction today, I believe.
There is a lot of support above my STOP LOSS ($0.695) including a GOLDEN POCKET support, a nicely curved-up 200 MA and a 2-month long, falling trendline (upper trendline of the FALLING WEDGE that broke out last Friday).
So the position seems fine, as long as there is no massive crash in the markets, it should be safe.
On this updated DAILY chart I applied one of my secret weapons, the bottom pane. It has flipped BULLISH again, and have a look at the two previous instances when that happened.
I wonder how many of you guys can guess what the indicator is (not MACD). Massive respect if you answer correctly💙👽


The #1 Bearish Chart PatternThere is something so powerful;
about technical analysis
that's very hard to put together
but once you do piece them together
you will begin to see the power of it
Tracking the price for
these alt coins
has been the best hing
i have ever witnessed.
Seeing the pennant bearish
price pattern
Has been something
i didn't think i would
see
This stuff is starting to get
more and more clear the more
i study about it.
Studying about the reversal pattern
is like reverse psychology
It gives you
the advantage in the market
Because?
Because everyone wants
a bullish signal when
the market is bullish
every one wants a bearish signal
when the market is bearish.
No one wants a correction.
No one wants the reversal.
Think about it how many
times have you seen a sucker
and you know deep down in your heart
that sucker
wont make it
Now imagine a sucker
that makes it in life.
That what this reversal pattern
is all about my man
this is what separates you
from the crowd
because you have hope that one
day that loser guy
you see will make it
think of the buy signal as
the potential you see in that loser
guy friend of yours
You have seen the potential but
no one around
you has..you have seen
it using the buy signal
now you see a big potential
he finally tells you he has made it
because you saw the potential in him
a long time ago and now
he is thanking you for seeing
this potential in him
and vows to help you
with hand outs if you will
ever need one.
That's what this correction is all about
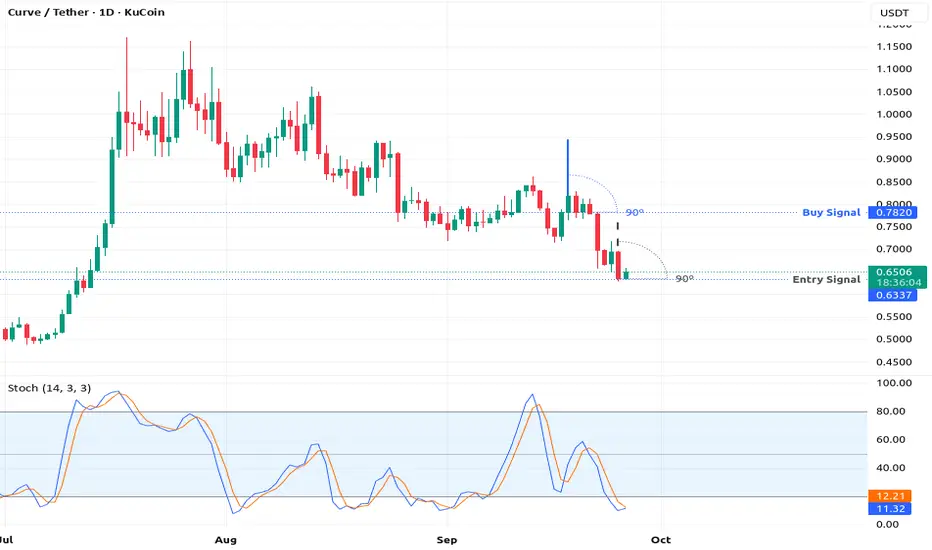
Notice the angles
there all 90 degrees
this chart pattern is
called the pennant bearish pattern
i got it form Steve Nison's book
on Japanese candlestick patterns.
Thats where i first saw
this pattern.
Patterns are important .
If you want to learn more check
out the resources below.
Rocket boost this content to learn more.
Disclaimer:Trading is risky please learn risk
management and profit
taking strategies.Also
feel free to use a simulation trading account
before you trade with real money.
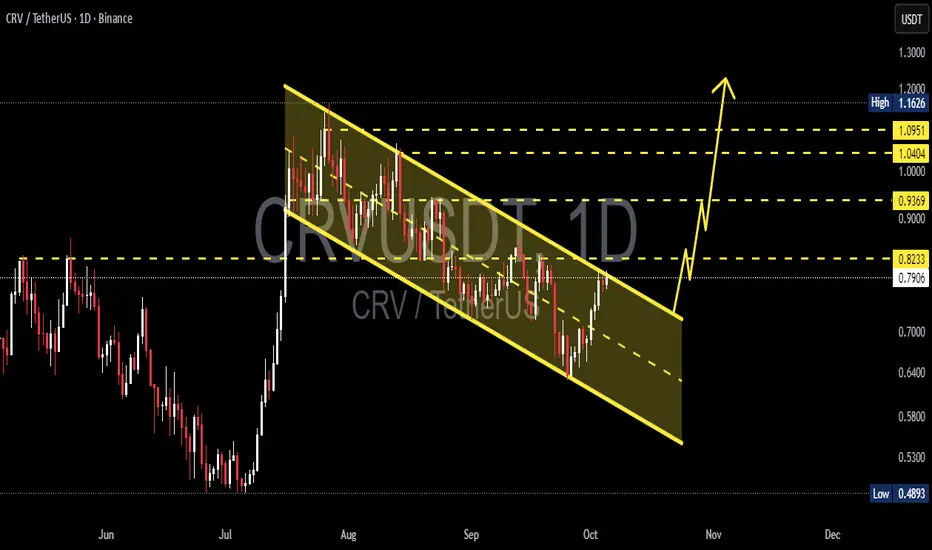
CurveCrv usdt daily analysis
Time frame daily
Risk rewards ratio >3.2 👈👈
Target 1.12$
Crv is dropping smoothly after it's powefull pump
You can see that crv is in the two downtrend yellow lines
If crv can break this famous pattern, with a good news in crypto market my analysis will happen

$CRV (1-day): I'm LONGING @ $0.797 CRYPTOCAP:CRV I'm longing @ $0.797.
Details incoming within an hour or so.
FALLING WEDGE breakout
STOP LOSS: below the 200 SMA 💙👽

CRV break outafter a break Crv is looking to see upside.
the downside of this token is no more, just search and enter your trading zone. it is bullish

My Opinion on CRV cryptocurrenciesWith Fibonacci Extension, I found potential that the price have high possibility to go higher to price 1usdt. But this is just my opinion, this is not financial advice, PLEASE DO YOUR OWN RESEARCH
Is it a time for CRVUSDT. 30% potential target 1 $
On the 4-hour Curve/USDT chart the market shows a period of sideways consolidation after a recent rebound from the 0.72 USD area. Price is hovering around 0.77 USD, moving in a relatively tight range and testing both short-term moving averages.
The shorter moving average has started to flatten and occasionally crosses above the longer one, a sign that selling momentum is easing. At the same time, the longer moving average still trends slightly downward, so the broader picture remains neutral to mildly bearish until a clear break higher occurs.
A key support zone is visible around 0.74–0.75 USD, where several pullbacks have recently been absorbed. Above current levels, the first notable resistance lies near 0.80 USD, followed by a wider supply zone around 0.86–0.88 USD that previously capped upward moves. A sustained close above those levels, especially with rising trading volume, would indicate strengthening bullish pressure.
Overall, the chart reflects a market that is stabilizing after a decline, with early signs that buyers are trying to build momentum. Further confirmation from price closing above the identified resistance areas and a continued uptick in volume would improve the outlook for additional upward movement.
Potential TP: 1 $
The 13 EMA System On Re- Entry (Swing Trading)So am sitting on my computer desk.
Trying to register my publishing business..
then it hit me man.
Its more affordable to start a business
than to get a driving license.
So which one would you do?
Would you start a business or get a driving
license?
Starting a business is something
i wish i did in my younger days.
Those days i had so much imagination
and no guidance on how to monetise
my ideas.
Starting this publishing business
is something am so proud of myself by.
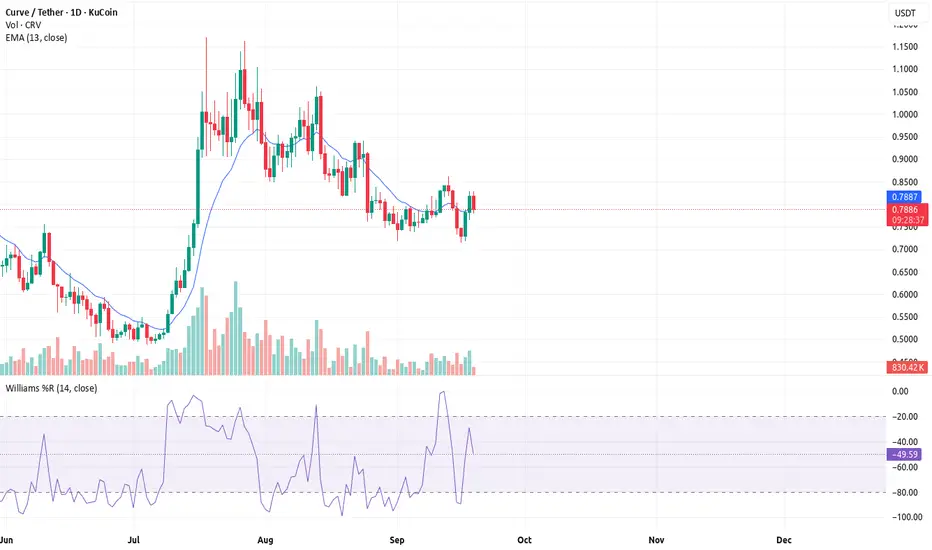
Now look at this chart KUCOIN:CRVUSDT
you will see something called a failure swing.
What is a failure swing?
This is the break even point or the re entry signal.
Dont get sacred of this
its a sign that the next bullish move in KUCOIN:CRVUSDT
is going to be huge!!
Am using the William %R to see this swing
because its my favourite indicator..
Which indicator do you use to see the failure swing?
Do you think this is where the name
swing trading comes from?
If you remember on the last idea
i told you i saw a dragonfly doji as an entry
This failure swing signal is the icing on the cake.
Trade safe.
Rocket boost this content to learn more
Disclaimer:Trading is risky please learn risk managment
and profit taking strategies.Also feel free to use
a simulation trading account before you trade with real money.
CRVUSDT 1D#CRV is moving inside a falling wedge pattern on the daily chart. Currently, it has bounced nicely from the daily EMA200 and is on the verge of breaking out above the wedge resistance and the daily SMA50. Keep an eye on it. If it happens, the potential targets are:
🎯 $0.8762
🎯 $0.9744
🎯 $1.0538
🎯 $1.1331
🎯 $1.2461
⚠️ Always remember to use a tight stop-loss and follow proper risk management.
