The recent upward move shows decreasing momentumCRV/USDT Long: Targeting a move to $0.4150 after breaking key resistance around $0.3920.
Reason: Confirmed Resistance-Turns-Support (RTS) pattern, offering a high-probability entry near the retest.
Confirmation: The breakout was backed by above-average volume and a surge in bullish momentum.

TradeCityPro | CRV in a Key Zone: Watch for Breakouts or Drops👋 Welcome to TradeCity Pro!
Let’s dive into the CRV coin analysis. It's one of the popular DeFi projects, with a market cap of $608 million, currently ranked 89th on CoinMarketCap.
⏳ 4-Hour Timeframe
On the 4-hour timeframe, this coin is currently sitting on a very important support level and has j

CRVUSDT 8H#CRV is moving inside a descending channel on the 8H timeframe and is currently facing the Ichimoku cloud. You can buy a small bag near the support zones shown on the chart. In case of a breakout above both the channel resistance and the Ichimoku cloud, the potential targets are:
🎯 $0.5062
🎯 $0.549

CRV spot long to 6$CRV is again at the bottom of the range. Buying a spot bag towards 6$. Long term trade. Keep it simple. Comparing the following charts: (longterm) ETH will outperform BTC, XRP will outperform ETH and CRV will outperform XRP. Buy and chill. Looking for impulsive elliot waves for more confirmation

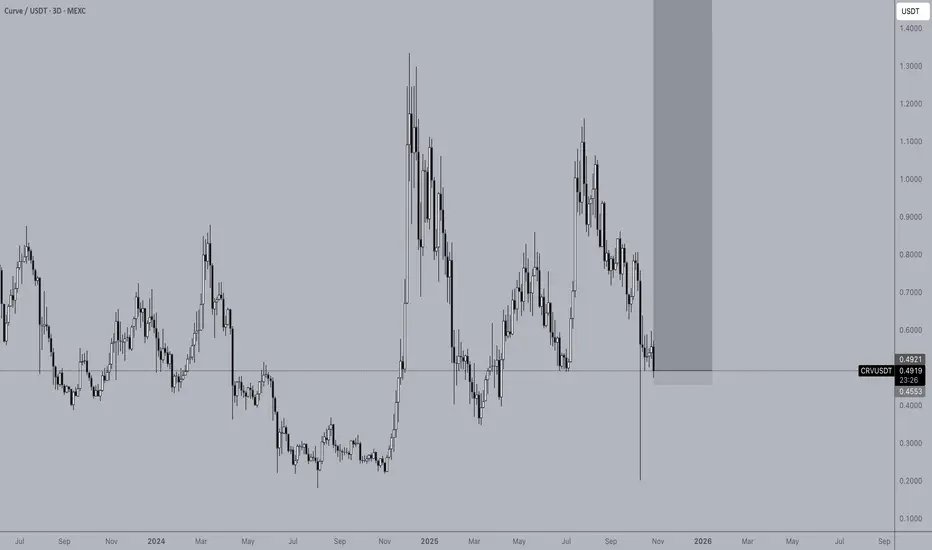
CRV/USDT — Major Reversal Incoming or the Next Breakdown?CRV is now sitting at one of its most critical price levels of the entire year.
Price has returned to the 0.42–0.37 support zone, an area that has acted as a last major defense for buyers throughout multiple months.
At the same time, the chart shows a clear downward trendline pressing the price fro

#CRV/USDT breakout alert!#CRV
The price is moving within an ascending channel on the 1-hour timeframe and is adhering to it well. It is poised to break out strongly and retest the channel.
We have a downtrend line on the RSI indicator that is about to break and retest, which supports the upward move.
There is a key suppo

#CRV/USDT#CRV
The price is moving within a descending channel on the 1-hour frame, adhering well to it, and is heading for a strong breakout and retest.
We are experiencing a rebound from the lower boundary of the descending channel, which is support at 0.6600.
We are experiencing a downtrend on the RSI in

CRVI really like how HOSE:CRV has formed a descending channel outside of the symmetrical triangle pattern. This structure suggests it’s preparing for a strong move to the upside before reclaiming. The setup points to a potential 350% gain from current levels once momentum kicks in.

CRV BULLISHRetest is confirmed .
Chart looks great .
I think this is the right time for investments.

Bottom is in.CRV bullish till 6$. leveraged position here maxxing.
6$ full target will scale multiple targets during the not so long road.
See all ideas
Summarizing what the indicators are suggesting.
Oscillators
Neutral
SellBuy
Strong sellStrong buy
Strong sellSellNeutralBuyStrong buy
Oscillators
Neutral
SellBuy
Strong sellStrong buy
Strong sellSellNeutralBuyStrong buy
Summary
Neutral
SellBuy
Strong sellStrong buy
Strong sellSellNeutralBuyStrong buy
Summary
Neutral
SellBuy
Strong sellStrong buy
Strong sellSellNeutralBuyStrong buy
Summary
Neutral
SellBuy
Strong sellStrong buy
Strong sellSellNeutralBuyStrong buy
Moving Averages
Neutral
SellBuy
Strong sellStrong buy
Strong sellSellNeutralBuyStrong buy
Moving Averages
Neutral
SellBuy
Strong sellStrong buy
Strong sellSellNeutralBuyStrong buy
Displays a symbol's price movements over previous years to identify recurring trends.