ETH.D (Ethereum Dominance) Weekly TF 2025
Summary:
Ethereum Dominance (ETH.D) has likely bottomed after retracing to its 78.6% Fibonacci level (~6.59%) and is showing early signs of a structural reversal. With institutional inflows, growing staking adoption, and key upcoming Ethereum upgrades, ETH.D may reclaim significant market dominan
Key data points
Previous close
—
Open
—
Day's range
—
About Market Cap ETH Dominance, %
Coin
Born only a few years ago in 2015, Ethereum has grown into an established blockchain with an even more established native coin. Some might think it's all just hype, but the chart we've prepared here says otherwise — it displays Ethereum's dominance over the whole crypto market (the ratio of ETH market cap to the cumulative crypto market cap). If the line goes up, ETH is rising in value against other coins, and it might be a sign for you to reconsider your portfolio decisions. If it goes down, well, up to you what to do with that.

Eth dominance Eth going back to 4800 very soon dominance is about to break to the upside Macd divergence and looks bullish to me we will see eth pump again

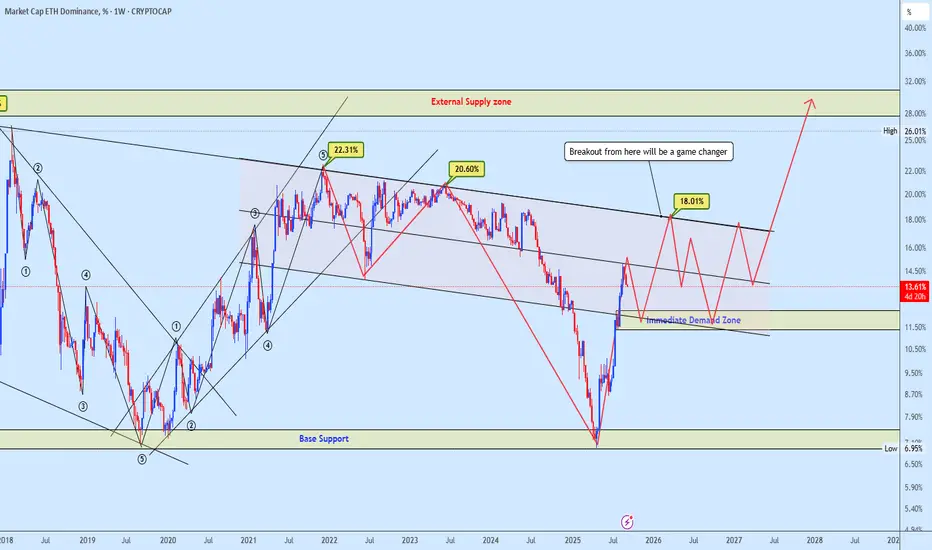
ETH Dominance Game Changing Levels AheadETH dominance has been climbing strongly from the base support and is now approaching the immediate demand zone that should act as a key structure for the next big move.
A breakout above the channel resistance around 18%–20% will be a real game changer, opening the path towards the external supply
$ETHBTC rolling over. $ETH.D in uptrend. $SOL.D looks bullishWhat is happening in the Altcoin universe ? Is Altcoin season in? CRYPTOCAP:ETH and CRYPTOCAP:SOL are the best indicators of the overall sentiment in the Crypto market. Altcoin season usually starts when BINANCE:ETHBTC and CRYPTOCAP:ETH.D both bottoms out. That happened in April. Since then

Alt season time (PART 1)Hello friends
Well, the question that has come up a lot for you these days is the alt season or its beginning.
Well, you see the Ethereum dominance chart that the candle closed well on the weekly time frame, but on the daily time frame, if the price holds the 14.20 area and the 14.85 resistance is

ETH Taking Over the Market – 20% Dominance in SightEthereum dominance is surging towards its all-time high of 20%! 🚀
I remain bullish on CRYPTOCAP:ETH and expect it to break $5,000 in the coming weeks — unless Bitcoin
decides to make a deep pullback. ⚡️
⏳ Not yet the time to buy! Follow me and I’ll tell you the exact entry for Ethereum. Don’t

Altseason Checklist! To spot the beginning of an Altseason, there are several key charts you need to track on TradingView. These indicators show whether capital is really leaving Bitcoin and flowing into altcoins.
1. Altseason Starts with ETH
Almost every time, the first signs come from Ethereum (ETH). When ETH gains
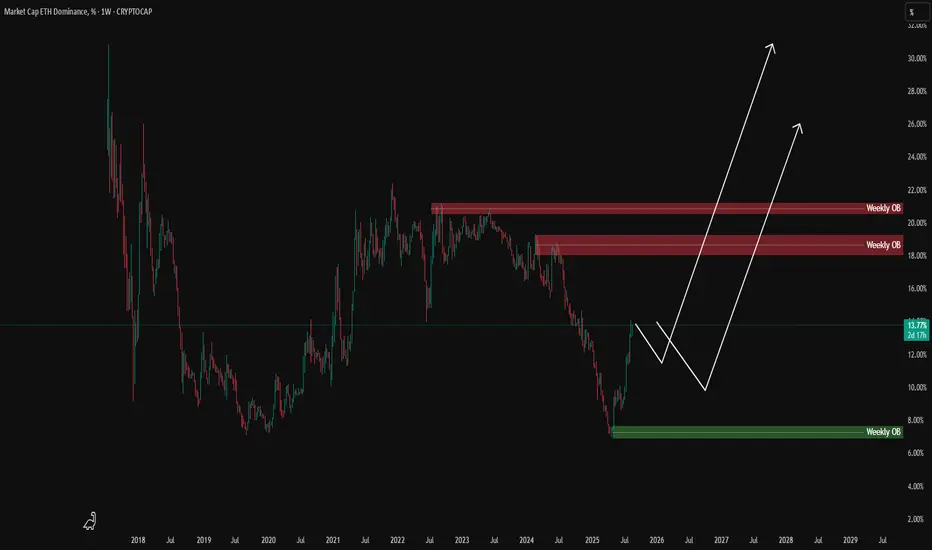
ETH.D : 5-Wave Bull Run Over –Bitcoin to Outshine EthereumeEthereum Dominance (ETH.D) has completed a textbook 5-wave impulsive rally on the weekly timeframe, signaling the end of its upward cycle and entry into a deep corrective phase. As of August , ETH.D at 13.37% is rejecting the key order block at ~14%, hinting at weakening momentum. This shift favors

This Ethereum SeasonThis Ethereum Season
Ethereum Dominance / Bitcoin Dominance
CRYPTOCAP:ETH.D / CRYPTOCAP:BTC.D

Balding Ape Sports Car Club AltSZN Indicatorthis is when alts rip using the Moonboys Money Line we can see 96% alts go weeeee

See all ideas
Summarizing what the indicators are suggesting.
Oscillators
Neutral
SellBuy
Strong sellStrong buy
Strong sellSellNeutralBuyStrong buy
Oscillators
Neutral
SellBuy
Strong sellStrong buy
Strong sellSellNeutralBuyStrong buy
Summary
Neutral
SellBuy
Strong sellStrong buy
Strong sellSellNeutralBuyStrong buy
Summary
Neutral
SellBuy
Strong sellStrong buy
Strong sellSellNeutralBuyStrong buy
Summary
Neutral
SellBuy
Strong sellStrong buy
Strong sellSellNeutralBuyStrong buy
Moving Averages
Neutral
SellBuy
Strong sellStrong buy
Strong sellSellNeutralBuyStrong buy
Moving Averages
Neutral
SellBuy
Strong sellStrong buy
Strong sellSellNeutralBuyStrong buy
Displays a symbol's price movements over previous years to identify recurring trends.