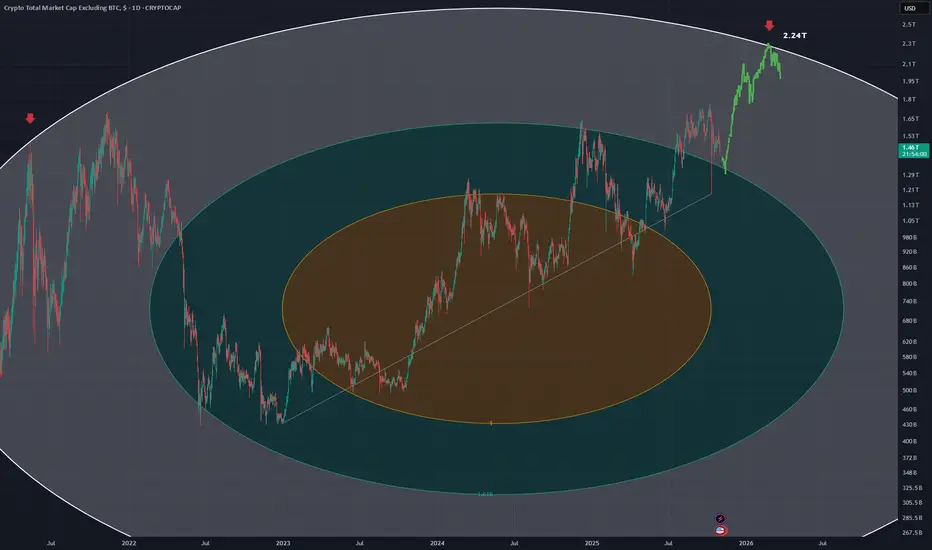
TOTAL2 - Fib CircleUsing a fib circle with a trend from the start of the current bullrun
Looking for another top along 2.618 which can be seen to be a previous top for the last bull run in may 2021 (red down arrows)
Still a fair amount of room to move up for alt coins
This is the daily chart for TOTAL2
Key data points
Previous close
—
Open
—
Day's range
—
About Crypto Total Market Cap Excluding BTC, $
Bitcoin is quite a heavy-weight fighter which makes it difficult at times to correctly define how the crypto market is doing — it just outshines other coins, and you can't see clearly. Since Bitcoin presents such a huge piece of the crypto pie, excluding it from counting sounds reasonable and lets you see a more clear picture of where the crypto market is moving at the moment. That is what you can see on the chart we've prepared — calculated by TradingView, it displays global crypto market cap without Bitcoin's share.
TOTAL2 - It is ComingThis is the three month chart for TOTAL2 (the altcoin market cap)
Right now we are at the stage where we can experience massive increases in prices across the board for alts.
RSI will form a W like structure.
Hopefully someone will be able to call it altszn soon
Alts like XRP has already experienc

TOTAL2 Elliot Wave BREAKOUT ALERT - Altseason Incoming ? TOTAL2 Elliott Wave BREAKOUT ALERT: Altseason Incoming? 🚀📈
Alright, folks—checking in on the TOTAL2 chart (total crypto market cap excluding Bitcoin) as of Sep 27, 2025. We're sitting at about 1.155T USD after a 6.93% dip.
I've been diving into Elliott Wave Theory here, and it's painting a pretty

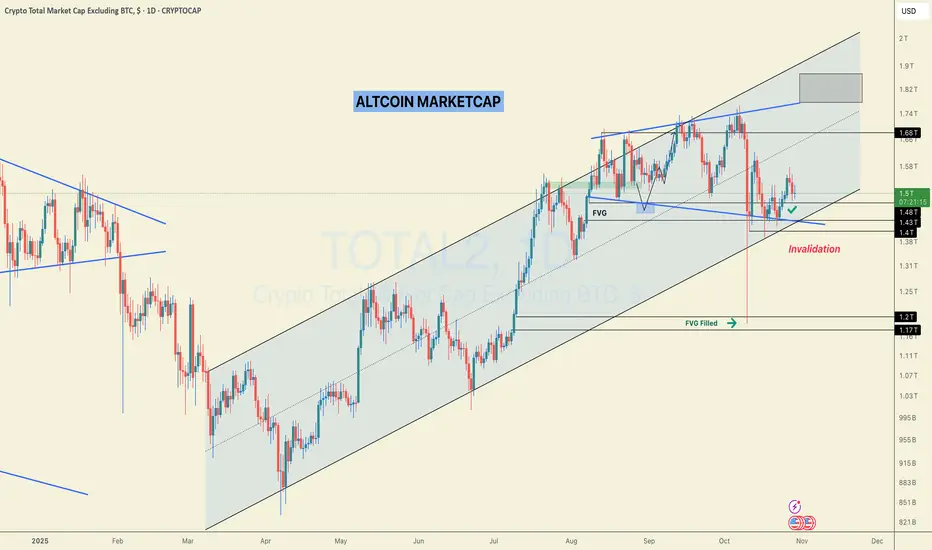
#TOTAL 2: ALTCOIN MARKETCAP! It's not Over!Altcoin Market Cap: The recent crash has filled the daily FVG. The $2T level remains the target, with invalidation below $1.43T.
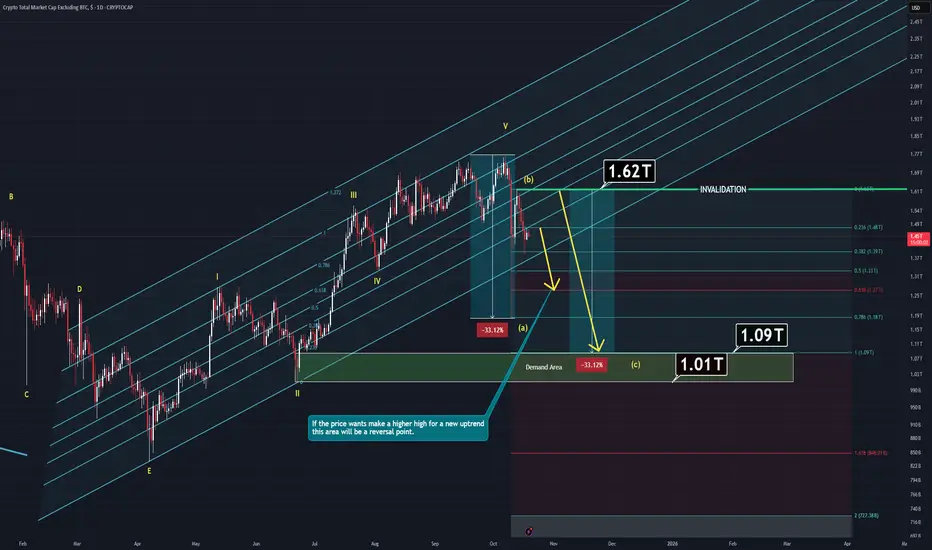
TOTAL 2 Analysis (1D)Total 2 has started its correction wave known as A-B-C but there are much to consider:
Main component of Total 2 is ETH and we'll need to dive into that so the chart would make sense.
-Companies like Bitmine keep buying ETH but they don't actually own it yet.
Specifically, Ethereum treasury compan
Alts marketcap Update
After a long days of bearish on market and altcoins now recovering nice panda fam check out our Alts marketcap 👁🗨
We are currently sitting at the crucial S/R keylevel area at 1.27T if alts marketcap manage to stay above 1.27T support keylevel and create a sideways for possible next bounce then No

$TOTAL2 failed breakout. $BTC.D higher. Altcoins look weak.After the Oct 10th liquidation event in the crypto markets has left a significant mark in the overall Crypto markets. After the 16 Bn $ liquidation the momentum in the Altcoins has been broken and the Bitcoin Dominance has started its upward journey. In this space I have always maintained my positio
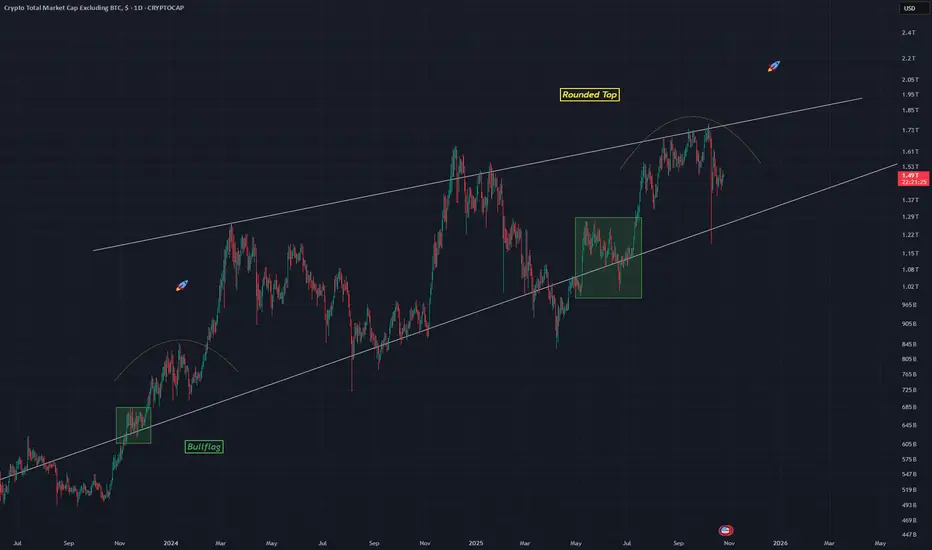
TOTAL2 - Triangle Leading to Breakout I think this large structure in white is an ascending triangle
Comparable patterns in green and yellow curved line, with one showing bullflag and the other a rounded top. Both bullish patterns.
This is the Daily chart
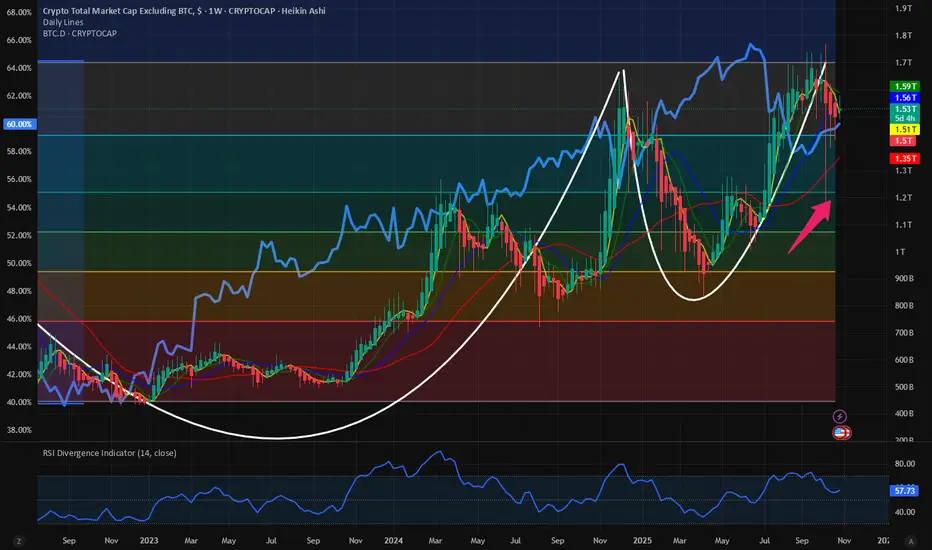
Total2 \ AltcoinsTotal2 HTF is also forming a strong reversal pattern.
The fall trend breakout and retracement process have been completed, with the price holding steady above MA21 and the uptrend.
The 2021 ATH region has still not been breached, but the current structure is at the beginning of a new expansion pha

TOTAL 2 ROAD MAPTotal 2 will start its upward move, but it will do so through a series of corrections along the way.

See all ideas
Summarizing what the indicators are suggesting.
Oscillators
Neutral
SellBuy
Strong sellStrong buy
Strong sellSellNeutralBuyStrong buy
Oscillators
Neutral
SellBuy
Strong sellStrong buy
Strong sellSellNeutralBuyStrong buy
Summary
Neutral
SellBuy
Strong sellStrong buy
Strong sellSellNeutralBuyStrong buy
Summary
Neutral
SellBuy
Strong sellStrong buy
Strong sellSellNeutralBuyStrong buy
Summary
Neutral
SellBuy
Strong sellStrong buy
Strong sellSellNeutralBuyStrong buy
Moving Averages
Neutral
SellBuy
Strong sellStrong buy
Strong sellSellNeutralBuyStrong buy
Moving Averages
Neutral
SellBuy
Strong sellStrong buy
Strong sellSellNeutralBuyStrong buy
Displays a symbol's price movements over previous years to identify recurring trends.