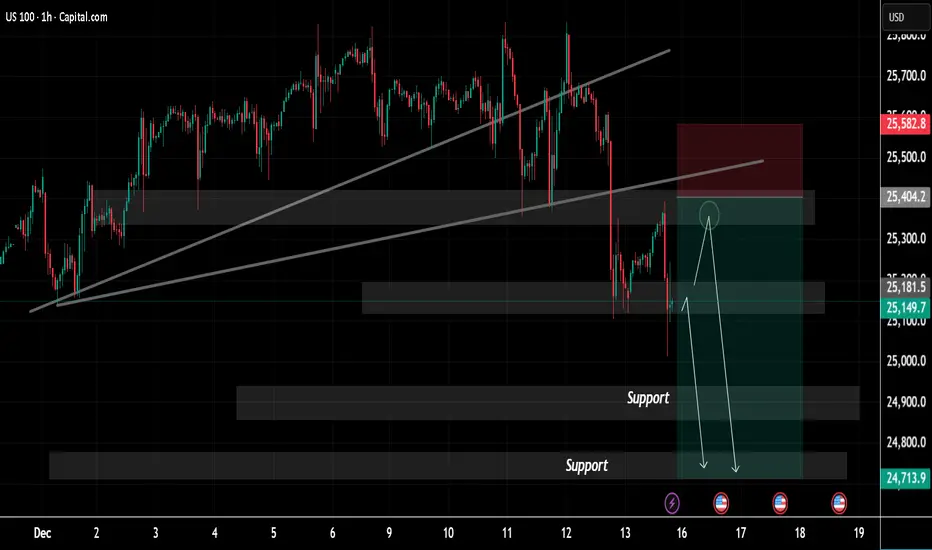
USNAS100 Price Update Clean Clear ExplanationUS100 on the 1-hour timeframe, highlighting a shift in market structure from bullish to bearish Price was previously moving within an ascending channel, respecting higher highs and higher low a strong bearish breakdown occurred, with price decisively breaking below the rising trendline, indicating a
Related indices
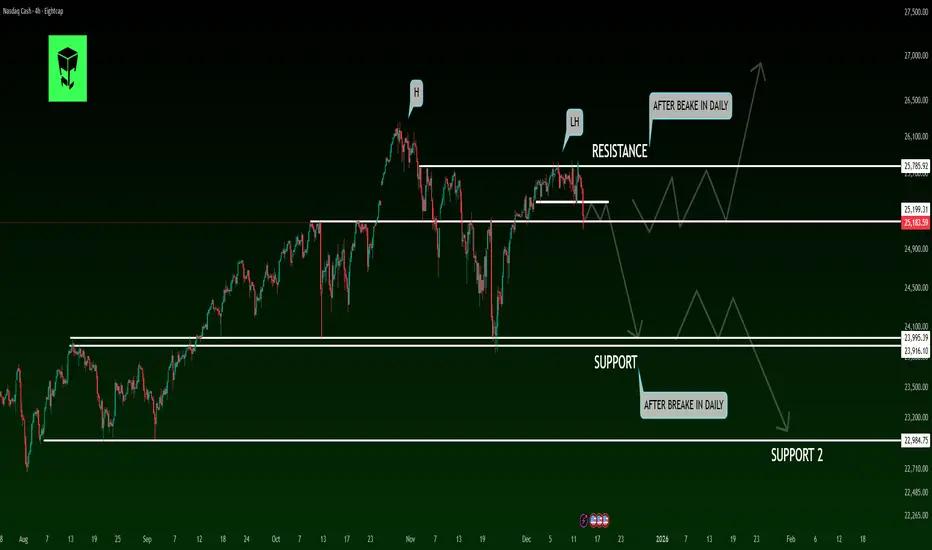
Nasdaq-100: Lower Low and Lower High?The Nasdaq-100 made a lower low, and now it might have made a lower high.
The first pattern on today’s chart is the November 21 low of 23,854, some 353 points below the October trough. That broke a series of higher lows since April.
Second, the tech-heavy index peaked at 25,835 on December 10. Tha

NAS100 Looking to continue HigherPrice is trading within a broader bullish environment. Notice where price is sitting now. Right above support, right above the rising trendline.
After the recent push up, price pulled back into the zone that aligns perfectly with the Golden pocket on the Fibonacci retracement. This level can act as

Nasdaq: To bleed or not to bleed?
STRUCTURE CONTEXT:
Strength Context: Sellers Dominating
RSI Divergence: Present
Control Variant: Sellers Have Full Control
EMA Confluence: 400EMA Reversion
Balance Context: Bearish
Psychology Levels: $24,000 and $25,000
STRUCTURE ANALYSIS:
For the last 10 months we have seen a constant rise in

Calm Before the Storm?A Potential Crash Is Forming in US STOCKSHello, I hope you're doing well today. We are going to analyze the Nasdaq index together. The Nasdaq is one of the key U.S. stock indices and consistently offers promising trading opportunities. If you're ready, let's dive into the analysis.
Timeframe: 4H / Daily
🔍 Market Structure Overview
After

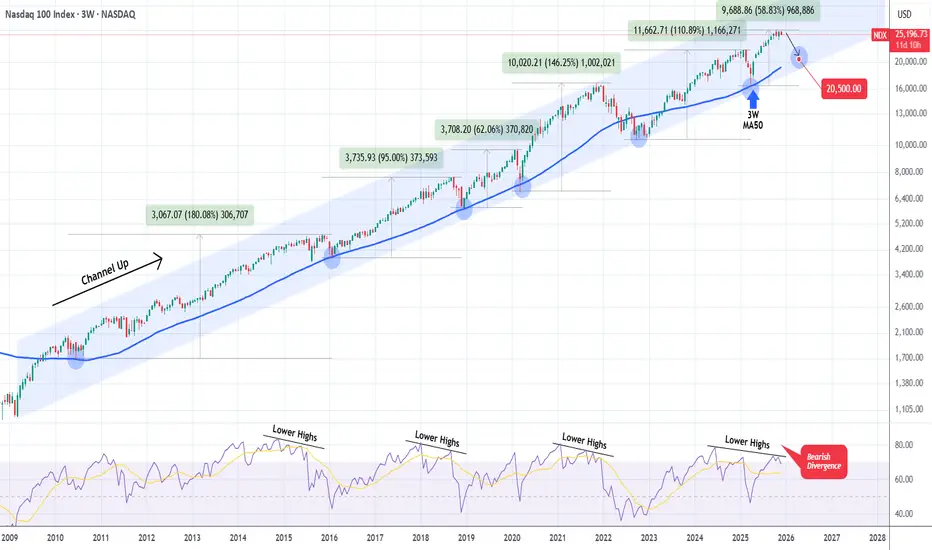
NASDAQ Time to correct hard until it reaches this level again.Exactly 6 months ago (June 20, see chart below), we posted the following analysis on Nasdaq (NDX), which helped us ride the rally following the April 07 2025 market low:
The reasoning behind this was that Nasdaq's low was on its 3W MA50 (blue trend-line), a key Support level which since 2009 an
BUY STOP (NAS100) - SWING TRADEEish, I do not want to talk much. Just set a buy stop, hold the trade to 27000. Swing trade for the next 3 weeks. Take partial profits on the way up. This is money for your January.
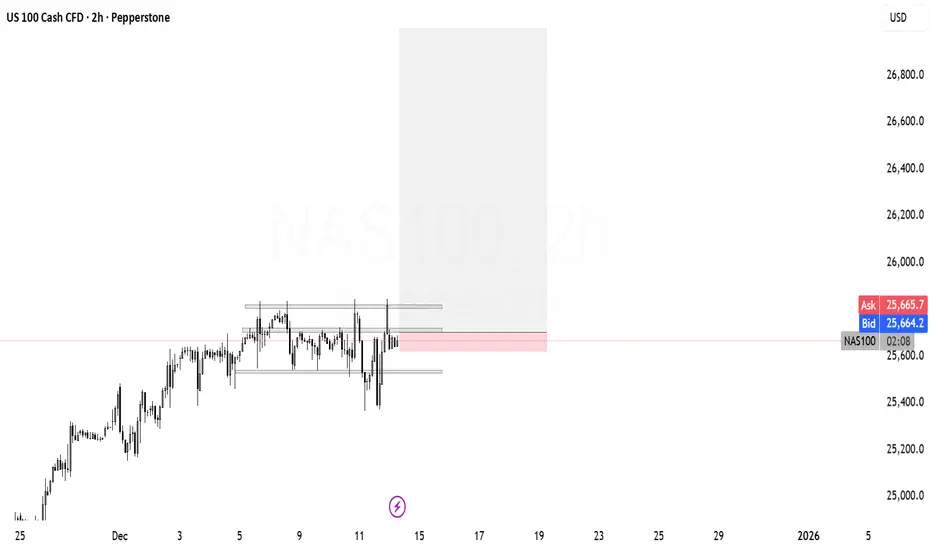
US100 intraday overviewThis is a simple market overview based on basic price action.
Sharing my personal view, not financial advice.

NASDAQ SHORT VERY BEARISHTri-star doji printed, a rare and strong reversal pattern - extremely bearish.

See all ideas
Displays a symbol's value movements over previous years to identify recurring trends.