DASHUSD idea / outlookDash is currently under the major trendline,
yet is forming a similar pattern (1)
I believe price will come up and sit above 2.618 (just below the major trendline)
And then smash through the trendline (as indicated by the bars pattern)
Trade ideas

DASHUSD Entry Price Fibonacci Retracement 38.2% (Price 131.427)DASHUSD Target Price 110.000
Confluence and Entry Area
Close Price 126.977
EMA 10 Close Price 130.819
EMA 20 Close Price 136.319
Fibonacci Retracement Level 38.2% (Price 131.427)
July 12, 2021

ECT paving the way for DASH to $5600 I love finding leaders and lagers and this seems like a perfect example. Its easy to see the similarities in these charts- they're not exactly the same but wow are they close. The last time I noticed something like this BTC had just hit 20k while ETH was still at $500 (see below). Just like BTC was leading the way then; it looks like ECT might be leading DASH (& others) now. The ball's in your court.
There are a few way to tackle this trade;
Entry 1: here $125 - $131
Stop 1: tight $124.5 or loose $120 depending on how aggressive you want to be
Entry 2: on retest of breakout
Stop 2: below the retest pivot
Entry 3: on a test of the lower trend line
Stop 3: below the pivot at the trend line or on the break and close below trend line
Entry 4: on retest of breakout
Stop 4: below the retest pivot
Target for all of the above at your own discretion. I'm treating this as an entry for a longer term position; so I'm holding it for much higher prices.
Trade ideas:
BTC leading ETH:
Never Trust. Verify.
D.Y.O.R . Not Financial Advice, this is my trading journal.
Always remember: Technical Analysis is not about being right, it's about increasing your odds.
Be prepared to be wrong. Risk management is key . Capital preservation above all else.

DASH: Swing Trade EntryDASH/USD Swing Trade with a 136.4 entry point. I'm using this chart to track the trajectory.
I regularly seek out the most lucrative cryptocurrency swing trades available on all the major exchanges.
My win rates are between 80-85%.
All my charts are clean, straightforward, and easy to follow.
* Not financial advice. Trade at your own risk.


DASHGood ole boring DASH tested support $121 multiple times, trying to count the V complex EW ABC WXY count seems kinda a watse of time, I am just going to my TA roots here to see that soon we test $145 resistance, from there we should get an impulsive count 12345 IMO

DASH/USD (100 Dollars Strong Support?)💎Technical Analysis Summary💎
DASH/USD
-The 100 dollar range has been a key area of interest of DASH
-We can see multiple reactions in this zone since 2017
-If DASH can hold the price above 100 dollars
-Expect a good bounce up action will happen in the coming months
-Perhaps if the overall market condition is in good shape
-The chances to retest the 500 dollars increases too
-For now, let us wait for a few weeks if the bulls can form a support
-Good luck traders! :)
⚠️Please always read the description⚠️
Thanks for donating 💰 via Tradingview coins bitcoinpam 🙏🎉
``````````````````````````````````````````````
If you need help🙋 don't hesitate to
Send me a message here PolarHusk 😊
``````````````````````````````````````````````
Trading Involves High Risk ⚠️
Not Financial Advice 💸
Exercise Proper Risk Management 💱
``````````````````````````````````````````````

DASHUSD to 200? MaybeFalling wedge currently attempting to put in a higher low at a high volume node. With a reversal here, we could see a target of 200 on a 75 dollar breakout. Targets should be 170, 185, and 205. Stop-losses need to be kept tight, still in a downtrend

Why? Do you have a problem with DASH at $10k+ by 2023?I hope this is clear enough for you all.
I also have the stream that you can see my thought patterns when we look at the DASH
__REVIEW__
-----------------
I would say this was a solid TA :)
additionally a stream about DASH -- Skip some 10 mins maybe or so as i was getting started
www.tradingview.com
Fractals are quickly set up, accuracy is within acceptable error range.
**LEGENDS**
BLUE = Bear/Resistance || Yellow = Bull/ Support
Lines: Fractal dates are moments of interest, where price and time collide to create oscillation.
the chart for possible scenarios of price actions - use zoom and scroll for better view.~
/*This information is not a recommendation to buy or sell. It is to be used for educational purposes only.*/
Feel free to request: your coin to be analyzed! Please keep those Stop losses in place or mind!
Thank you, and stay strong my fellow CryptoPunks!
Future belongs to the brave, and crypto is the future.
_Ajion

Dash to $200 this week Sideways consolidation is set for a big move to the upside. I see dash usually increases all at once.

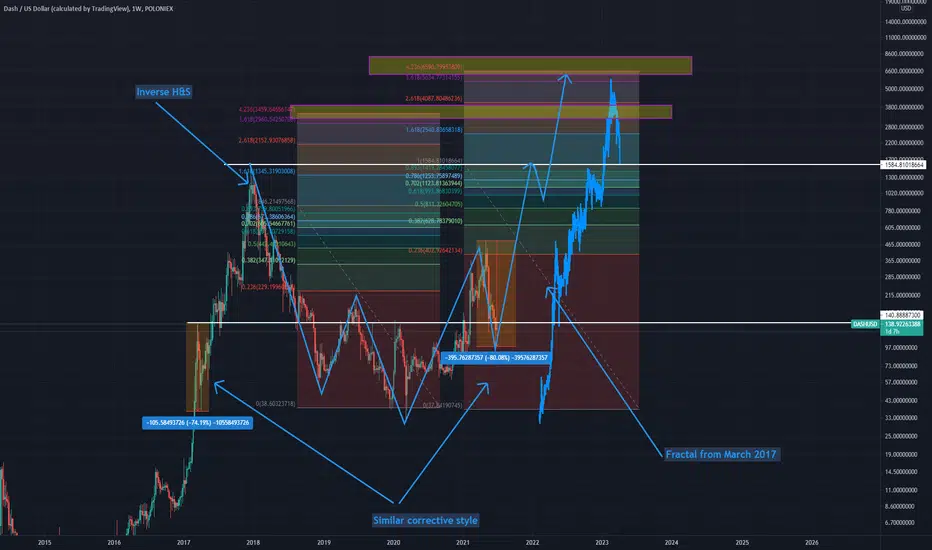
Signs that show DASH has long ways to go !!!Dash had a 74% correction in 2017 before its last leg in the bull run ,In 2021 we're seeing very similar things playing out with a massive 80% corrections .
But looking out at the grand schemes of things Dash doesn't look all that bad !!!
Looking at the bear market of 2018-2020 ,we can clearly see a inverse Head and Shoulder forming.
Dash is lagging behind in this market cycle as it has still not reached out to its major fib retracements levels i.e 0.618/0.702/0.786
But Dash is very near to its 2017 March Peak which has acted as a level of S/R and break of this S/R would clear the picture very well and I see a bullish break anytime soon based on the BTC position in this market cycle .
Dash is very far from its 2017 peak and based on the fib extension from the top to bottom we get a target of about 6500usd .But before that using the rally prior to BTC capitulation placing the 0.236 fib extension on it ,
we get a target of about 3500usd which may act as a hurdle and that could be the top of this market cycle for dash but break of it would lead dash to 6500usd.
Using the fractal from march 2017 Bull run ,we can see it extends to near full 4.236 fib extension levels.
Seeing the on-chain data of Bitcoin and rest of the crypto market as a whole , things look optimistic.
#NFA
#DYOR
Possible bottomMost recent bottom is at the 1.13 fib level with a deep candle shadow. Dojis and long reaching bottom shadows often find support. But not always )o: I like to place stop right under them though. It is like the bears fight so hard to take a security down, but they have "issues" at a certain level. The bulls will not give in to that level, for now anyway. The bulls fight back and bring price up from the long bottom wick/shadow.
Which would be a deep shark as a "regular" shark ends at the .886 on the CD leg.
The only 2 harmonic patterns that have peak 2 above peak 1 are the cypher and the shark. The shark has 2 versions, the deep shark, and the regular shark. The cypher terminates at the .786, so this is not a cypher.
Until BTC and ETH straighten out, this could be a crap shoot.
Just looks like a possible bottom but may be me wanting it to be because I am invested in this coin.
No recommendation
Always look to the left (o:
No pocket pivot as of yet. This could go lower/just hoping not.

$DASH Correction Similarities Based on our prior 78% drop we saw a robust rally of over 1300%, will History repeat? Time will tell. :)

$DASH still within the trend channelAmazingly $DASH has tagged its mid cycle peak and stayed ABOVE the bottom of the trend channel, in spite of recent weakness in $BTC


$DASH CRASH? Or Buying Opportunity?NOTE: we successfully back tested the prior 2017 mid cycle peak to perfection. That peak was also followed by consolidation, yet went on to rally over 1200% after. Its also important to note that this has all been done within the confines of our weekly trend channel :)


Bullish Gartley With 4HR RSI Bullish Divergence If you can hold the zone between the 786 and 886 i wouldn't be surprised if you see a major pump back to the top half of our range here

DASHUSD ForecastDASHUSD falling at the H3, the nearest support is 145.132.
.
Khiwe
At this profile page, the shared analysis, ideas and also, the strategy of a chart belong to Khiwe with some being influenced. The technical set-ups are speculative, they are not guaranteed for accuracy or in completeness in the form of any content; -it is not to advice on financial markets. Please apply your own analysis and confirm it with price action.


hit first target and retest of neckline (h&s reversal)hit first target and retest of neckline for the h&s reversal/bottom. Next target 1600 area (ATH) 800% from here. Good luck guys

DASH dashing lower DASHUSDIt is beginning to sound like a broken record now, but we got to remain objective. The charts are quite clear that we are going lower, yet it remains to be seen how much lower in the short term anyway.
Fibonacci goals is in green, cancellation/setup rejection is in red. This is not some kind of financial advice for your portfolios, so do your own research and make your own decisions about your trading or investment related moves.

Dash (DASH) - June 16Hello?
Welcome, traders.
By "following", you can always get new information quickly.
Please also click "Like".
Have a good day.
-------------------------------------
(DASHUSD 1W Chart)
If the price holds above the 165.21626486 point, we expect the uptrend to continue.
(1D chart)
It needs to rise above the 197.43788317 point and find support to turn into an uptrend.
If it goes down, you should check to see if it finds support at the 143.62557443 point.
If possible, we recommend moving along the uptrend line (1).
If it falls from the 143.62557443 point, it enters the mid- to long-term investment area and it may take a long time to rise, so careful trading is required.
-------------------------------------
(DASHBTC 1W chart)
We should see if we can climb to the 0.005698-0.016067 section and form a box section.
To create a new rising wave, it must rise above the 0.016067-0.020848 section.
(1D chart)
If it goes down, you should check to see if it finds support in the 0.003742-0.004199 zone.
In order to turn into an uptrend, it needs to rise above the 0.005114 point and find support.
The downtrend is expected to continue until it deviates from the downtrend line (1).
However, if it rises above the 0.005698 point and finds support, I would expect it to break out of the downtrend line (1).
------------------------------------------
We recommend that you trade with your average unit price.
This is because, if the price is below your average unit price, whether it is in an uptrend or in a downtrend, there is a high possibility that you will not be able to get a big profit due to psychological burden.
The center of all trading starts with the average unit price at which you start trading.
If you ignore this, you may be trading in the wrong direction.
Therefore, it is important to find a way to lower the average unit price and adjust the proportion of the investment, ultimately allowing the funds corresponding to the profits to regenerate themselves.
------------------------------------------------------------ -----------------------------------------------------
** All indicators are lagging indicators.
Therefore, it is important to be aware that the indicator moves accordingly with the movement of price and volume.
However, for the sake of convenience, we are talking in reverse for the interpretation of the indicator.
** The wRSI_SR indicator is an indicator created by adding settings and options to the existing Stochastic RSI indicator.
Therefore, the interpretation is the same as the traditional Stochastic RSI indicator. (K, D line -> R, S line)
** The OBV indicator was re-created by applying a formula to the DepthHouse Trading indicator, an indicator disclosed by oh92. (Thanks for this.)
** See support, resistance, and abbreviation points.
** Support or resistance is based on the closing price of the 1D chart.
** All descriptions are for reference only and do not guarantee a profit or loss in investment.
Explanation of abbreviations displayed in the chart
R: A point or section of resistance that requires a response to preserve profits.
S-L : Stop Loss point or section
S: A point or section where you can buy to make a profit as a support point or section.
(Short-term Stop Loss can be said to be a point where profit and loss can be preserved or additional entry can be made through split trading. It is a short-term investment perspective.)
GAP refers to the difference in prices that occurred when the stock market, CME, and BAKKT exchanges were closed because they are not traded 24 hours a day.
G1 : Closing price when closed
G2: Opening price
(Example) Gap (G1-G2)
