deepusdt done liquidity sweep deepusdt have done liquidity sweep on last week
candlestick able close green on last friday.
potential bull in control for the current pricing.
may need some time to choose the direction
Trade ideas

DEEP/USDT — Critical Support Zone: Rebound or Breakdown?Currently, DEEP/USDT is testing a major support area around 0.110 – 0.131 USDT (yellow box). This zone has acted as a strong demand level several times in the past, making it the key decision point: will price rebound toward higher resistance levels, or will it break down and extend the bearish trend?
---
🔹 Price Structure & Pattern
Earlier this year, DEEP reached a high of 0.34498 before facing a sharp correction.
Since May, the chart has been moving in a sideways range, but with a clear pattern of lower highs — showing ongoing selling pressure.
The yellow box (0.110 – 0.131) represents the main demand/support zone. Whether price holds or breaks this zone will define the next major move.
---
✅ Bullish Scenario
If the support holds and price bounces:
Step-by-step upside targets:
1. 0.1767 → +35%
2. 0.2017 → +54%
3. 0.2228 → +70%
4. 0.3019 – 0.3428 → +130% from current levels
Bullish confirmation: a reversal candle (bullish engulfing / pin bar) with strong volume, or a daily close above 0.1767.
Strategy: Enter near support with a conservative SL below 0.095 to avoid fakeouts.
---
❌ Bearish Scenario
If support fails and the daily close drops below 0.110:
Immediate downside target: 0.0900
Extended breakdown may push price toward the 0.0457 major low.
Bearish confirmation: strong daily close below the yellow zone with high selling volume.
---
🎯 Conclusion
DEEP is at a make-or-break level. A rebound from support could trigger a rally of over +100%, while a breakdown might lead to a retest of its historical lows. Traders should wait for clear confirmation (candle + volume) before entering. Always apply strict risk management and avoid impulsive trades.
---
#DEEPUSDT #Altcoin #CryptoAnalysis #PriceAction #SupportResistance #TechnicalAnalysis #CryptoTrading

I BELIFE THIS ONE WILL GO TO THE MARSThe pattern of candles shows that it obviously tends to grow in this bull market

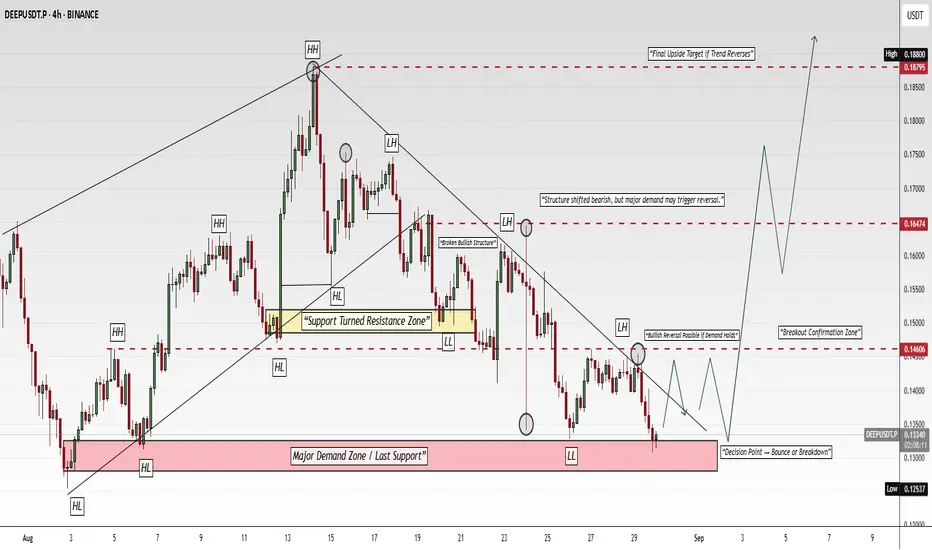
DEEPUSDT (4H) – Testing Last Demand Zone | GEM FOR SPOTBINANCE:DEEPUSDT.P
Structure | Trend | Key Reaction Zones
The market has shifted from a bullish structure (HH/HL) to a bearish one (LH/LL 📉). Price is now sitting inside the Major Demand Zone 🟢, which acts as the last strong support. A reversal is possible if buyers defend this level, while further downside remains open if it breaks.
Market Overview
After rejecting from 0.1880 liquidity zone 🔴, DEEPUSDT broke its bullish structure and has been trending lower with consecutive LHs. Now, the pair is testing the 0.1300–0.1250 demand area, a critical decision point where sentiment could flip. If buyers step in, we could see a relief rally toward 0.1460 and higher, but a breakdown would extend bearish pressure.
Key Scenarios
✅ Bullish Case 🚀 → Bounce from demand
🎯 Target 1: 0.1460 (breakout zone)
🎯 Target 2: 0.1640 (structural resistance)
🎯 Target 3: 0.1880 (liquidity zone / final upside)
❌ Bearish Case 📉 → Break below 0.1250
🎯 Target 1: 0.1200
🎯 Target 2: 0.1100
🎯 Target 3: 0.1000 (extended downside)
Current Levels to Watch
Resistance 🔴: 0.1460 – 0.1640 – 0.1880
Support 🟢: 0.1300 – 0.1250
⚠️ Disclaimer: This analysis is for educational purposes only. Not financial advice.
Buy Trade Strategy for DEEP: Advancing Blockchain Data Privacy Description:
This trading idea highlights DEEP, a cryptocurrency project focused on delivering advanced data privacy and secure communication solutions through blockchain technology. DEEP aims to empower users with tools that protect sensitive information, facilitate encrypted transactions, and ensure full control over personal data in a decentralized environment. As digital privacy concerns continue to grow globally, the demand for blockchain-based security solutions is expected to rise, potentially increasing DEEP’s adoption and utility across various sectors, including finance, healthcare, and enterprise communication.
Still, the cryptocurrency market is highly volatile, and factors such as regulatory actions, evolving competition, and changes in market sentiment can impact DEEP’s performance. While the project’s fundamentals are promising, investors should consider both its potential and its risks before entering a position.
Disclaimer:
This trading idea is for educational purposes only and should not be regarded as financial advice. Cryptocurrencies like DEEP involve high risk, including the possibility of losing your entire investment. Always conduct your own research, evaluate your risk tolerance, and seek professional financial advice before making investment decisions. Past performance is not indicative of future results.

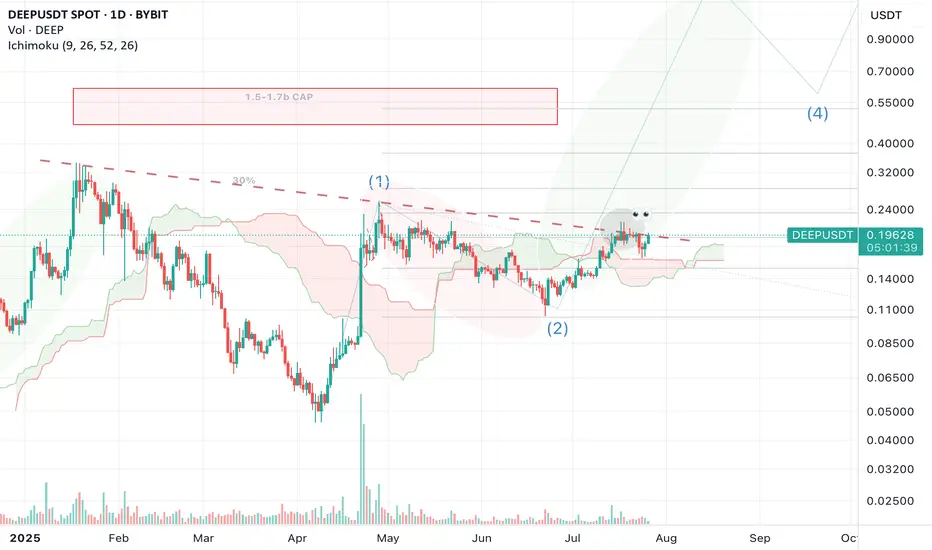
$DEEPIt's time to update the chart. It corrected for a few days, hit the Ichimoku Cloud support on the daily timeframe, and bounced back for an uptrend. If the market plays out well, I expect a nice pump. Let's see what happens!
Always DIOR ⚠
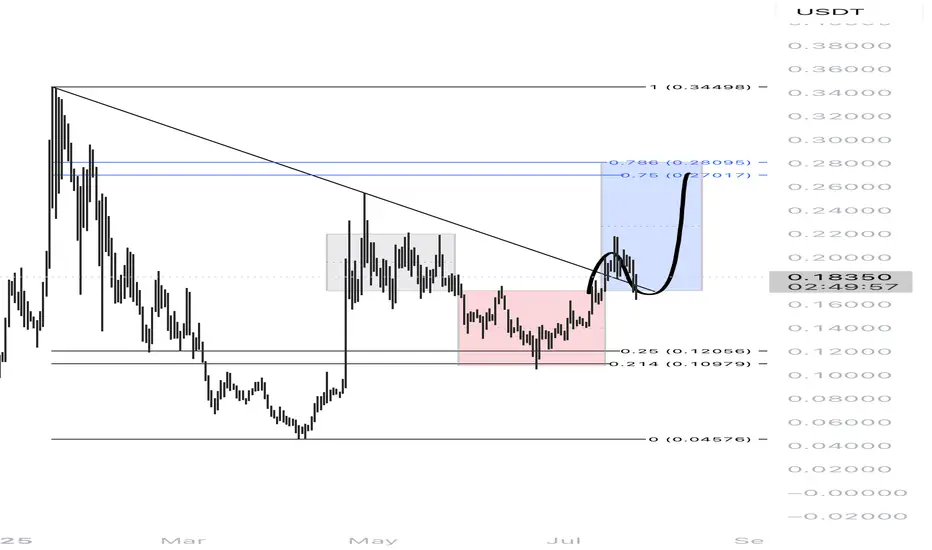
$DEEP - Possible +50% AMD breakout AMEX:DEEP is a legit utility project on CRYPTOCAP:SUI
Accumulation & manipulation already took place
Now looking at a distribution phase into the golden Fibonacci pocket.
Totaling a 50% move up approximately
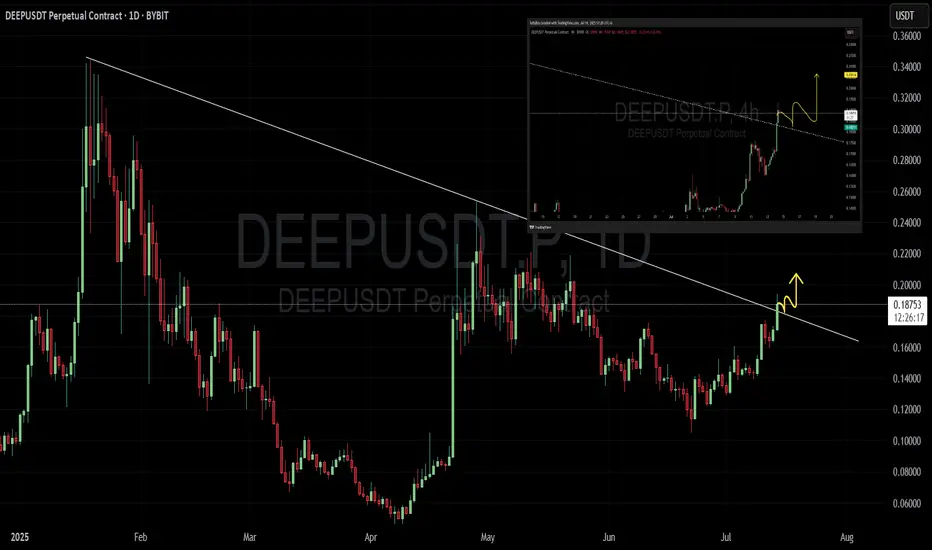
DEEP !! how deep will you retrace ?🚨 DEEPUSDT BREAKOUT ALERT 🚨
🔥 Price has broken the long-term downtrend on the 1D chart
🟢 Retesting the trendline near 0.182
📈 If it holds — we may see a strong pump ahead!
Chart shows strong momentum — watch for retest and ride the wave 🌊
— TuffyCalls Team ✅
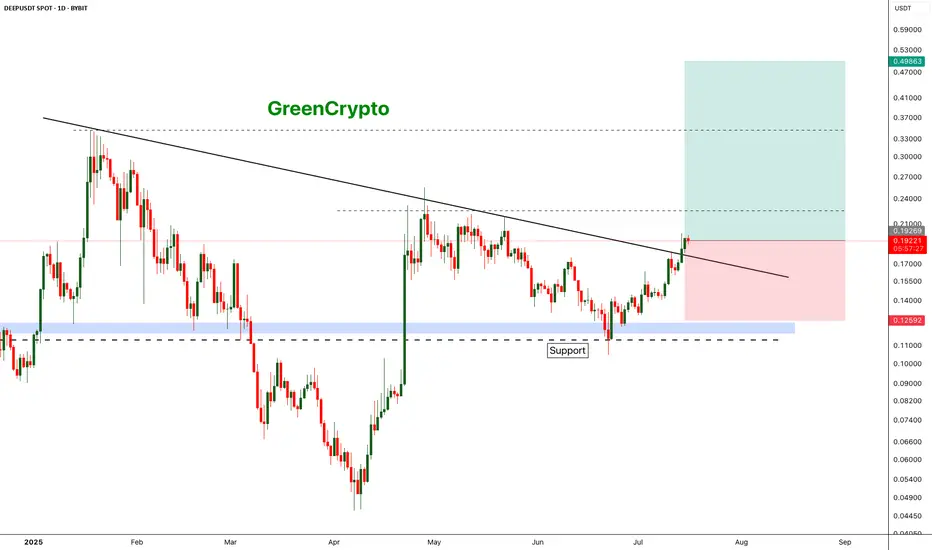
DEEP is deep Bullish DEEP has broken out from the resistance trend line and headed towards the next resistance around 0.22
We have good opportunity for a long trade here
Entry Price: 0.19219
Stop Loss: 0.12592
TP1: 0.22558
TP2: 0.27615
TP3: 0.34703
TP4: 0.49342
Don't forget to keep stop loss
Cheers
GreenCrypto
Breakout Alert: $DEEP Aiming for 80%+ If Resistance Flips$DEEP/USDT just broke out of a clean downtrend line and is now approaching a strong resistance zone around $0.22.
Momentum looks solid, and the breakout is backed by strong bullish candles.
If price can flip this zone into support, we might see a potential 80%+ move toward the $0.34–$0.35 region.
DYOR, NFA

DEEPUSDT Set to Skyrocket? Bullish Breakout from Falling Wedge
🧠 In-Depth Technical Analysis – 1D Timeframe
DEEPUSDT has just flashed one of the most powerful bullish signals in technical analysis — a confirmed breakout from a Falling Wedge pattern. This wedge has been forming over 4+ months (February to June 2025), suggesting long-term accumulation before a potential explosive rally.
A falling wedge is a classic bullish reversal pattern, where selling pressure diminishes over time, leading to a breakout fueled by renewed buying momentum — and that’s exactly what’s unfolding now.
📈 Bullish Scenario – Step-by-Step Upside Targets:
1. Confirmed Breakout
The descending trendline has been broken with a strong bullish candle and rising volume, indicating a possible trend reversal and start of a new bullish phase.
2. Fibonacci Extension Levels as Price Targets:
🎯 0.17260 – Initial resistance, serves as a key breakout retest zone.
💛 0.20910 (0.5 Fib) – First mid-range psychological target.
💛 0.23354 (0.618 Fib) – Crucial level to confirm bullish continuation.
⭐ 0.30209 – 0.31263 (1.0 Fib) – Primary take-profit target.
🔵 0.44059 (1.618 Fib) – Extended target if momentum remains strong.
🔴 0.64765 – 0.85470 (2.618 – 3.618 Fib) – Long-term targets in case of a parabolic altseason-like move.
3. Positive Market Structure:
Higher lows are forming, indicating a potential early-stage trend reversal. This structure is often seen at the beginning of major altcoin rallies.
⚠️ Bearish Scenario – Risks to Monitor:
1. Fakeout Risk:
If the price falls back below the wedge and loses the 0.14511 level, the breakout may turn into a bull trap.
2. Rejection at Key Fibonacci Levels:
Failure to break and hold above the 0.209 – 0.233 zone could trigger profit-taking and a retracement to 0.12000 or even 0.10000.
3. Failed Retest of Breakout:
If the price cannot successfully retest the wedge breakout zone, the bullish thesis may get invalidated.
🧩 Pattern Summary:
Pattern: Falling Wedge (Bullish Reversal)
Status: Breakout Confirmed
Potential Upside: Up to 0.85 USDT (Fib 3.618)
Key Support: 0.14511 & 0.12000
Bullish Confirmation Levels: Holding above 0.173 and breaking 0.233
#DEEPUSDT #CryptoBreakout #FallingWedge #BullishReversal #TechnicalAnalysis #AltcoinSetup #CryptoTrading #CryptoSignal #VolumeBreakout #AltseasonReady #DeepCryptoAnalysis

DEEPBOOK Spot Buy IdeaDEEP/USDT SPOT - 1D - BYBIT
Current Price: 0.14727 (Close)
24h Range: 0.13600 (Low) → 0.15582 (High)
Change: -5.47% (▼0.00853)
🔥 Extremely Bullish on DEEP!
Falling Wedge Pattern confirmed—breakout incoming!
If you’re not holding yet, consider buying at market price.
🎯 Targets:
First Target: $0.20 (Breakout confirmation)
Second Target: $0.25 (Mid-term resistance)
Final Target: $0.31 (Aggressive upside)
Follow me for more signals like this!

DEEPUSDT 4H#DEEP has broken out of the symmetrical triangle to the upside on the 4H timeframe. In case of a successful retest of the pattern, the targets are:
🎯 $0.21890
🎯 $0.23779
🎯 $0.25668
🎯 $0.28358
🎯 $0.31784
⚠️ Use a tight stop-loss.

DEEP 2H AnalysisHey traders! 👋
I’m watching a potential Wave 3 impulsive move forming on DEEP/USDT that could present a strong bullish opportunity. Let’s break it down 👇
🔹 Structure Overview:
We’ve completed a five-wave impulse upward (Wave 1 ✅), followed by an irregular corrective Wave 2 (ABC correction). This setup opens the door for a classic Elliott Wave 3, which tends to be the strongest leg in the sequence.
🟩 Entry Zone: 0.195 – 0.205
🎯 TP: 0.256
🛑 SL: 0.182
⚖️ Risk/Reward Ratio: 1:3
📌 Remember:
Take care of your risk and money management. Always size your positions according to your plan.
💬 What do you think? Does this count look solid to you, or are you seeing a different wave scenario? Drop your thoughts below ⬇️

DEEPUSDT.P - 1 H AnalysisWith CGI IndicatorDEEPUSDT.P - 1 H AnalysisWith CGI Indicator Short Position

Breaking: DeepBook Protocol ($DEEP) Surged 28% Amid Bullish FlagThe price DeepBook Protocol ( AMEX:DEEP ) token saw a notable uptick of 28% today amidst breaking out of a bullish flag pattern.
Built on the Sui blockchain, AMEX:DEEP coin has been on a bullish streak for the past 7 days with an uptick of 213.26% in 24 hours trading volume today. Similarly, the asset's market cap has risen 21.41% to reclaim the $700 million market cap.
As of the time of writing, AMEX:DEEP coin is up 6.23% trading within a bullish flag pattern. This altcoin has already broken the ceiling of the flag gearing for 80% surge.
About DeepBook Protocol
DeepBook is a decentralized central limit order book (CLOB) built on Sui. DeepBook leverages Sui's parallel execution and low transaction fees to bring a highly performant, low-latency exchange on chain. DeepBook’s main competitive edge is that it is fully on-chain.
DeepBook Protocol Price Data
The DeepBook Protocol price today is $0.234722 USD with a 24-hour trading volume of $465,843,629 USD. DeepBook Protocol is up 24.02% in the last 24 hours. The current CoinMarketCap ranking is #94, with a market cap of $717,779,555 USD. It has a circulating supply of 3,058,000,000 DEEP coins and a max. supply of 10,000,000,000 DEEP coins.

Bullish Reversal Setup from Demand Zone for DEEPDEEP is forming a potential bullish reversal setup after tapping into a well-established demand zone. Price action shows early signs of a rebound, suggesting a possible move toward the next supply/resistance zone.

DEEP/USDT Low Cap signal buy areaDEEP/USDT Low Cap signal buy area
Deepbook (DEEP) is SUI's exchange. If you believe in SUI, then DEEP might be a potential 10-20x from here for you.
We are in a buy zone.
I'm buying this on spot and holding to $1.

DEEPUSDT.P | Bullish Setup Brewing (Daily Chart)Timeframe: Daily
Analysis:
MLR Nearing SMA: The MLR (blue) is below but approaching the SMA (pink), hinting at a potential bullish crossover.
MLR > BB Center: MLR exceeds the Bollinger Bands Center Line (orange), signaling growing bullish momentum.
PSAR: PSAR dots (black) are below the price, supporting an uptrend.
No SMA 200: SMA 200 unavailable - proceed with caution.
Trade Idea:
Entry: Consider a long position at the daily close.
Stop Loss: Place SL at yesterday’s PSAR level to limit downside risk.
Follow Me: Follow me for exit or profit-taking opportunities.
Outlook: MLR is poised to take SMA, which could confirm a bullish surge alongside PSAR and BB support. Stay vigilant for the crossover or reversal signals.
Risk Warning: Not financial advice, trade at your own risk.

DEEP LONG SETUP ALL trading ideas have entry point + stop loss + take profit + Risk level.
hello Traders, here is the full analysis for this pair, let me know in the comment section below if you have any questions, the entry will be taken only if all rules of the strategies will be satisfied. I suggest you keep this pair on your watchlist and see if the rules of your strategy are satisfied. Please also refer to the Important Risk Notice linked below.
Disclaimer

Trading opportunity for DEEPUSDTBased on technical factors there is a Buy position in :
📊 DEEPUSDT
🔵 Buy Now
🪫Stop loss 0.065
🔋Target 0.116
📏 R/R 2
💸RISK : 1%
We hope it is profitable for you ❤️
Please support our activity with your likes👍 and comments📝

DEEPUSDT LONG I don't have much to say, if you're a trader my chart have done all the talking, Lookout for a Long position and stay positioned the market did a rapid SELL yesterday and it now at a Demand zone which is strong, i expect a BUY from my marked zone, i will take a little short when the market respect the TLQ zone. for now WE WAIT.

DEEP - Finding The Next Trade SetupDEEP recently took out the January 13, 2025 low at $0.12345 with a Swing Failure Pattern (SFP), followed by a successful retest. This led to a bounce that hit a key level at $0.12141, presenting a solid long opportunity with minimal risk.
After this, the market turned bullish, forming a 5-wave structure and rallying to the 0.786 Fibonacci retracement level at $0.18643 (measured from the $0.20473 high to the $0.11922 low). This was a key take-profit zone for longs and a great short opportunity.
Adding confluence, the anchored VWAP also acted as resistance just above at $0.19, offering another low-risk short setup. Additionally, a key resistance level at $0.1809 further reinforced the rejection zone.
Current Price Action & Short Setup
From the 0.786 Fib retracement, DEEP retraced 20% downward, nearly touching the 0.618 retracement of the 5-wave structure before bouncing. Now, price is finding resistance at the golden pocket (0.618 at $0.17347 and 0.666 at $0.17534) of the recent drop, aligning perfectly with the daily 21 EMA ($0.1757) and daily SMA ($0.17347).
This setup suggests an ABC corrective move is forming.
Using the trend-based Fibonacci extension, the 0.786 extension aligns with the 0.618 retracement at $0.1457, creating a strong short setup.
Short Entry: Between $0.17347 - $0.17534
Target: $0.1457 (0.786 trend-based Fib extension / 0.618 retracement)
Stop Loss: $0.1845
Risk/Reward: 2.5:1
There’s also potential to extend the target to the 1:1 trend-based Fib extension at $0.13733, but this would depend on price action.
Potential Long Setup
If price reaches the $0.1457 support zone, this could present a high-probability long opportunity.
Entry: Around $0.1457
Risk/Reward: 2:1 or better, but confirmation is needed before executing the trade
