
DEXE Update📊 CRYPTOCAP:DEXE Update
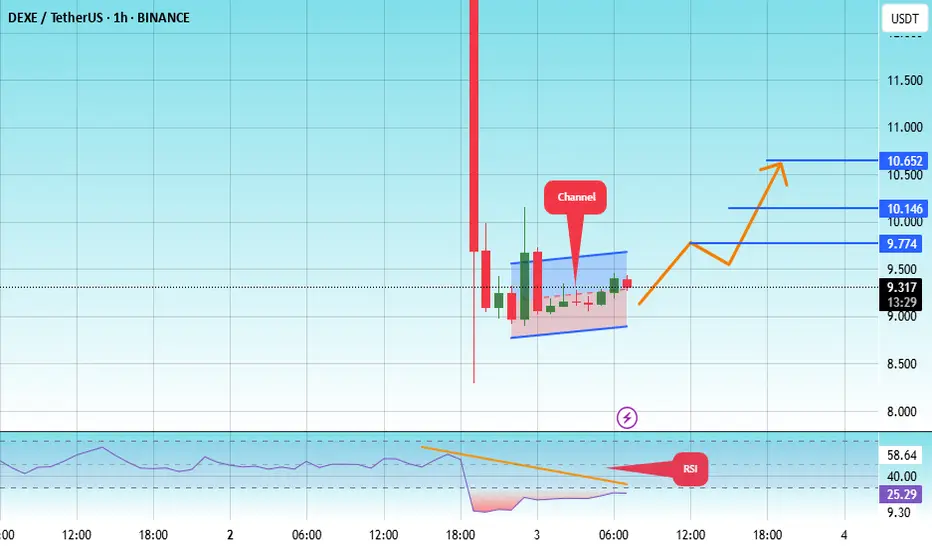
CRYPTOCAP:DEXE is testing the red resistance zone 🔴
If it breaks out, the first target will be the green line level 🟢

#DEXE/USDT#DEXE
The price is moving within a channel on the 1-hour frame, adhering well to it, and is heading for a strong breakout and retest.
We have a bounce from the lower boundary of the channel, this support at 8.93.
We have a downtrend on the RSI indicator that is about to be broken and retested, whi
#DEXE#DEXE
We have a bearish channel pattern on the 12-hour frame, within which the price moves and adheres to its limits well
We have a green support area at 11.30 after the price touched it and bounced from it
We have a tendency to stabilize above moving average 100
We have a downtrend on the RSI ind

DEXE Market UpdateDEXE Market Update
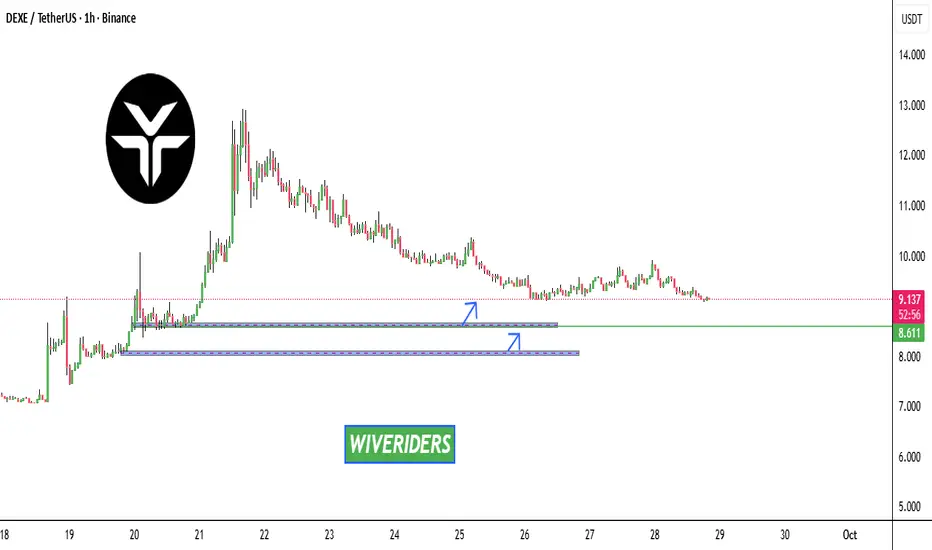
DEXE is in a downtrend 📉
If the price keeps retracing, we have two green zone levels 🟢 where buyers previously accumulated. From these levels, the price could bounce up again with confirmation ✅
⚡ Always trade smart, not blind — wait for confirmation before entering.
$DEXE Market Update📊 CRYPTOCAP:DEXE Market Update
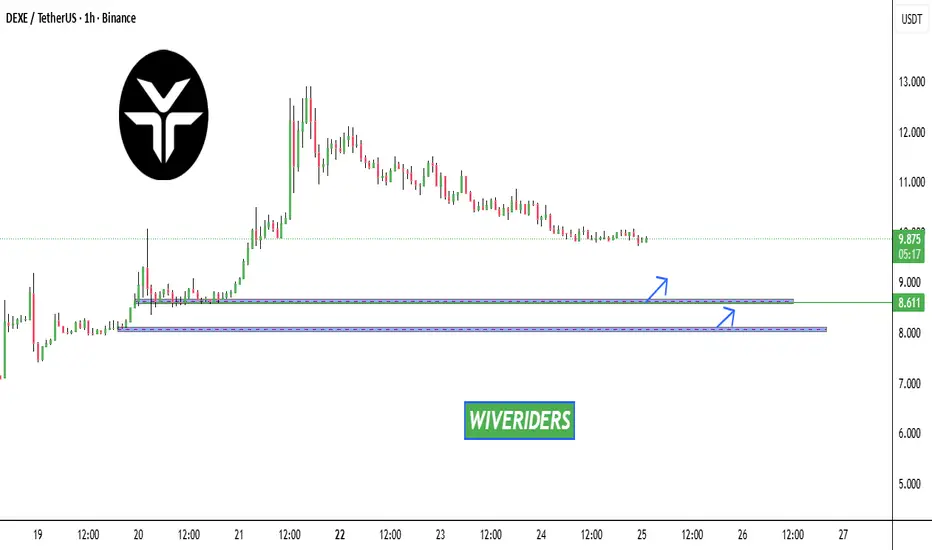
If CRYPTOCAP:DEXE keeps retracing 🔄, we have 2 possible long entry zones:
🔹 First blue line level 🔵 — potential bounce area.
🔹 Second blue line level 🔵 — deeper retracement zone where buyers could step in again.
From these levels, price could bounce up with conf
DEXE/USDT — Demand Zone Retest: Bullish Reversal or Breakdown?🔎 Overview
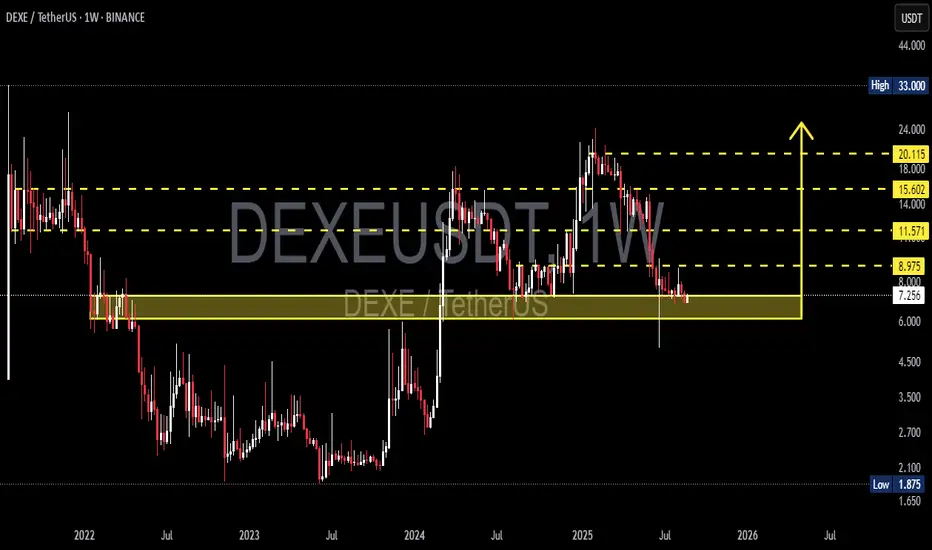
DEXE/USDT is currently retesting the weekly demand zone ($6–8) which has historically acted as a strong accumulation area during 2022–2023. After a massive rally in 2024 followed by a strong correction in early 2025, price has formed a series of lower highs, showing clear selling pressur
DexeDexe usdt Daily analysis
Risk rewards ratio >5 👈👌
Time frame daily
First target =16$
2th target = 19.5 $
Stop is very tight. Below of support line.
If price break the support line and my stop , I don't lose because it's very tight. On the other hand, if price reach to my target , I get good ben

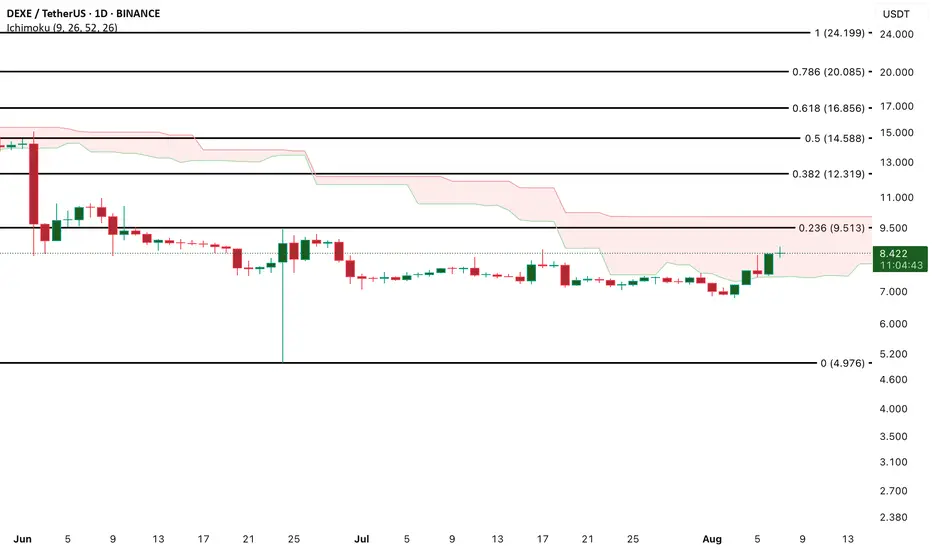
DEXE — Bullish Ichimoku Breakout Signals Uptrend ContinuationDEXE’s recent double-digit rally has propelled its price above the Ichimoku Cloud, a key indicator of trend strength and momentum. With this breakout, the token is now trading above both Leading Span A (green) and Span B (yellow), signaling a potential shift into a sustained bullish phase.
At the t
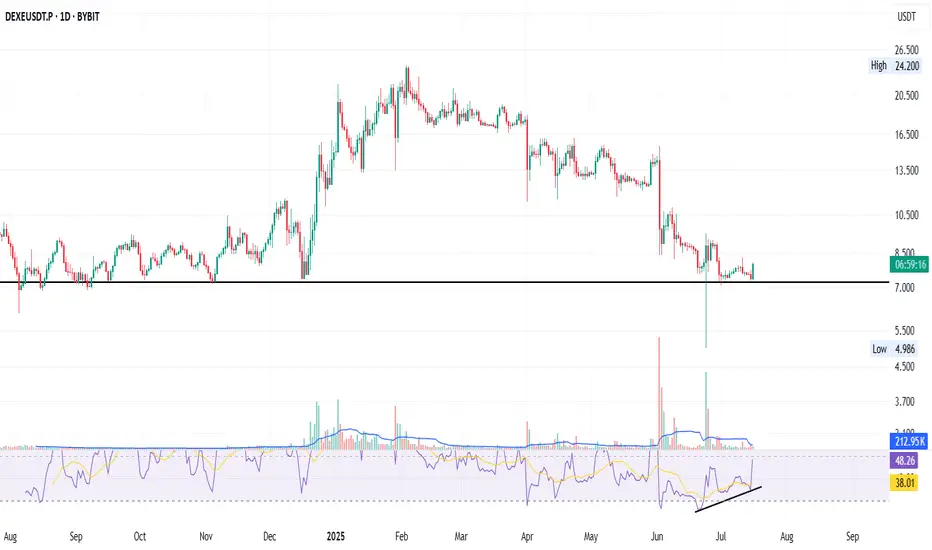
DEXE: Bounce + RSI Divergence + DeFi Strength
DEXE on the daily just bounced off an 11-month-old support - the key black line.
A strong bullish divergence on the RSI has been building for over a month — now confirming with momentum.
That long green wick under support? It’s signalling buyer interest and possible accumulation.
Fundamentals:
DEX
See all ideas
Summarizing what the indicators are suggesting.
Oscillators
Neutral
SellBuy
Strong sellStrong buy
Strong sellSellNeutralBuyStrong buy
Oscillators
Neutral
SellBuy
Strong sellStrong buy
Strong sellSellNeutralBuyStrong buy
Summary
Neutral
SellBuy
Strong sellStrong buy
Strong sellSellNeutralBuyStrong buy
Summary
Neutral
SellBuy
Strong sellStrong buy
Strong sellSellNeutralBuyStrong buy
Summary
Neutral
SellBuy
Strong sellStrong buy
Strong sellSellNeutralBuyStrong buy
Moving Averages
Neutral
SellBuy
Strong sellStrong buy
Strong sellSellNeutralBuyStrong buy
Moving Averages
Neutral
SellBuy
Strong sellStrong buy
Strong sellSellNeutralBuyStrong buy
Curated watchlists where DEXEUSDT.P is featured.

Asset Management: Get your assets in gear
15 No. of Symbols
See all sparks