DIAUSDT LONG SIGNAL📢 Trade Setup – DIA/USDT
📈 Position: LONG
💰 Entry Zone:
0.3024– 0.2959
(Key demand & trendline retest area shown on chart)
🛑 Stop-Loss:
0.29
(Below structure low & invalidation zone)
🎯 Take-Profit Targets:
• TP1: 0.3106
• TP2: 0.3335
• TP3: 0.33350
• TP4: 0.3469
• TP5: 0.3579
• TP6: 0.3678
📊 T
Related pairs

History Is Repeating for $DIA ??? 📌This is a 3-day chart, so it shows the higher-timeframe picture. For the last 5 months, price has been in a strong downtrend and dumped heavily 🔻
📌Now price is sitting inside a strong support zone (green area) , In the past, from this same zone, DIA made a massive pump 🚀
📌This support zone has al

DIA ( SPOT)BINANCE:DIAUSDT
DIA/ USDT
Entry range (0.266- 0.277)
SL 4H close below 0.2533
T1 0.30
T2 0.31
T3 0.35
T4 0.39
3 optional extra targets on the chart
_______________________________________________________
Golden Advices.
********************
* collect the coin slowly in the entry range.
* Pleas

DIA USDT LONG SIGNAL ---
📢 Signal Alert
🔹 Pair: DIA / USDT
📈 Trade Type: Long
💰 Entry Price: 0.05024
🎯 Take-Profit Targets:
TP1 = 0.05130 → R/R = 1 : 2.5
TP2 = 0.05220 → R/R = 1 : 4.2
TP3 = 0.05320 → R/R = 1 : 6.1
🛑 Stop-Loss: 0.04940
📊 Timeframe: 1H
⚖️ Average Risk/Reward Ratio: ≈ 1 : 4.2
📌 Suggested Leverage:

DIA enters breakdown trendDIA has officially entered a breakdown phase after losing its key short-term structure and falling back into the breakdown volume zone.
The sharp rejection from the $0.86 level triggered heavy selling pressure, confirming a shift in short-term trend momentum.
📉 Current outlook:
Price is now consol

DIA - Scalp Long💎 Scalp Long – DIA
Price has returned to the buying zone, showing clear recovery momentum.
The trend is backtesting the previous high — a classic accumulation phase before a breakout.
Buying volume is rising sharply, confirming strong inflow from buyers.
🎯 Plan:
→ Enter after price confirms suppor

DIA USDTWhat are your thoughts on DIA/USDT. Is it possible we tap the .786 and break out ? I think its a high Probability that we do reverse somewhere in here heading high or just maybe we come down even further? Let me know time will tell. Good Ole Crypto Folk.

DIA/USDT — Golden Pocket Battle: Accumulation or Breakdown?🔑 Key Highlights
DIA price is currently testing the Fibonacci golden pocket (0.5–0.618) range around 0.6884 – 0.6071 USDT, a highly crucial zone that will decide whether the market resumes a bullish rally or extends the bearish trend.
This area also acts as a flip level (former resistance turned p

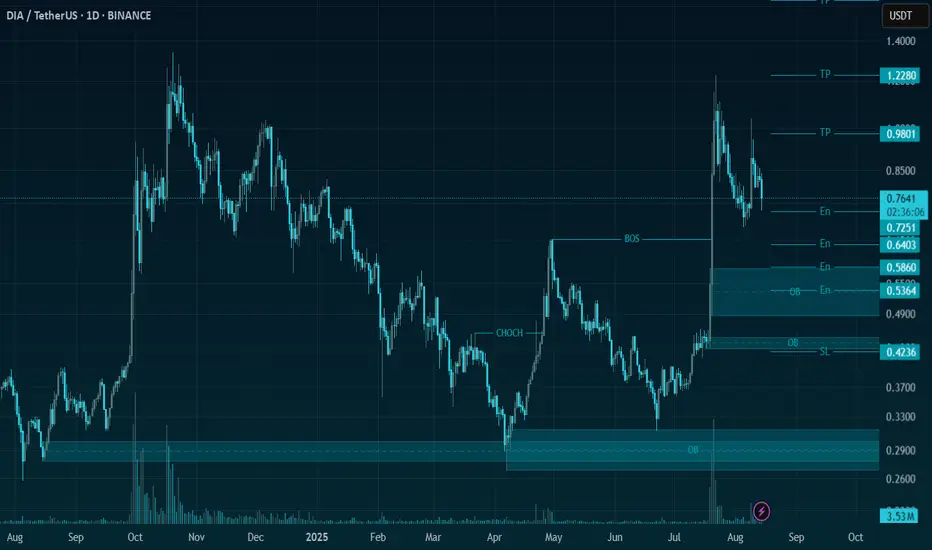
DIA/USDT | Ready for a Massive Upside🚀 Trade Setup Details:
🕯 # DIA/USDT 🔼 Buy | Long 🔼
⌛️ TimeFrame: 1D
--------------------
🛡 Risk Management:
🛡 If Your Account Balance: $1000
🛡 If Your Loss-Limit: 1%
🛡 Then Your Signal Margin: $32.23
--------------------
☄️ En1: 0.7251 (Amount: $3.22)
☄️ En2: 0.6403 (Amount: $11.28)
☄️ En3: 0.586
Dia is waiting for 210%#1 First target is 10% in trendline hourly
"In case of a breakout, we are going to 2nd target"
#2 Second target is 40% in trendline daily
"In case of a breakout, we are going to 3rd target"
#3 third target is 210% in trendline weekly
In your responsibility.

See all ideas
Summarizing what the indicators are suggesting.
Oscillators
Neutral
SellBuy
Strong sellStrong buy
Strong sellSellNeutralBuyStrong buy
Oscillators
Neutral
SellBuy
Strong sellStrong buy
Strong sellSellNeutralBuyStrong buy
Summary
Neutral
SellBuy
Strong sellStrong buy
Strong sellSellNeutralBuyStrong buy
Summary
Neutral
SellBuy
Strong sellStrong buy
Strong sellSellNeutralBuyStrong buy
Summary
Neutral
SellBuy
Strong sellStrong buy
Strong sellSellNeutralBuyStrong buy
Moving Averages
Neutral
SellBuy
Strong sellStrong buy
Strong sellSellNeutralBuyStrong buy
Moving Averages
Neutral
SellBuy
Strong sellStrong buy
Strong sellSellNeutralBuyStrong buy
Displays a symbol's price movements over previous years to identify recurring trends.
Frequently Asked Questions
The current price of DIA / TetherUS (DIA) is 0.2053 USDT — it has risen 0.50% in the past 24 hours. Try placing this info into the context by checking out what coins are also gaining and losing at the moment and seeing DIA price chart.
DIA / TetherUS price has risen by 1.42% over the last week, its month performance shows a −33.64% decrease, and as for the last year, DIA / TetherUS has decreased by −60.43%. See more dynamics on DIA price chart.
Keep track of coins' changes with our Crypto Coins Heatmap.
Keep track of coins' changes with our Crypto Coins Heatmap.
DIA / TetherUS (DIA) reached its highest price on May 5, 2021 — it amounted to 5.8000 USDT. Find more insights on the DIA price chart.
See the list of crypto gainers and choose what best fits your strategy.
See the list of crypto gainers and choose what best fits your strategy.
DIA / TetherUS (DIA) reached the lowest price of 0.1668 USDT on Feb 6, 2026. View more DIA / TetherUS dynamics on the price chart.
See the list of crypto losers to find unexpected opportunities.
See the list of crypto losers to find unexpected opportunities.
The safest choice when buying DIA is to go to a well-known crypto exchange. Some of the popular names are Binance, Coinbase, Kraken. But you'll have to find a reliable broker and create an account first. You can trade DIA right from TradingView charts — just choose a broker and connect to your account.
Crypto markets are famous for their volatility, so one should study all the available stats before adding crypto assets to their portfolio. Very often it's technical analysis that comes in handy. We prepared technical ratings for DIA / TetherUS (DIA): today its technical analysis shows the sell signal, and according to the 1 week rating DIA shows the sell signal. And you'd better dig deeper and study 1 month rating too — it's sell. Find inspiration in DIA / TetherUS trading ideas and keep track of what's moving crypto markets with our crypto news feed.
DIA / TetherUS (DIA) is just as reliable as any other crypto asset — this corner of the world market is highly volatile. Today, for instance, DIA / TetherUS is estimated as 0.83% volatile. The only thing it means is that you must prepare and examine all available information before making a decision. And if you're not sure about DIA / TetherUS, you can find more inspiration in our curated watchlists.
You can discuss DIA / TetherUS (DIA) with other users in our public chats, Minds or in the comments to Ideas.