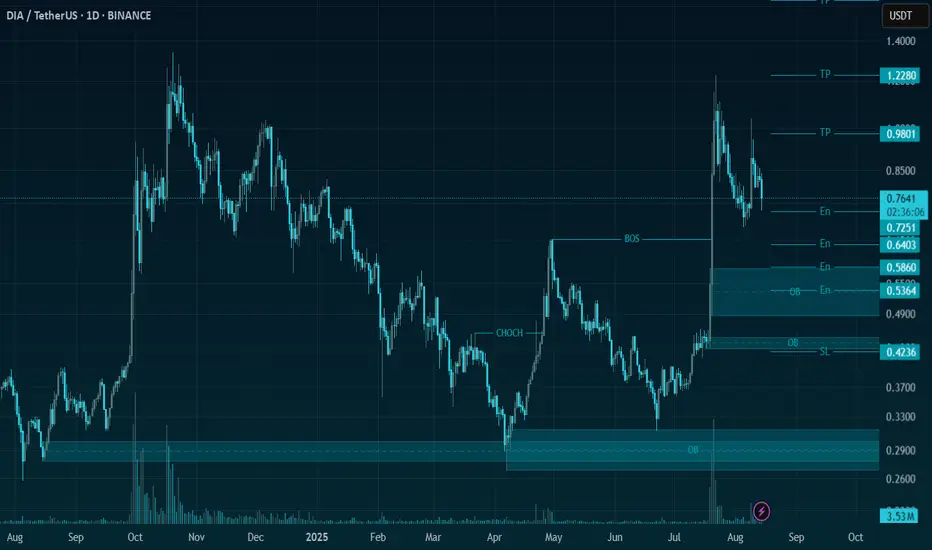
DIA/USDT — Golden Pocket Battle: Accumulation or Breakdown?🔑 Key Highlights
DIA price is currently testing the Fibonacci golden pocket (0.5–0.618) range around 0.6884 – 0.6071 USDT, a highly crucial zone that will decide whether the market resumes a bullish rally or extends the bearish trend.
This area also acts as a flip level (former resistance turned p

DIA/USDT | Ready for a Massive Upside🚀 Trade Setup Details:
🕯 # DIA/USDT 🔼 Buy | Long 🔼
⌛️ TimeFrame: 1D
--------------------
🛡 Risk Management:
🛡 If Your Account Balance: $1000
🛡 If Your Loss-Limit: 1%
🛡 Then Your Signal Margin: $32.23
--------------------
☄️ En1: 0.7251 (Amount: $3.22)
☄️ En2: 0.6403 (Amount: $11.28)
☄️ En3: 0.586
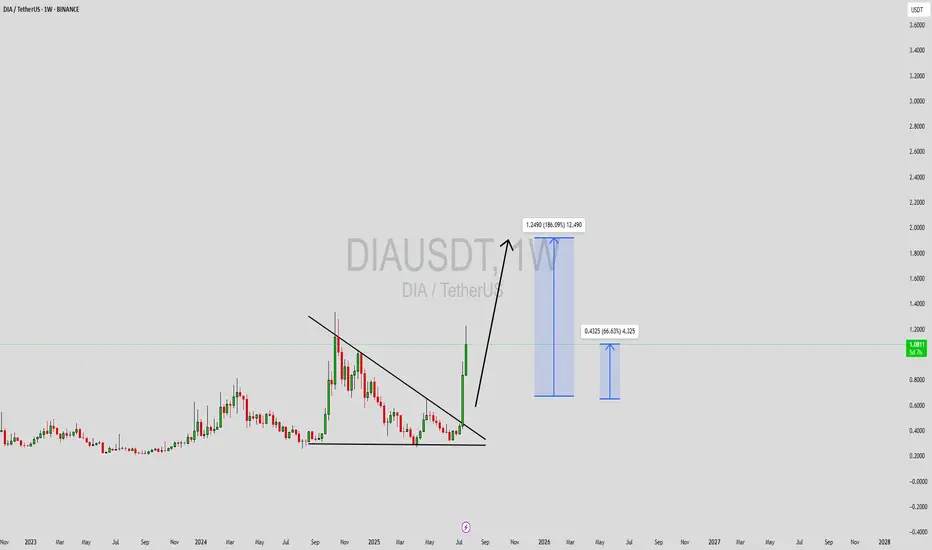
Dia is waiting for 210%#1 First target is 10% in trendline hourly
"In case of a breakout, we are going to 2nd target"
#2 Second target is 40% in trendline daily
"In case of a breakout, we are going to 3rd target"
#3 third target is 210% in trendline weekly
In your responsibility.

Dia is going crazy!! in case of breakout you can predict at least 45% profit and waiting for 200% profit in Bullrun.
In your own responsibility.

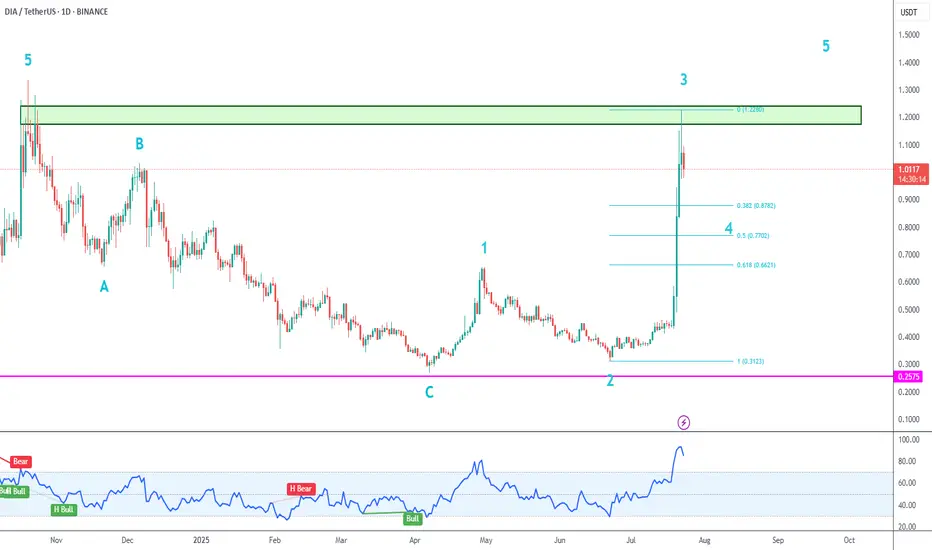
DIA Motive Wave➡️ After confirming blue wave C, price is making a motive wave with sub-waves 1 and 2 complete.
➡️ Price is initially being held by the gray supply zone, which dates from October 2024.
➡️ This high could have marked the end of wave 3. Pullbacks are buying opportunities, but I prefer to see a
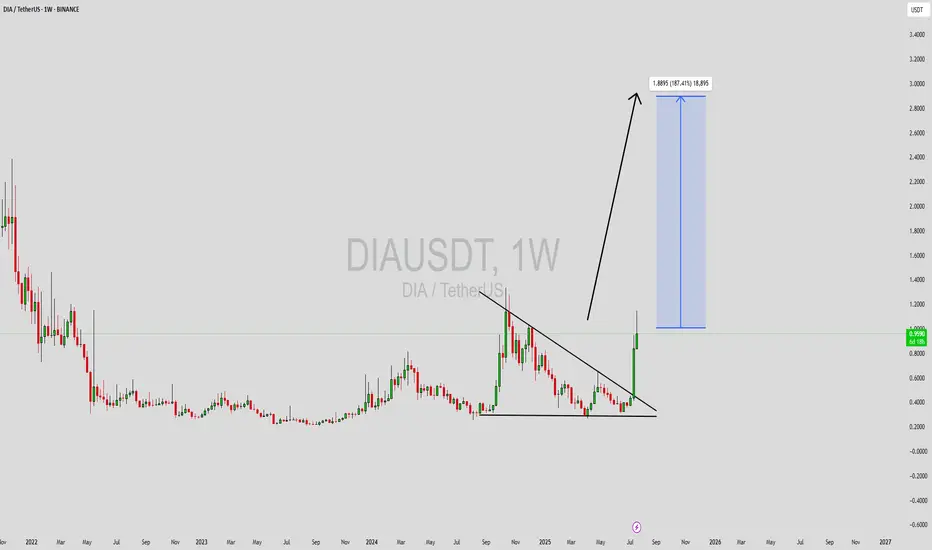
DIAUSDT Forming Descending ChannelDIAUSDT has recently broken out of a well-defined descending channel pattern on the weekly timeframe, signaling the start of a major bullish reversal. This breakout, accompanied by a strong surge in volume, suggests that buying momentum is entering the market decisively. The DIA token, which underpi
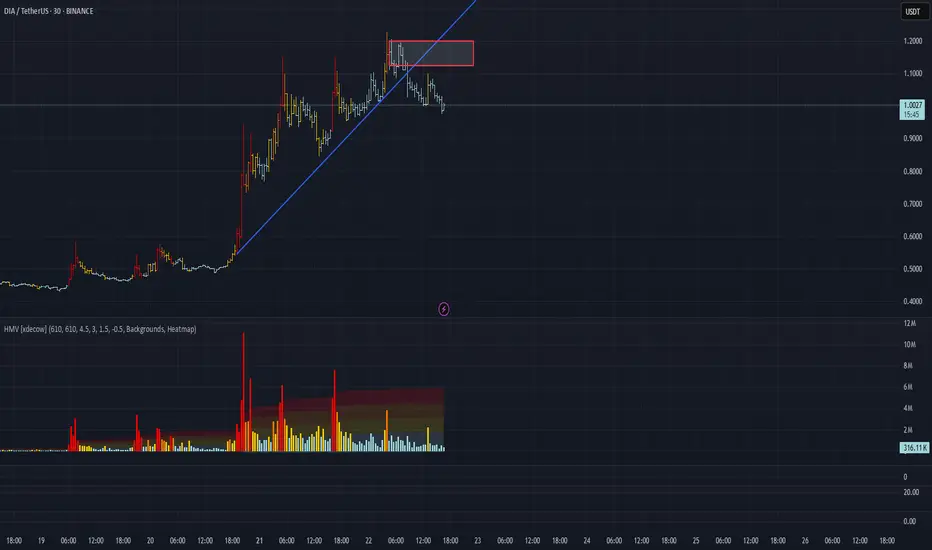
DIA/USDT Analysis: High Probability of Correction
This asset has experienced a trend break and a breakdown of the ascending trendline. A volume cluster has formed above the current price, which triggered the current correction. If these levels are retested and met with a reaction, we consider a short position with a potential target of $0.9.
Sel
DIAUSDT Forming Powerful BreakoutDIAUSDT (DIA/USDT) has just completed a powerful breakout from a long-standing descending triangle pattern on the weekly timeframe. This move signals a potential shift from accumulation to expansion as bulls regain control. The breakout is accompanied by a significant surge in trading volume, sugges
DIAUSDT: Trend in daily timeframeThe color levels are very accurate levels of support and resistance in different time frames, and we have to wait for their reaction in these areas.
So, Please pay special attention to the very accurate trend, colored levels, and you must know that SETUP is very sensitive.
Be careful
BEST
MT

A strategic, short-term bullish trade driven by the USDT.D!This DIA/USDT long position is a strategic, short-term bullish trade driven by the USDT.D distribution pattern on the 45-minute timeframe, signaling a potential altcoin rally. DIA’s strong fundamentals, including its transparent data sourcing, DeFi adoption, and cross-chain compatibility, make it a

See all ideas
Summarizing what the indicators are suggesting.
Oscillators
Neutral
SellBuy
Strong sellStrong buy
Strong sellSellNeutralBuyStrong buy
Oscillators
Neutral
SellBuy
Strong sellStrong buy
Strong sellSellNeutralBuyStrong buy
Summary
Neutral
SellBuy
Strong sellStrong buy
Strong sellSellNeutralBuyStrong buy
Summary
Neutral
SellBuy
Strong sellStrong buy
Strong sellSellNeutralBuyStrong buy
Summary
Neutral
SellBuy
Strong sellStrong buy
Strong sellSellNeutralBuyStrong buy
Moving Averages
Neutral
SellBuy
Strong sellStrong buy
Strong sellSellNeutralBuyStrong buy
Moving Averages
Neutral
SellBuy
Strong sellStrong buy
Strong sellSellNeutralBuyStrong buy
Displays a symbol's price movements over previous years to identify recurring trends.