DOGE - NEXT WAVE UPGood Morning,
Hope all is well. DOGE is looking to make another move upwards before starting its correction and pull back for continued support. News of the DOGE etf is creating some awesome volume with a 24H accumulation above 7 BILLION!
Cross of the 20EMA above 50EMA is a good starting point to enter.
Place Safe
Enjoy!
DOGEUSD trade ideas

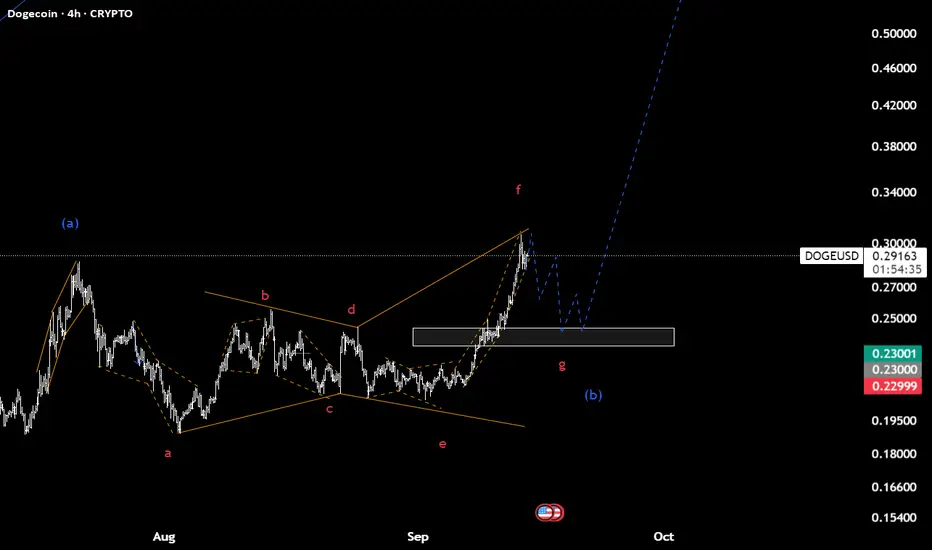
Doge(based on NEo wave)wave (b) is at the end and last chance to buy in low price.
I think a heavy bullish wave is coming and you can see targets on cycle analysis which I reply on that.
update doge a quick update in regards to market activity we are forming adem and eves on many coins .i will expect a break out now if doge reaches 0.35 we currently hit the 0.5 fib next target 0.34

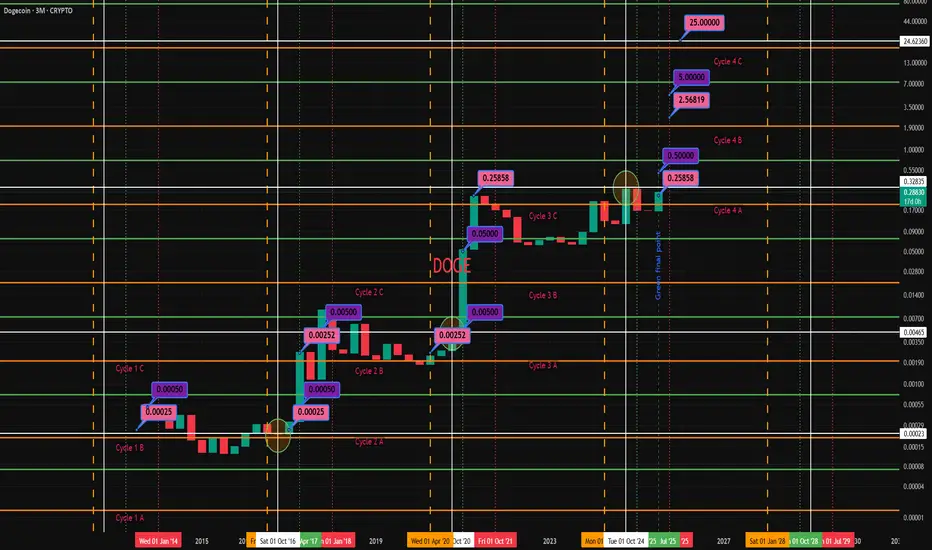
DOGE Cycle Analysis | Play It Safe | Wicks Removed Key Price LevDOGE Cycle Analysis | 3M Log View | No Wicks
This chart explores historical DOGE price action through macro cycles (3M candles). Wickless candles are used to eliminate noise and focus on clean body closes for better decision-making. Key support/resistance levels and psychological targets are labeled.
📌 Currently entering Cycle 4
🔍 Important Price Levels to Watch:
(Without wicks; body closes only)
Targets:
$0.50
$2.56 – $5.00
$25.00 (final blow-off top target?)
DOGE: Ending Diagonal IdeaDoge is coming up on a resistance, making local higher high as RSI is still a lower high. So far, the structure looks to be a 3 wave move. The 5 waves move seems to be a part of a bigger 3 waves move, making it very difficult to count as an impulse overall. Hense the idea of an ending diagonal. Ending diagonals can form a structure over a very long period and it is almost impossible to identify until it is almost over. So, this idea will be something I will be tracking closely but, still not the primary idea. For now, overall markets are getting frothy, and a correction seems to be imminent. At this moment, having a true breakout to push RSI higher seems to be less probable, but not impossible. So, if price starts to retrace over the next 2-4 weeks, it might be the B wave before the yearend rally to complete C of 3. It could also be a leading diagonal to a wave 1 of 5, but we can talk about that down the road depending on the macro landscape.

DOGE to the moonThe current ETF news and the weekly 30% soar can indicate that Doge started its rocket engines to reach new ATHs


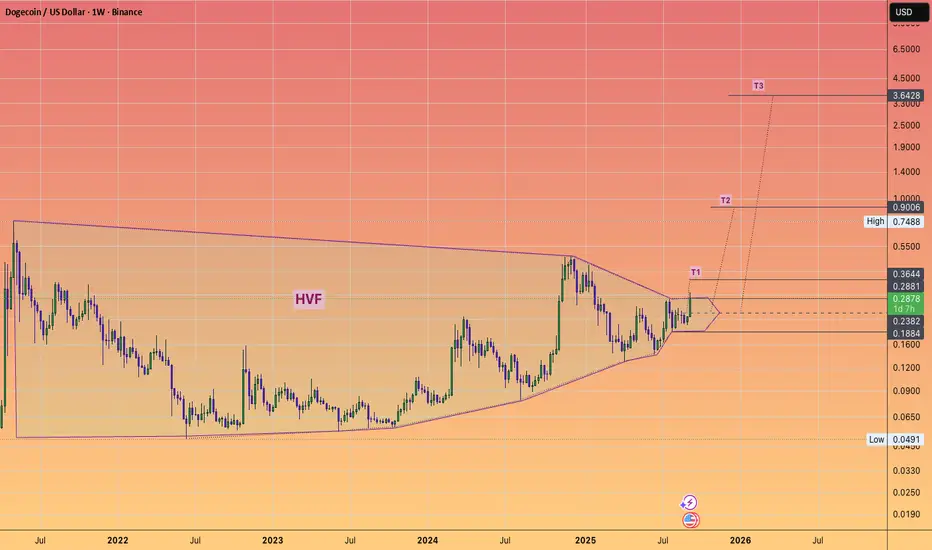
DOGECOIN can go higher than you think.#DOGE
Can get to around 4 Bucks a coin.
Yea I know thats around half a trillion of marketcap.
What does the @TheCryptoSniper think of this #HVF
FOR THE CRYPTO FOLKS!!! | *DOGECOIN* Possible Bullish MomentumTimeframe: 1D
Targets: $0.28 → $0.43 → $0.48
Dogecoin has broken above its long term downtrend and is currently holding trendline support. If momentum continues, key levels to watch are $0.28, $0.43, and $0.48 as potential upside targets.
⚠️ This is not financial advice just my personal analysis. Always do your own research before trading or investing.


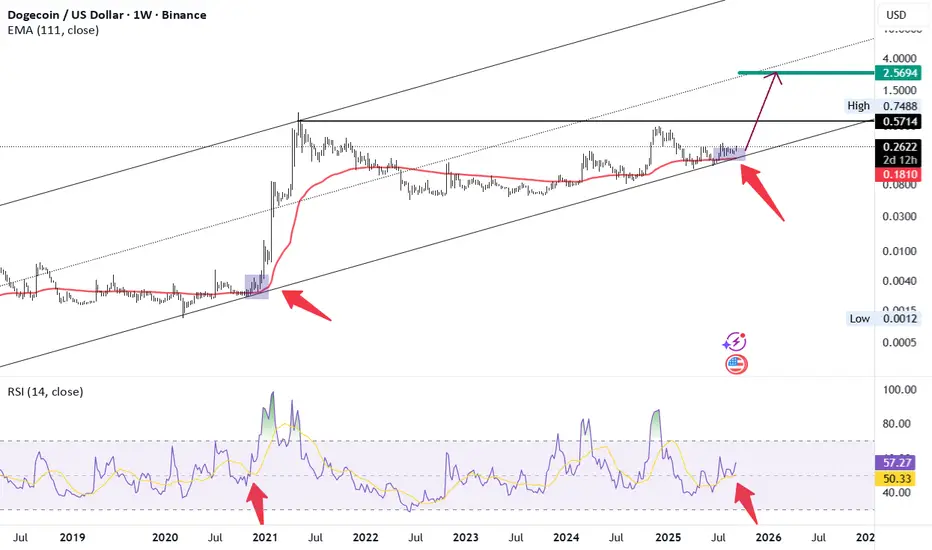
DOGECOIN on the way to 2.5$The Dogecoin chart on the weekly and monthly time frames shows a repeat of history, as well as the fundamental potential that exists to push the price up to $2.5.
DOGE's situation+next targets and expected movementsThe price on the daily timeframe is within an ascending triangle, which can be promising. If the price breaks this pattern with bullish candles, it could easily rise by the distance of AB=CD .
Best regards CobraVanguard.💚

[b]New All Time High for DOGE [/b]New All Time High for DOGE
Cup & handle on weekly timeframe on $DOGEUSD. This aligns perfectly with a squeeze from Bollinger Bands, top of Elliot Waves, solid support from next Fibonacci level and the launch of the ETF tomorrow! Run DOJE Run!

DOGE Breakout Trade IdeaDOGE is building momentum after a long awaited "alt season". Could be an interesting trade setup if we can breakout from this year's resistance. I'm eyeing a 2x-3x move.


DOGEUSD - RSI W Pattern RSI is showing strong support along the middle line.
A breakout on the RSI will come and create the right side of the W. In this case the middle is the highest peak of this structure.
This is the Monthly chart and the upward trend channel is supported and will likely act bullishly on this large timeframe.
Dotted lines are all important levels.

DOGE 1HR FractalAccumulating for weekly Take Profit. This feels as if we’re rallying the horses.
Find Risk management levels in the weekly and you’ll understand Weekly Take Profit % > this small 2% move…
Retest, reload… Time will tell… Be patient as there are levels we need to hold to see if what we feel is going to play out

**DOGE Analysis** DOGE is currently in a consolidation phase, t**DOGE Analysis**
DOGE is currently in a consolidation phase, trading within a tight range. Key support rests at **$0.12**, a level crucial for maintaining short-term bullish structure. A break below could see a test of **$0.115**. Immediate resistance lies near **$0.135**, with stronger selling pressure expected around **$0.145**.
As a meme coin, DOGE's price remains highly sensitive to social media sentiment, particularly Elon Musk's endorsements, rather than fundamental utility. Recent trading volume has been subdued, indicating a lack of strong directional conviction.
Overall, DOGE remains dependent on broader crypto market momentum and retail investor interest. A break above $0.145 with high volume could signal a move toward $0.16, while loss of $0.12 support may trigger a deeper pullback.
A Brief History of DOGE FractalsMy analysis of the Dogecoin daily chart reveals a compelling long-term symmetrical triangle pattern, from which we observed a clear breakout in early 2024. Following this significant move, there are a series of smaller, bullish continuation triangles forming. Based on these patterns, my projections indicate that after each period of consolidation within these triangles, the price is likely to continue its upward trend toward the indicators targets. Currently, with the price consolidating in the latest of these triangles, I anticipate a further bullish move in the near future. X

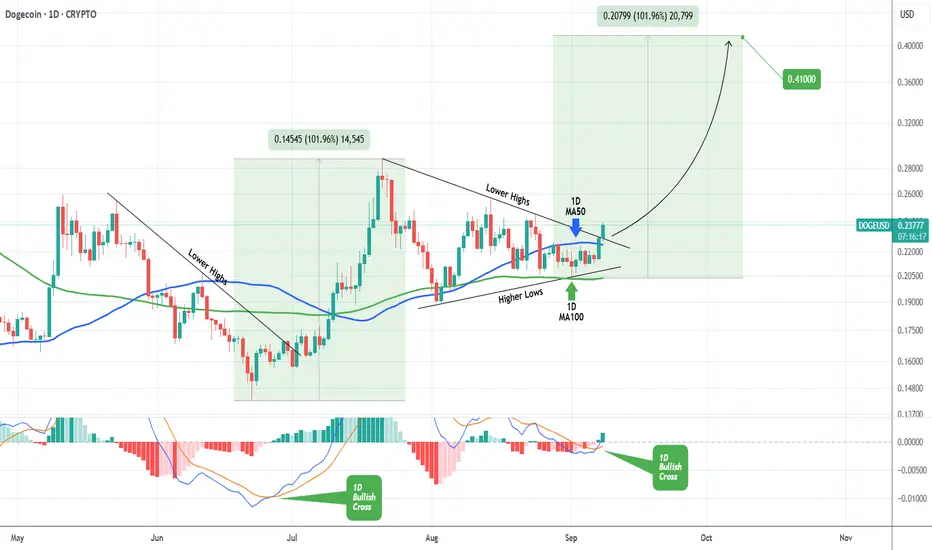
DOGE Strong Triangle break-out targets $0.4100Dogecoin (DOGEUSD) broke today above the top (Lower Highs trend-line) of the Triangle pattern that it has been trading in since the July 21 High. At the same time, the 1D MACD formed a Bullish Cross below the 0.0 level.
The last time the coin made a Lower Highs bullish break-out on a MACD Bullish Cross below 0.0 was on June 30. That break-out completed a +101.96% rise. We expect a similar rise to occur, giving us a $0.4100 Target within a month's time.
-------------------------------------------------------------------------------
** Please LIKE 👍, FOLLOW ✅, SHARE 🙌 and COMMENT ✍ if you enjoy this idea! Also share your ideas and charts in the comments section below! This is best way to keep it relevant, support us, keep the content here free and allow the idea to reach as many people as possible. **
-------------------------------------------------------------------------------
💸💸💸💸💸💸
👇 👇 👇 👇 👇 👇
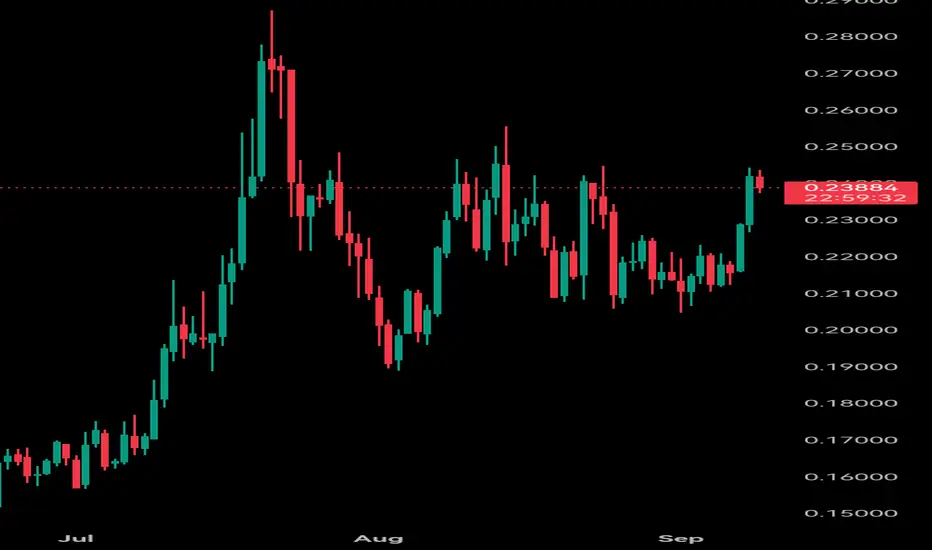
Doge Prediction 4H TimeFrameTL;DR: The 4‑hour trend is up, but momentum looks overheated. I’d expect either a brief consolidation or a pullback toward ~$0.224–$0.226 before another attempt at the $0.235 area. A clean 4H close above ~$0.235 opens room toward the $0.24s and then the late‑month high near $0.256. A 4H close below ~$0.222 would weaken the setup
FlagsWe have a descending triangle inside of a bearish flag. If the 50 EMA 0.208$(blue) does not hold. We might see 0.18 to 0.17$. The next two weeks are going to be intriguing. Thank you for your time
