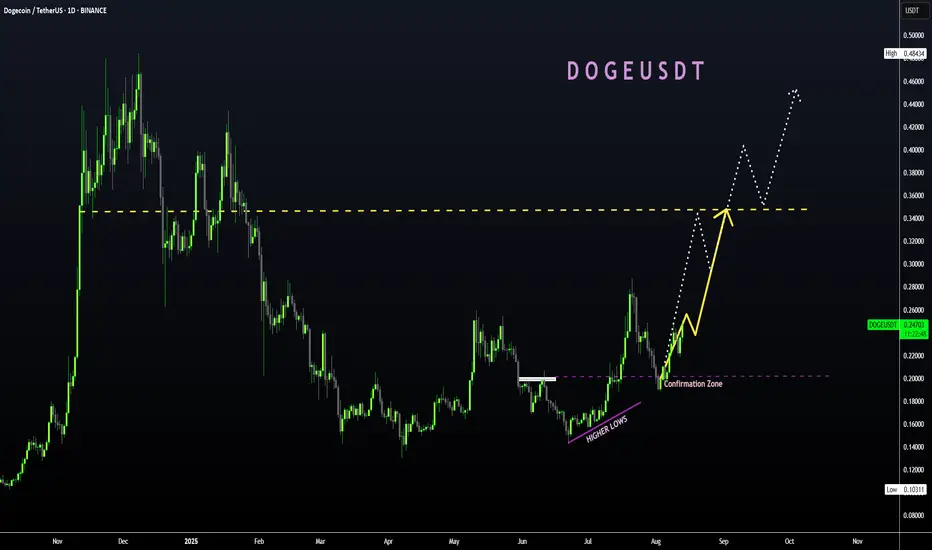
DOGECOIN Flips the Script! Higher Prices Likely Ahead (⊙ˍ⊙)Dogecoin has recently made a stunning 62% increase since my last update:
Find the last update here on a bull season ahead for DOGE:
So what's next for Dogecoin? Well, as long as ETH continues to hold it's current position, alts will continue to rally as they take turns with Ethereum to increase, pause and hold, or slightly pullback. This all happens with BTC above $119k, and it the short term Bitcoin is still looking strong.
There's no way that ETH makes a new ATH and DOGE doesn't. It may take some time, but higher prices are likely on the cards for the near term for Dogecoin!
As long as Bitcoin stays in this zone, ALTS will continue to rally :
DOGEUSDT.P trade ideas
DOGE/USDT Price Prediction - 1W (Updated)Trend Prediction - DOGE/USDT Forecasting -
End of Resistance and Support Lines Falling Wedge Pattern!!!
**** Yousef Sharafi ****
Follow me here for more analysis

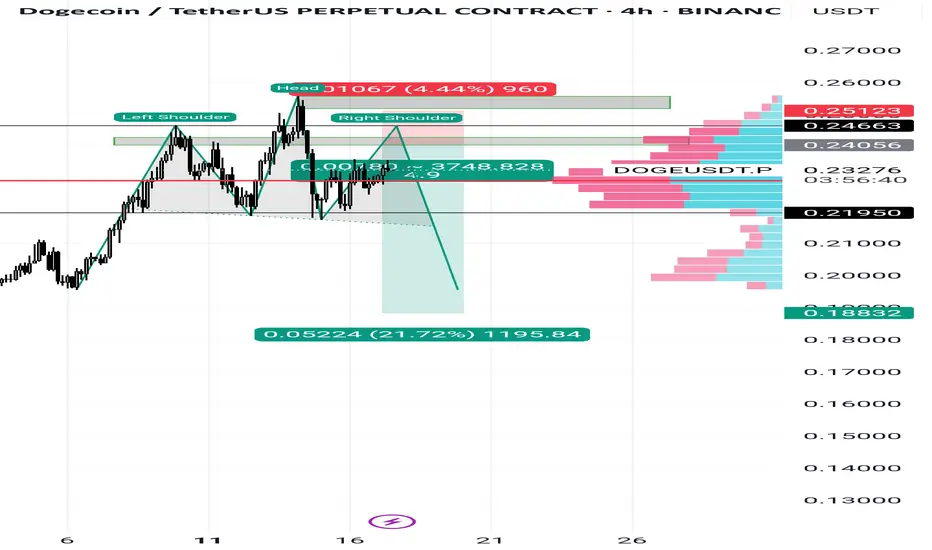
Doge forming head and should patternDoge forming head and should pattern not formed but can take short with sl
Dogecoin's 2025 True All-Time High Revealed (Beyond $1.85)Will Dogecoin's bull market also end in exactly two months?
Does this means that all possible growth should be compressed within 8 candles only?
In the last bull market, Dogecoin grew for 420 days a total of 65,527%.
The previous bear market ended June 2022, that's the market bottom for DOGEUSDT after the May 2021 all-time high. Including a period of consolidation, Dogecoin has been rising for 1,155 days. The current uptrend became obvious in October 2023, since 672 days.
Who is to say that the market will grow for a maximum of two months? Why not 3 months or 4 months? The FED? Things are not always what we expect. We cannot predict the future for sure. Maybe we can predict some events but we cannot predict how the market will react to a certain announcement.
Maybe when everybody is thinking that there will be a recession with the stock market crashing and crypto, but crypto instead of crashing becomes ultra bullish. While everything else is down crypto is up. Perfect timing of course.
Dogecoin has been rising for years and it has a great chart. It is still far away from an all-time high but seeing Cardano, we know it will move above December 2024. Seeing XRP and ETH, we know it will continue to grow.
The path is already set.
We have some really interesting targets. I am looking at the full numbers for DOGEUSDT.
The first resistance worth being mentioned is $0.47. This one can be hit within a month.
Then we have the all-time high around $0.74 followed by $1.166. The second one being the main resistance for the current move. If the bull market is extended as previous ones, then we can expect even higher prices. Dogecoin can trade at an amazing $1.85 or $2.55.
Additional details on the chart.
The market looks chilling now, but everything is about to blow up.
Namaste.

dogeusdtdogeusdt may come further down completing abc correction .watch out for the zone if comes there for longs.

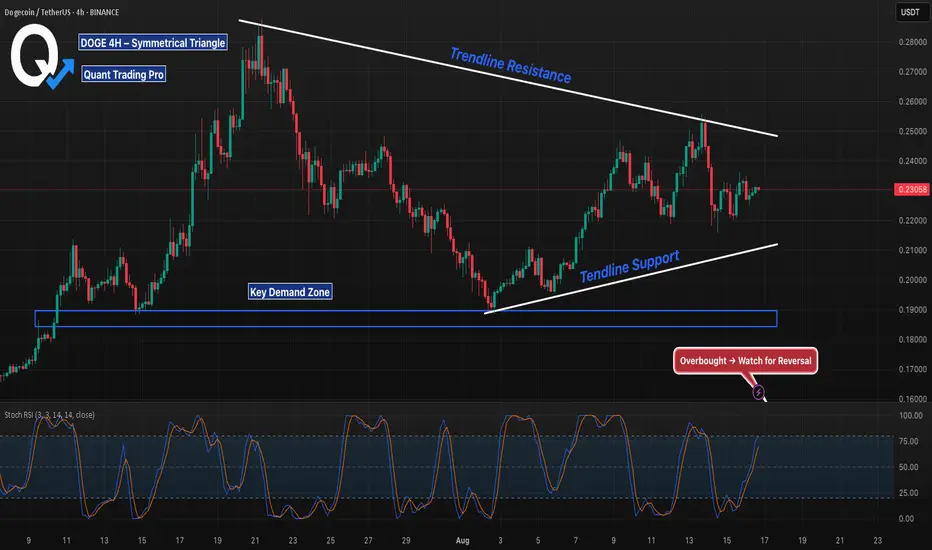
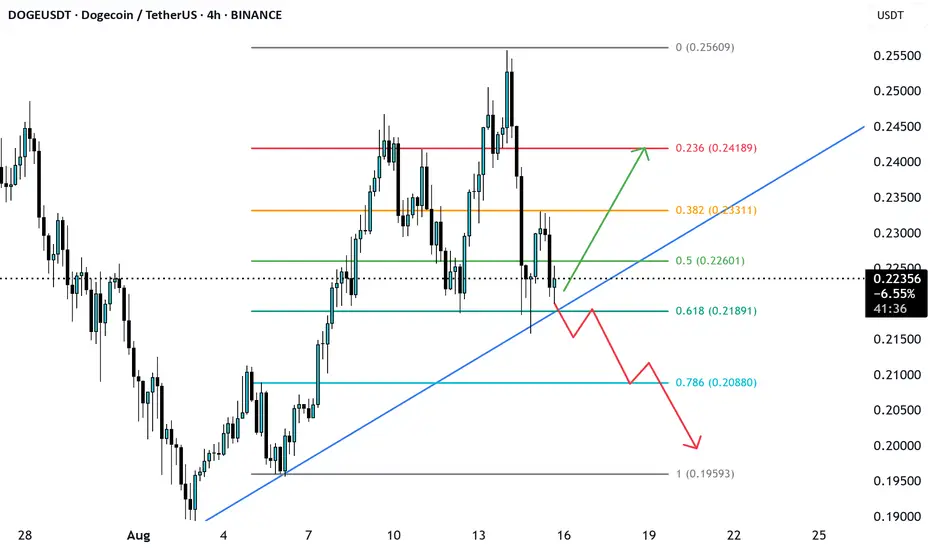
DOGE 4H – Breakout Toward 0.25 or Breakdown to 0.19?Dogecoin is consolidating inside a symmetrical triangle with lower highs and higher lows converging. Price is currently hovering near 0.23, right in the middle of the structure.
Bull case: Break above 0.25 trendline resistance would confirm bullish continuation, opening a push toward the mid-0.26s.
Bear case: Failure to hold 0.22 would invalidate the rising base and target the 0.19–0.20 demand zone.
With Stoch RSI overbought, momentum may cool before a decisive breakout. The next move out of this triangle will set the direction.
DOGEUSDT likely to head towards 0.30 to 0.33#DOGE #DOGEUSD #DOGEUSDT CRYPTOCAP:DOGE
After we closed our long trade at daily resistance DR1, the price started to pull back down as per our expectation.
This pullwas was expected by us since the price had hit the daily resistance.
Now the price has come to the 4h support zone 4HS1.
This zone is good for the price to bounce.
It is likely that the price will bounce here and resume its upward journey.
Therefore, this is a long opportunity here.
This time target is way beyond our last trade target.
I expect that this bounce will bring the price to monthly resistance MR1.
MR1 zone is around 0.30 - 0.33.
This is high R:R trade since the stop loss is very limited 5% but the profit target is huge and close to 40%.
Lets try this trade. We will keep monitoring the price action.
If any update is required, I will keep sharing here.
What do you think about this trade and the expected price action?
Would love to hear your thoughts. Share your view in comments.

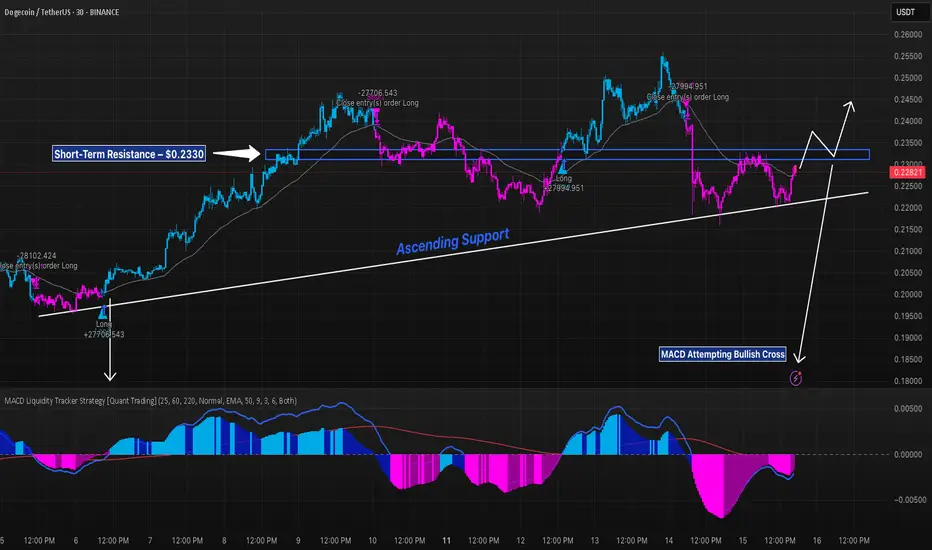
DOGE 30M – Consolidating Between Support and ResistanceDOGE is consolidating between ascending support near $0.2220 and short-term resistance at $0.2330. A breakout above resistance could open a push toward $0.2450, while a rejection risks another retest of the rising trendline. The MACD Liquidity Tracker is attempting a bullish cross near the zero line, suggesting momentum could shift in favor of buyers if price reclaims the resistance zone. Trend remains intact while above the white trendline.
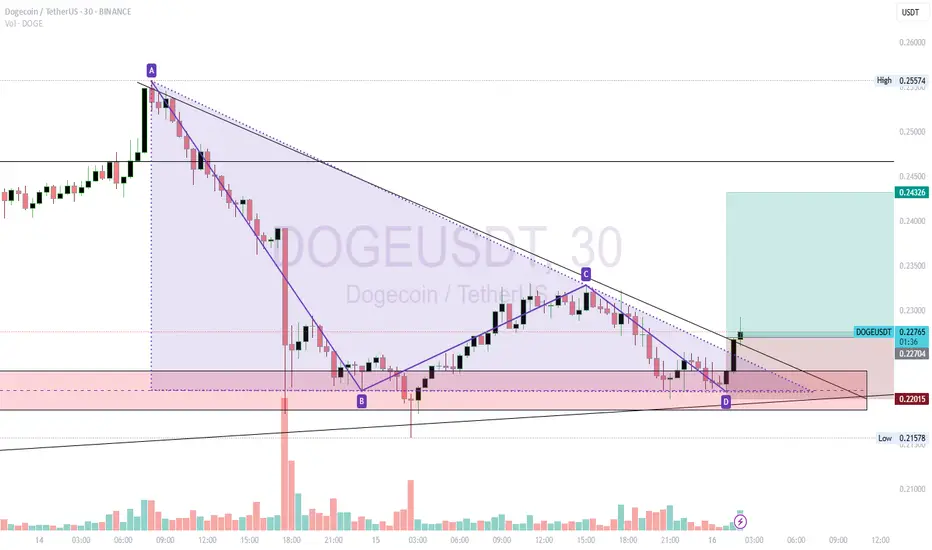
DOGEUSDT – Descending Triangle Breakout with ABCD MappingI’ve been tracking BINANCE:DOGEUSDT on the 30m chart using an ABCD point layout to outline a descending triangle pattern.
A → C → D: Lower highs consistently respecting the downtrend line.
B & D zone (~0.2200): Flat base support forming the triangle floor.
Price has now broken above the descending trendline with a noticeable spike in volume, indicating that buyers stepped in aggressively to break the pattern.
Why This Matters:
Volume was relatively muted during the consolidation phase inside the triangle, which is normal for this type of setup. However, at the breakout candle, volume surged — confirming that the move was not just a false breakout but backed by real market participation.
Trade Plan:
Entry Zone: Above 0.2270 (confirmed breakout)
First Target: 0.2300
Second Target: 0.2430 (measured move from triangle height)
Stop Loss: Below 0.2200 (pattern invalidation)
Notes:
While descending triangles often break downward, this setup shows bullish divergence between price action and volume — suggesting that the market may be preparing for a sustained upside move.
DOGE at Key 0.618 Fib Support — Watching for Bounce to 0.245DOGE has reached the 0.618 Fibonacci retracement level, which aligns closely with trendline support. From this zone, the price could start moving upward again toward the 0.245 level.
If a breakdown occurs, the price may move lower — though current structure suggests a bounce is more likely.
Strong BULLISH TREND will continueThe best time and place to buy.
Divergence is observed.
Zigzag pattern has been completed on the daily timeframe.
It will see its previous high at $0.46.
Be patient

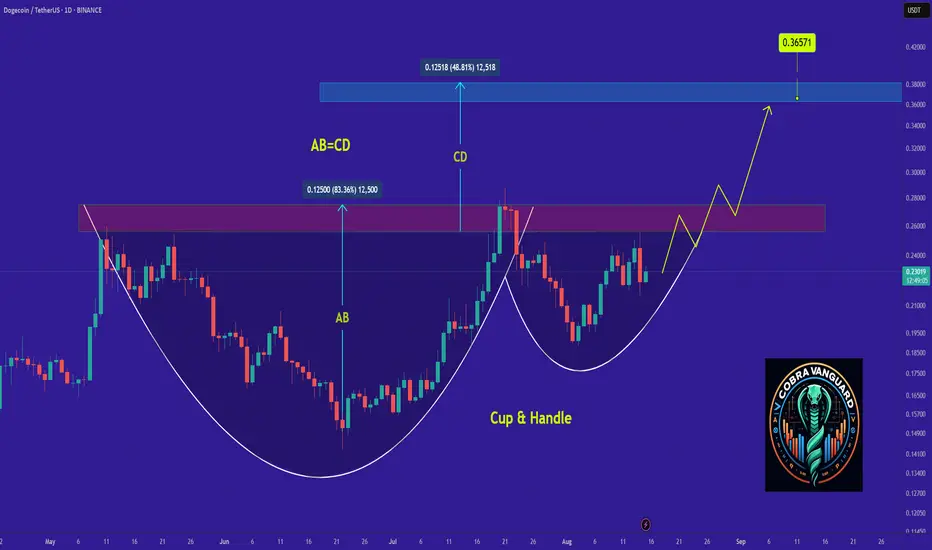
DOGE - Time to buy again!It appears that the price is forming a cup and handle pattern, and if this occurs, it could push the price above $0.33.
Best regards CobraVanguard.💚

DOGE: Big Red Candle Alert – Short-Term Bears in Control?Wow, DOGE just printed a monster red candle—and it’s not just on the small charts, even the higher timeframes are showing weakness. We hit resistance near the 0.236 Fib and now price is testing the 0.382 zone. If this cracks, I’m watching $0.209 (0.618 Fib) as the next possible target. For now, I’m keeping a short-term bearish bias until bulls prove me wrong. Not financial advice, just my trading view. Peace!
The reaction to the specified blue-colored areaHi, I think in the blue-marked area we can make a good buy, but unfortunately I can’t identify the target.
What’s your opinion?
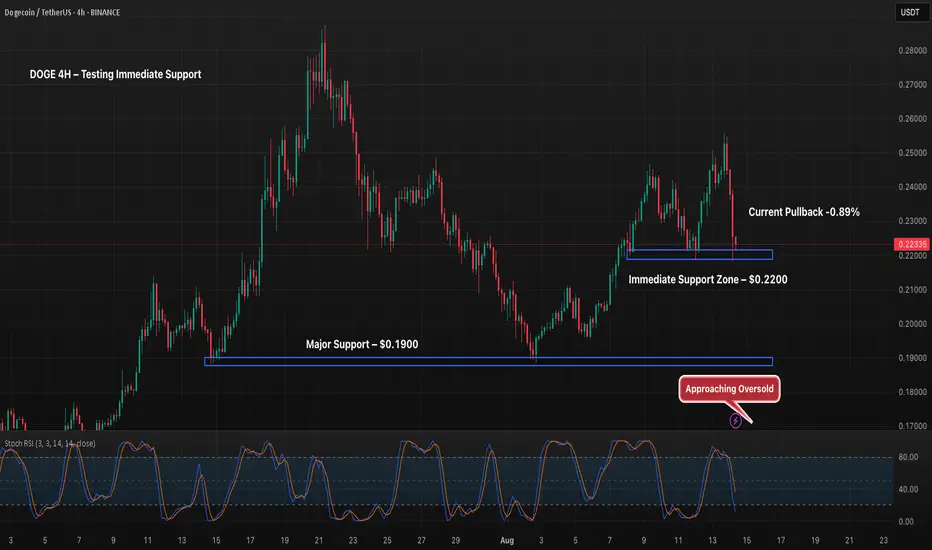
DOGE 4H – Testing Immediate SupportDogecoin’s 4H chart is testing its immediate support near $0.2200 after a sharp pullback. The oversold Stoch RSI suggests potential for a short-term bounce, but a decisive break lower could trigger a move toward the major $0.1900 support zone. Bulls will need to reclaim $0.24 to shift momentum back upward.
DOGEUSDT FLAG Pattern and CorrectionDOGEUSDT recently broke out of a bullish wedge, triggering an upward price move. It has now formed a bullish flag pattern, with the price currently in a corrective phase. The correction could extend to the 0.5 Fibonacci retracement level around 0.22, after which traders will be watching for a breakout above the flag’s trendline.

DOGE Long 7xA+ Setup
Entry $0.2204
Entry below 200EMA hourly chart
SL $0.21
Target $0.02515 Sell 100%
B/E After closing above 200 on hourly
Risk 4/10

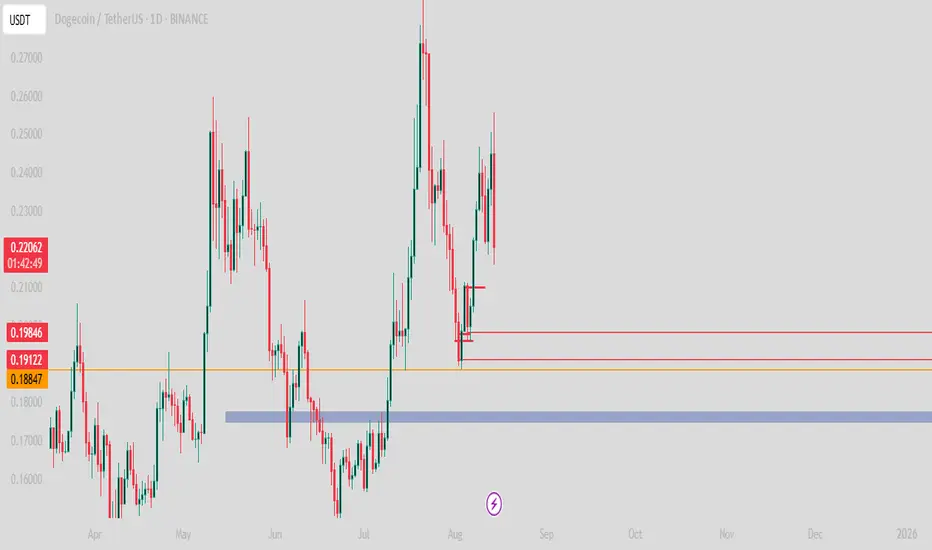
#DOGE/USDT | Eyes Bounce from Key Support !#DOGE
The price is moving within an ascending channel on the 1-hour frame, adhering well to it, and is on its way to breaking strongly upwards and retesting it.
We have support from the lower boundary of the ascending channel, at 0.1930.
We have a downtrend on the RSI indicator that is about to be broken and retested, supporting the upside.
There is a major support area in green at 0.1895, which represents a strong basis for the upside.
Don't forget a simple thing: ease and capital.
When you reach the first target, save some money and then change your stop-loss order to an entry order.
For inquiries, please leave a comment.
We have a trend to hold above the 100 Moving Average.
Entry price: 0.2060.
First target: 0.2111.
Second target: 0.2183.
Third target: 0.2264.
Don't forget a simple thing: ease and capital.
When you reach the first target, save some money and then change your stop-loss order to an entry order.
For inquiries, please leave a comment.
Thank you.

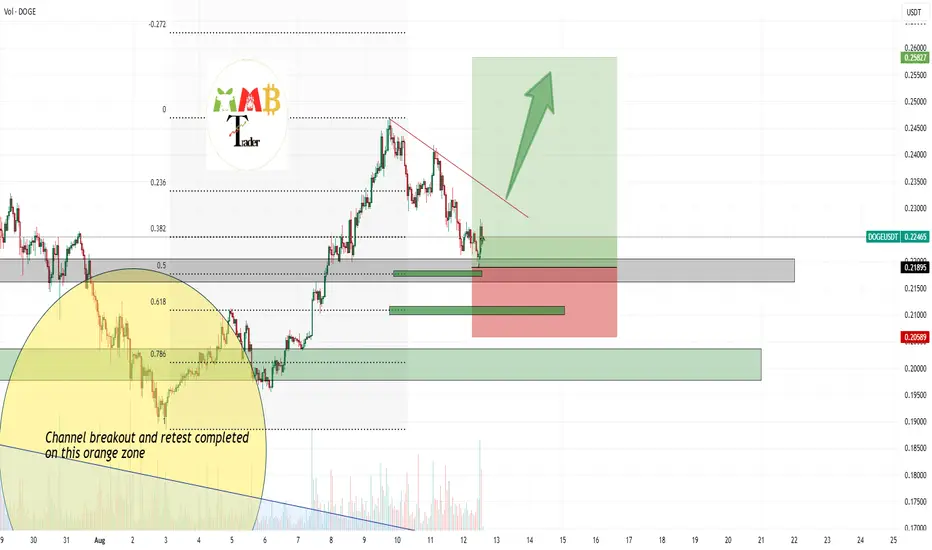
DOGEUSDT to the moon(1$ is not Far)Wow such a good chart we have here the channel breakout and also retest of breakout is completed and i am thinking about easy path non stop pump here to the moon for CRYPTOCAP:DOGE holders now.
price test 0.61 Fibonacci support level and the market here was healthy and all leverage players are mostly kicked now and we are ready to go to at least 0.32$ for next month and then more pump and rise to final targets.
DISCLAIMER: ((trade based on your own decision))
<<press like👍 if you enjoy💚

DOGEUSDT Short-term Buy on Major Fib support levels i am expecting ALT season soon start and also i think this time CRYPTOCAP:DOGE start to see huge gain so i am entering this trade at one of the most important Fibonacci support levels which is 0.5 Of Fib retracement and i put my stop loss below the 0.61% fib level which if it break market can see more dump then.
Target is also 3 times more than stop loss because this is how trade should be in my view.
DISCLAIMER: ((trade based on your own decision))
<<press like👍 if you enjoy💚
DOGE may face a Major Correction Old memes are getting forgotten more and more as thousands of new, funnier ones with even greater potential pop up every day. DOGE may still be climbing right now, but if you look closely, the chart is looking pretty sad at the moment. That said, the long-term potential is huge — it just needs time.
Here’s the breakdown:
➡️ The first thing that stands out is the large number of gaps above. When the price was dropping, it did so sharply. And as we know, 99% of gaps get filled sooner or later — just probably not right now.
➡️ Volume — divergence with price. Buying volumes keep declining while the price is moving up. This type of trend is usually considered weak and unstable. In fact, buying volume is near its lows despite the overall market situation.
➡️ Money Flow — here we see harmony with price. Liquidity is still flowing in, but only in small portions, which of course isn’t enough. This shows that interest in the asset remains, but it’s not particularly strong at these price levels.
➡️ The price is also close to its yearly ascending trendline support, which could spark a rally — but that seems unlikely. More likely, I expect a long squeeze below support, leading to complete disappointment in DOGE, followed by a slow accumulation phase and an eventual move up once everyone has stopped caring.
📌 Conclusion:
Right now, I prefer not to touch DOGE at all — even in futures. But trust me, this little guy’s moment will come.

DOGE -1D GOLDEN CROSS: CAN IT SPARK THE NEST RALLY ?
Dogecoin (DOGEUSD) just formed its first 1D Golden Cross in 9 months. The last one (Nov 5, 2024) came right before a major Bullish Leg within the 2-year Bullish Megaphone pattern.
Historically, these moves have peaked near the 3.618 Fibonacci extension from their respective lows. If history repeats, DOGE could target around $1.15 before year-end.
