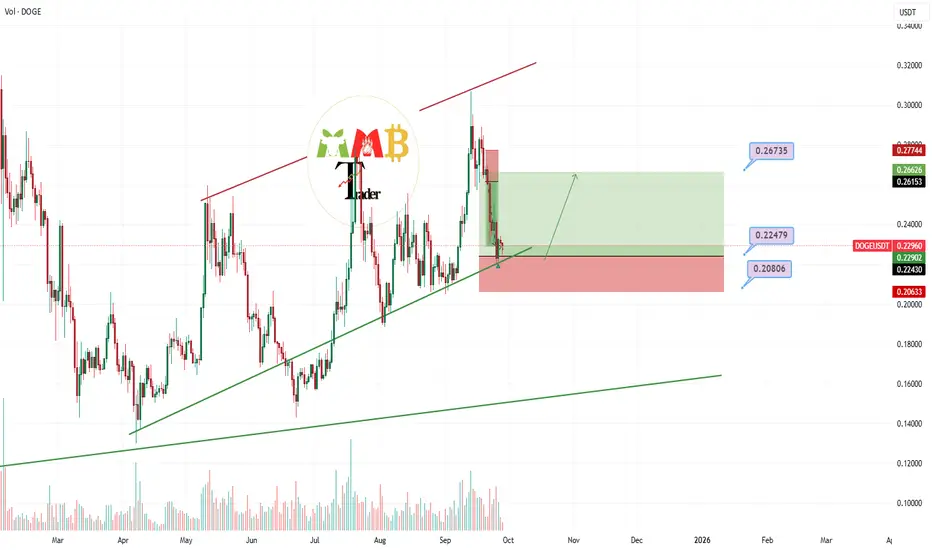
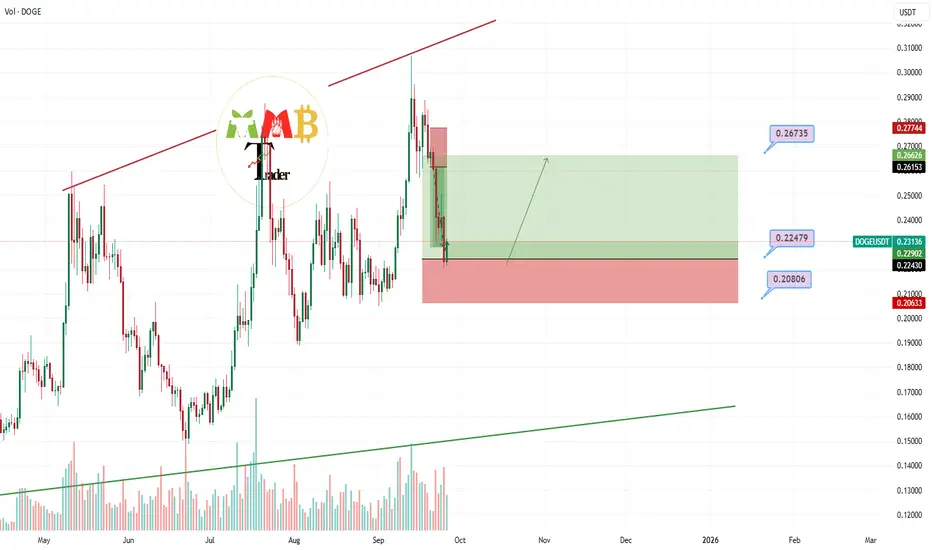
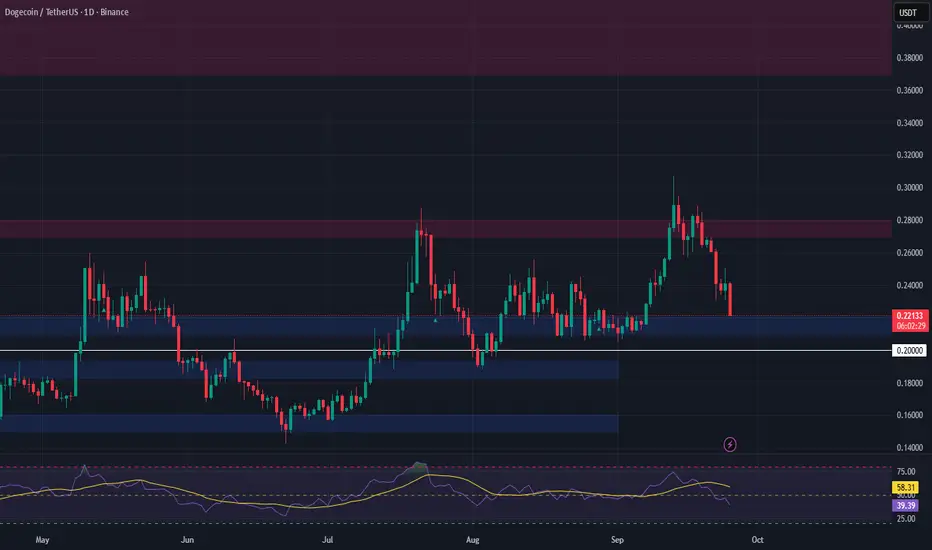
DOGE/USDT Long Setup, Bounce From Trendline Support Toward 0.31DOGE is respecting a strong ascending trendline that has held since July. Price has recently tested this support zone around 0.23 and bounced higher, showing bullish momentum. As long as DOGE stays above 0.23, the bias remains positive.
The next key resistance lies near 0.27, with an extended target toward 0.30–0.31. This aligns with previous swing highs and Fibonacci levels.
📌 Entry: 0.238 – 0.245
🎯 Targets:
TP1: 0.270
TP2: 0.295
TP3: 0.310
🛑 Stop Loss: 0.220
Risk-to-reward ratio is favorable, with clear invalidation below trendline support. A daily close under 0.220 would invalidate the setup.
DOGEUSDT.P trade ideas

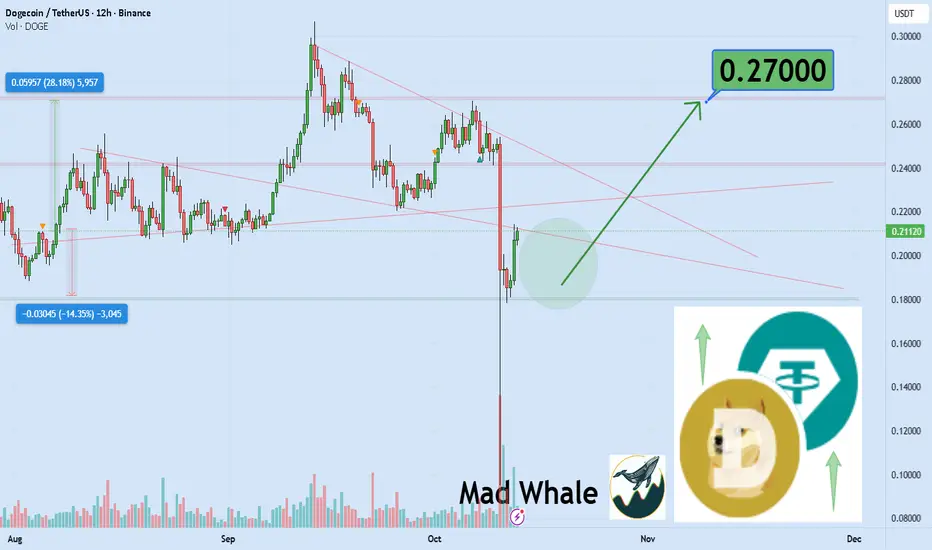
Dogecoin OUTLOOK Dogecoin Breaks 1hr resistance , that is a good Bullish signal to go long targeting daily order block
0.27$ is next target for Doge hi
the support and resistances on the chart are based on the previous data and weekly candlesticks if COINBASE:DOGEUSDT holds this last support the potential of 28% gain is logical toward 0.27$
DOGE Hidden Bullish Divergence Faces $0.22 RiskBINANCE:DOGEUSDT ’ price may be cooling off after a volatile week. On the 4-hour chart, DOGE is holding an ascending support line within a rising wedge. Between September 30 and October 7, price made a higher low while RSI made a lower low — a hidden bullish divergence that often signals weakening seller strength and a possible rebound.
As long as the $0.246 support holds, DOGE could aim for $0.257, $0.270, and $0.278. A close below the trendline, though, would shift bias back to bearish, exposing $0.234 and $0.226. The structure still leans cautious, with any small negative catalyst able to trigger another dip.
On-chain data supports mixed sentiment. Whales added about 130 million DOGE since October 2, showing quiet buying, but exchange balances climbed to 17.7% — a level that’s historically marked major corrections. DOGE’s short-term setup favors a rebound attempt, but $0.22 remains the key risk zone if buyers fail to hold the trendline.

DogeusdtAgain same construction double bottom on the air
It will kiss the cloud . Just wait this year will be crazy .
Targets on the 📈📈📈📉📉📉📉
#btc #altseason #meme

DOGE’s Rally Faces Risk as Bearish Divergence EmergesDespite DOGE’s double-digit gains over the past two weeks, its Chaikin Money Flow (CMF) indicator has slipped into negative territory, signaling weakening capital inflows. This forms a bearish divergence, where price continues to rise while money flow declines — a classic sign of fading momentum.
If buying activity doesn’t pick up soon, this divergence could precede a short-term pullback, suggesting that DOGE’s current uptrend may be losing strength.


DOGE/USDT: Bullish Jump to 0.3170? BINANCE:DOGEUSDT is gearing up for a bullish move on the 4-hour chart , with an entry zone between 0.2575-0.2637 near a key support and breakout level.
The target at 0.3170 aligns with the next resistance, offering strong upside potential. 📈 Set a stop loss on a close below 0.2420 to manage risk effectively. 🌟
A break above 0.2650 with solid volume could trigger this jump, driven by meme coin hype and market momentum. Watch BTC trends! Entry is good even right now with proper risk management. 💡
📝 Trade Plan:
✅ Entry Zone: 0.2575 – 0.2637 (support + breakout area)
❌ Stop Loss: Daily close below 0.2420 to manage risk
🎯 Target: 0.3170 (next resistance)

$DOGE Analysis🚨 CRYPTOCAP:DOGE Analysis 🚨
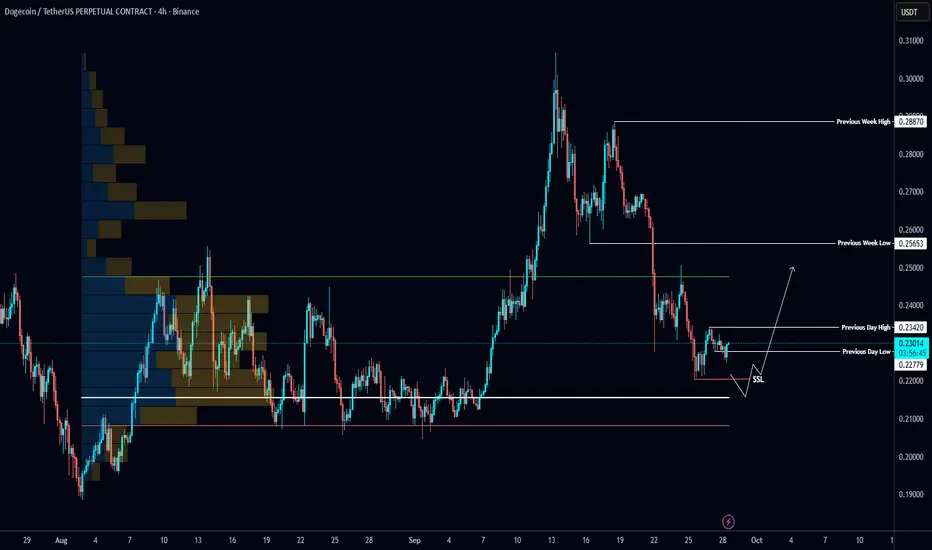
Watching for a sweep of sell-side liquidity first 👀
If price taps the POC level and shows a bullish setup, I’ll be looking for longs ✅
Local accumulation down here could set up a really clean play 🚀
DOGE the Buy signal soon will hit targetThe chart is clear and we are near major daily support zone + 0.5 Fibonacci support here all can pump the price easily to above 0.3$ once again and our target is definitely easy to hit if our support hold strong.
DISCLAIMER: ((trade based on your own decision))
<<press like👍 if you enjoy💚
DOGE 1D Analysis - Key Triggers Ahead❄️ Welcome to the cryptos winter , I hope you’ve started your day well.
⏰ We’re analyzing BINANCE:DOGEUSDT on the 1-Day timeframe .
👀 Daily timeframe on Dogecoin shows it’s moving inside a strong ascending channel. Right now, price is sitting below the midline resistance of the channel, while holding support from an uptrend line. DOGE is in a decision zone, and because it’s the weekend, volume has dropped. Breaking out of the structure it has formed may happen with the new weekly open.
If Dogecoin loses the trendline support, it can head toward the bottom of the channel at $0.17. If it breaks the resistance it’s reacting to, price could move toward the top of the channel at $0.30, and even break to higher levels.
🧮 RSI shows two key zones the 70 level acts as resistance and marks entry into OverBuy, and the 38 level is a static support zone. If price crosses below that 38 level, short-side volatility can increase heavily and push RSI into Oversell.
🕯 Candle size and volume behavior from the start of the channel show volume and candle size decrease near the top and increase near the bottom. Right now, because price is at the midline area, it has rejected this level with a stronger red candle and bigger volume, moving lower. For price to move back above the midline and break that resistance, we need to see an increase in buying volume and larger bullish candles so a trend reversal can form toward higher resistances.
💸 BINANCE:DOGEBTC pair shows price moving along an ascending trendline similar to the DOGE/USDT pair. This trendline acts as a confluence: every touch so far has pushed price upward. Now we are on the fourth touch. If the daily candle closes below this trendline, a deeper correction can happen and push Dogecoin to lower support areas.
🧠 For trading DOGE, patience is needed and we should wait for higher timeframe candle closes. Once price confirms at the marked levels, the new trend and breakout from current structure will be clear and we can open positions. That gives us two possible scenarios:
1️⃣ Short position scenario : Break and close below the trendline that overlaps on both DOGE pairs, RSI dropping under the 38 zone, volume increase, and a confirmed breakout from the current structure on multi-timeframe view.
2️⃣ Long position scenario : A reaction from the overlapping trendline support on both pairs, RSI holding above the 38 zone, then a break of the nearest multi-timeframe resistance to build a higher low and higher high. If that plays out, I’ll update this scenario.
❤️ Disclaimer : This analysis is purely based on my personal opinion and I only trade if the stated triggers are activated .

dogeusdt longfirst of all im long on all cryptos my life saving is in this bitch.
fed just started lowering interest rates so liquidity is gunna start flowing in all risk assets
i got like 10 k in doge im expecting at least 200 %% gains im patient illl just let it cook
2. its making higher lowes on the weekly just hit the 21ma which is the buy zone i see it pumping form here
3 we just hit the 20s on the fear and greed index and when everyone is bearish im bullish
4. all the moving averages are getting tight.
im always bullish but im not scared time in the market....
invest safly my friends lets get this bread got bless

Doge futurei have removed old lines and have extended my bottom green lines of support, dark being super buys, and light greens being good buys. i have also shifted my white random line to be more along the neck and shoulder that has formed over the time. i am no finacial person, just a random guy that is just having fun, dont take this as concret and nothing is in stone. however, i will say that "if" there is a crash, i will be hoping in on the buy side to ride it back up. as the only way it fails is if the world its self says no more market, but humans are greed filled flesh bags, hahahahahaah

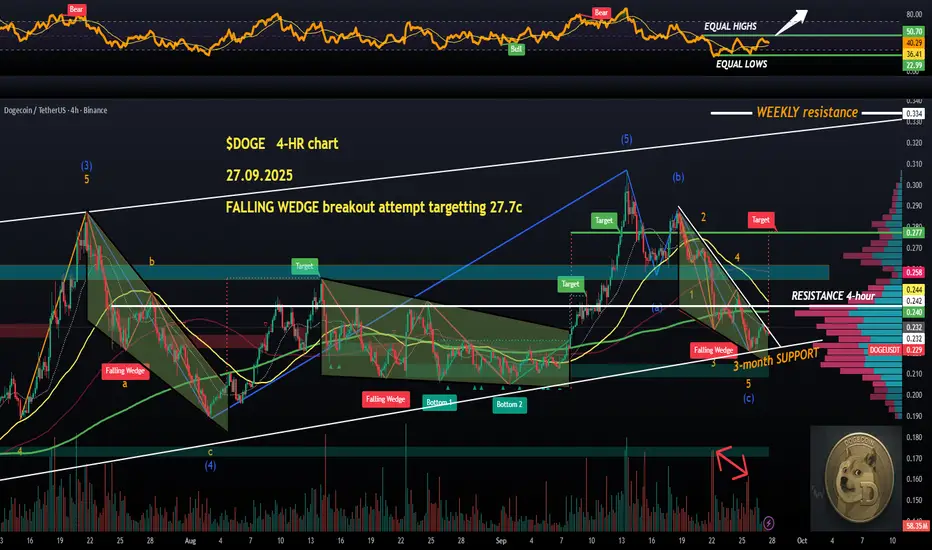
$DOGE attempting a FALLING WEDGE BREAKOUT targetting 27.7cCRYPTOCAP:DOGE has been attempting a FALLING WEDGE breakout all day long and I have mixed feelings about longing the break.
First of all, falling wedges are dominating the 4-hour timeframe, this is the 3rd one in the last two months, the previous ones quickly HIT their targets.
But, we are about to see a DEATH CROSS (yellow 50 MA to cross below green 200 MA), CRYPTOCAP:DOGE is hitting lower highs and lows (although, RSI has been hitting equal lows and highs, BULLISH divergences).
The selling volume has decreased on that last low, and this is a text-book seller capitulation behaviour.
So, even if the wedge BREAKOUT happens this weekend, the volumes are likely NOT going to be big enough to confirm the reversal. In fact, I would expect such a breakout to fail.
The resistances directly overhead (dynamic MAs I mentioned death-crossing plus the horizontal (white) resistance around the 24cent mark...
This breakout will need proper volumes, I would rather look for a short after a potential post-breakout rejection tbh ($0.240-0.245).
Staying put, this looks promising especially just after a bounce from the 3-month old ascending trendline support, but the timing has to be right, not this weekend I think💙👽
🔑 Summary
RSI BULL divergence = momentum base forming.
Price wedge = bullish reversal structure.
Volume = capitulation done, waiting for breakout energy.
👉 Bias = bullish breakout setup, but invalidation = break of 3-month support.
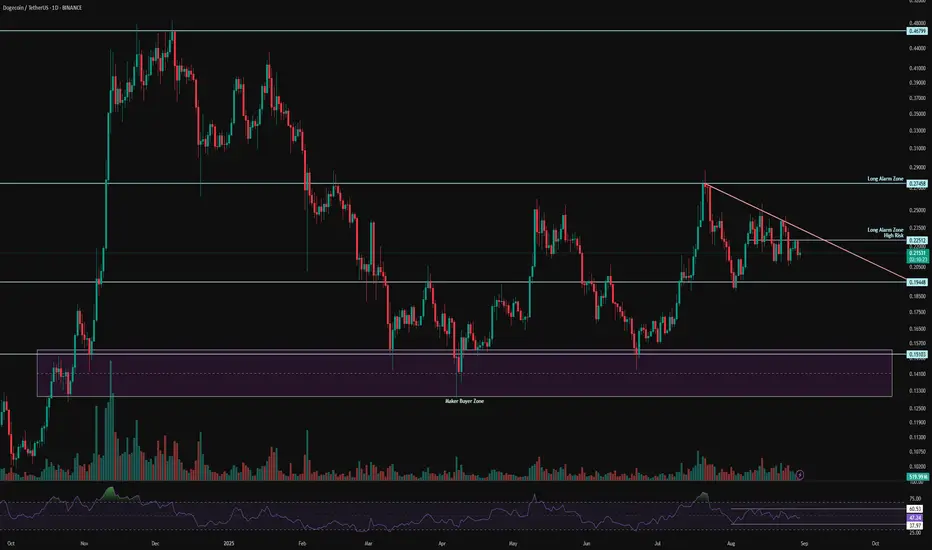
DOGE 1D Analysis – Key Triggers Ahead💀 Hey , how's it going ? Come over here — Satoshi got something for you !
⏰ We’re analyzing DOGE on the 1-Day timeframe timeframe.
👀 In the daily timeframe of Dogecoin, DOGE is within a 170-day box with a ceiling at $0.27 and a floor at $0.15. With a breakout of this box, Dogecoin can experience a parabolic move. DOGE is currently in a triangle-like compression, and with an exit from this compression, DOGE can start its upward movement.
💰 In the daily timeframe of DOGEBTC , We observe that the volume has significantly decreased, and much less Bitcoin is being converted into DOGE! This is quite interesting. The reason DOGE has a box-like behavior against Tether is due to its pairing with Bitcoin. Bitcoin has gained more value against Dogecoin, and DOGE has entered an accumulation phase. Breaking out of this box can help DOGE experience a price jump.
⚙️ Two key RSI zones have been considered: 60 and 38. Exceeding these levels can help DOGE break out of the compression. The 60 level coincides with the break of the $0.22 area and the top of the compression.
🕯 There is a micro buyer zone around $0.15, where every time the price reaches this area, a reversal occurs, accompanied by an increase in the size and volume of green candles. Currently, during the holidays, we are in a compression with lower volume. As the new week begins, we need to see what happens next.
🔔 The alarm zone for Dogecoin is $0.22, which can present some risky trading opportunities, and the next zone is $0.27, which is a strong price action level. Breaking this ceiling can allow DOGE to reach higher recovery levels against Bitcoin.
❤️ Disclaimer : This analysis is purely based on my personal opinion and I only trade if the stated triggers are activated .
Lingrid | DOGEUSDT Buy at Potential Demand ZoneBINANCE:DOGEUSDT is testing the critical support level around 0.22900 after a significant -28% retracement from its recent highs near the resistance zone. The price action shows a completed triangle pattern breakout that led to bullish momentum, followed by a corrective move that has brought the pair back to test the lower boundary of the trading range. A sustained hold above the 0.22000 psychological level could signal renewed buying interest and potential for another leg higher toward the resistance zone.
💡 Risks:
Break below 0.22000 support could trigger further downside toward the 0.18810 price rebound level
Triangle pattern failure if price cannot reclaim higher ground within the established range
Broader crypto market weakness could pressure DOGE regardless of technical setup
If this idea resonates with you or you have your own opinion, traders, hit the comments. I’m excited to read your thoughts!

DOGEUSDT – TECH SHORT SELL CALL BY THE CHART ALCHEMIST | 1-HOUR DOGEUSDT – TECH SHORT SELL CALL BY THE CHART ALCHEMIST | 1-HOUR TF
27 SEPT 2025 | 14:00 GMT
The coin is moving in a bearish channel (marked in light blue), having recently touched a retest level of previous breakdown on the bearish side. We expect the crypto coin to move further downwards and achieve a couple of bearish targets.
📢 Technical Analysis by Mushtaque Muhammad (The Chart Alchemist)

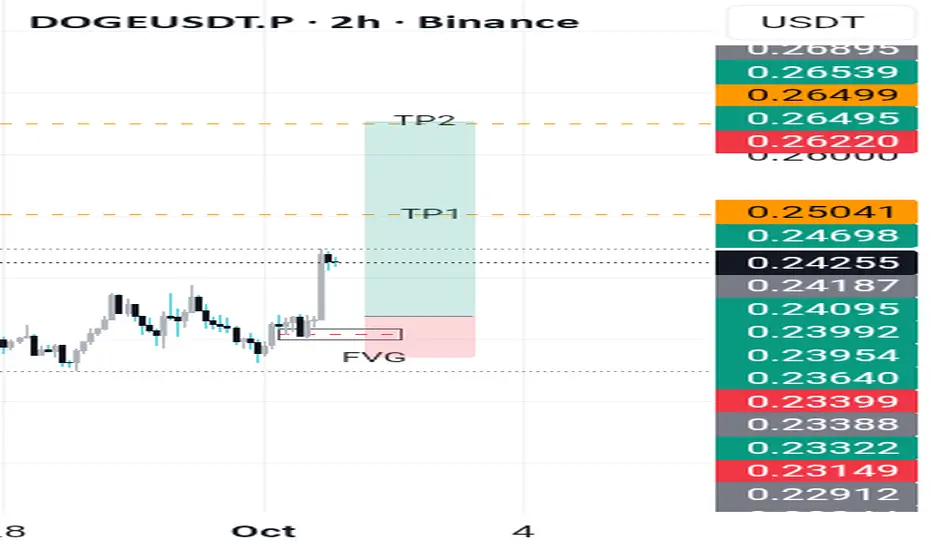
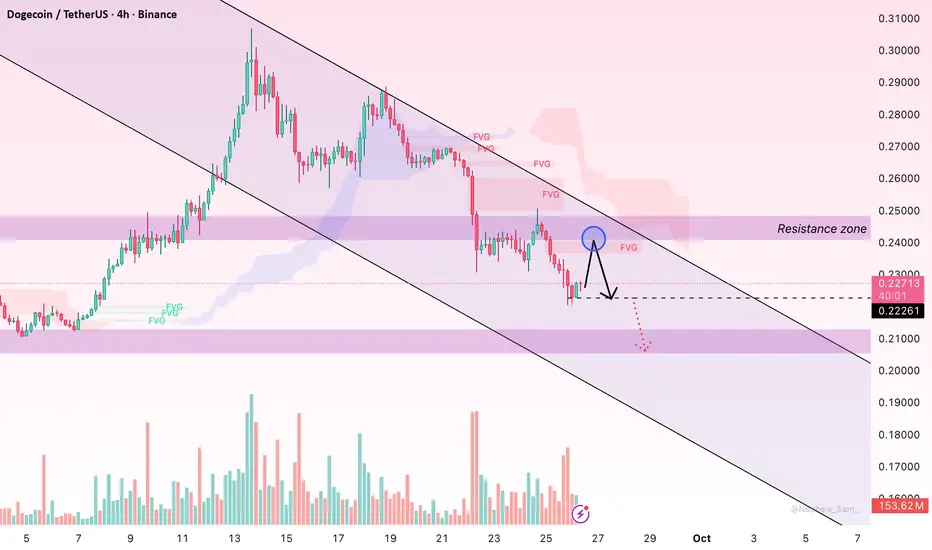
Macro Pressure Weighs on DOGE, Further Decline PossibleHello everyone, DOGE/USDT has just slipped from 0.228 to 0.224 and is now trading around 0.2277, reflecting a corrective move after the recent strong rally.
The main driver comes from the broader crypto market, which is currently experiencing profit-taking after gains in Bitcoin and major altcoins, leading to selling pressure on Dogecoin. At the same time, macroeconomic factors are also weighing heavily: investor caution around the Federal Reserve’s monetary policy, USD interest rates, and regulatory announcements in the crypto space have all shifted market sentiment to a more defensive stance, contributing to DOGE’s pullback.
Additionally, previous Fair Value Gaps (FVG) left imbalances that, once retested, can generate short-term selling pressure.
Against this backdrop, bearish momentum remains dominant for DOGE. It is highly likely that DOGE will move down to retest support at 0.22000 USD . If buying interest fails to hold this level, a deeper decline towards 0.21000 USD or even lower cannot be ruled out, highlighting the strong influence of macro news and overall market trends on Dogecoin in the short term.
DOGEUSDT time to add some long near 0.22 support zoneAs we can see on the chart previous short closed and hit targets now we can expect local pump here at least to the targets like 0.27$ also then red trendline is major resistance and if it breaks we can expect 0.4$ But we should consider the correction for next weeks too that may happen if BTC drop below 100K$.
DISCLAIMER: ((trade based on your own decision))
<<press like👍 if you enjoy💚
To much DOGE talk on the timelineI'm bullished on alts in general, but I've heard to much about DOGE in the last couple days. It's not going to pump again until everyone gets quite. You will get a good buying oppertunity under 20 cents. I believe DODGE will head towards $1 after that.

DOGEUSDT Slightly Up, Targeting New HighsIn recent days, DOGEUSDT has seen a slight increase, recovering after hitting its lowest point in several weeks. The growth of DOGE is mainly driven by buying activity at lower levels and improved market sentiment, although the USD remains strong due to positive economic data from the US.
The DOGEUSDT chart is currently trading within a clear upward price channel . The price has found strong support at 0.1950 and is showing signs of recovery. If DOGE can continue to break through the resistance at 0.2730, there is a high likelihood of reaching the target of 0.2730 or higher in the short term.
DOGEUSDT has the potential to continue rising due to the current recovery and strong technical support. Keep an eye on market confirmation to capitalize on trading opportunities.

DOGE — Watching for a Relief Bounce from SupportDogecoin has pulled back into a key support zone at $0.21–$0.22, a level that has historically acted as both resistance and support. With the broader market showing signs of consolidation, this area could offer a short-term bounce opportunity.
That said, this is likely a relief rally within a broader downtrend, so managing risk is critical. A failure to hold this support could lead to a deeper correction later this month.
🔹 Trade Plan:
• Entry Zone: $0.21–$0.22
• Targets: $0.27–$0.28, $0.37–$0.44
• Stop Loss: Below $0.20
This is a spot-only setup with an asymmetric risk-reward profile if the bounce materializes. Avoid overleveraging and stick to your plan.
Can #DOGE continue to rise?📊Can #DOGE continue to rise?
🧠From a structural perspective, a double bottom bullish pattern is forming on the daily chart, though its ideal target hasn't yet been reached, so we can remain optimistic. We're currently near the neckline support zone. If we can stabilize there over the next period of time, we could potentially initiate a new uptrend.📈
➡️If we fail to stabilize at the neckline support zone, the next support level to watch is around 0.243, with extreme support around 0.2046.
🤜If you like my analysis, please like 💖 and share 💬
BITGET:DOGEUSDT.P
