DOGE/USDT | Dogecoin Bulls Eye $0.287, $0.32, and Beyond! (READ)By analyzing the Dogecoin chart on the daily timeframe, we can see that, as expected, the price was supported around $0.21, which brought strong demand. This move gave nearly a 20% return, hitting the target at $0.24, and the momentum is still strong. I believe the next target at $0.287 could be reached soon.
The key supply zones are $0.264–$0.289 and $0.305–$0.34. Based on the main analysis, the next possible targets are $0.287, $0.32, $0.41, and even $0.70.
Please support me with your likes and comments to motivate me to share more analysis with you and share your opinion about the possible trend of this chart with me !
Best Regards , Arman Shaban
DOGEUSDT.P trade ideas

dogeBased on the broader market structure and DOGE/USDT’s recent price action, we are forecasting a potential short setup as price tests a key trendline resistance.
The daily chart shows overbought candles and a notable volume spike, suggesting a possible pullback.
This analysis is time-sensitive and shared for educational purposes.
Always Do Your Own Research (DYOR) before entering any trade.

Long DOGEDOGE has just broken the resistance trendline and is retesting it.
Long set-up is as in chart.
Disclaimer:
This analysis is based on my personnal views and is not a financial advice. Risk is under your control.

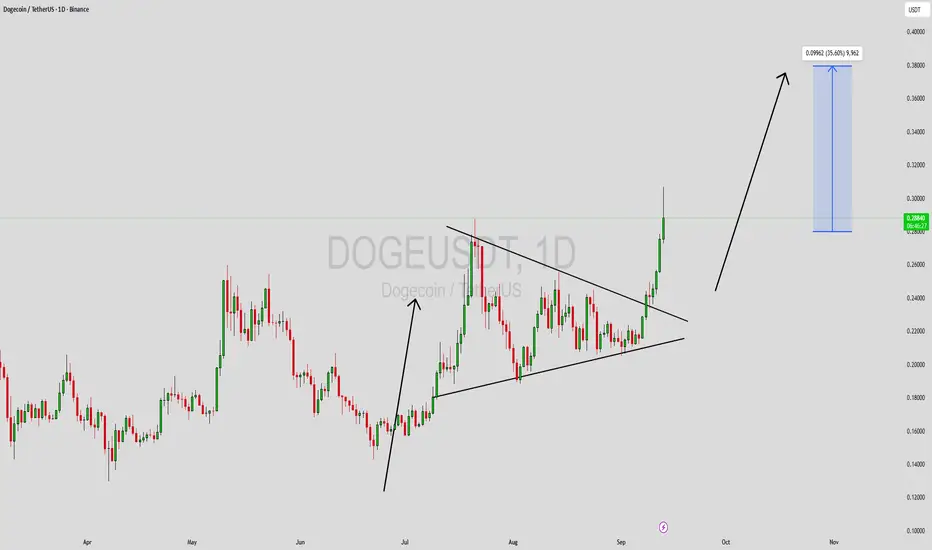
DOGEUSDT Forming Bullish WaveDOGEUSDT is currently forming a bullish wave pattern, signaling strength and potential upside momentum. The price action has been supported by good trading volume, indicating active participation from buyers and growing interest in this asset. This setup suggests that a breakout move could push DOGE toward higher resistance levels in the short term.
With expectations of a 30% to 35% potential gain, DOGE is well-positioned for traders looking for medium-term opportunities. The bullish wave formation often reflects strong accumulation phases before a decisive upward push, making this a key moment to monitor price action closely.
Investor sentiment is also turning positive as DOGE continues to attract both retail and institutional attention. If momentum holds and market conditions remain favorable, DOGE could deliver a strong rally that aligns with the projected technical targets.
✅ Show your support by hitting the like button and
✅ Leaving a comment below! (What is You opinion about this Coin)
Your feedback and engagement keep me inspired to share more insightful market analysis with you!
Beware the $DOGE Drop: Critical Insights BINANCE:DOGEUSDT
Beware the CRYPTOCAP:DOGE Drop: Critical Insights
Entry: Marked at 0.30700 USDT, suggesting a potential buying point.
Take Profit (TP) Levels:
TP1: 0.28508 USDT
TP2: 0.26787 USDT
TP3: 0.25578 USDT
TP4: 0.20456 USDT
Stop Loss: Set at 0.33486 USDT, indicating a level to exit if the price moves against the trade.
DCA: Noted at 1.135 (0.32083) USDT, possibly a derived calculation or additional indicator.
Relative Strength Index (RSI):The RSI is currently at 89.20, which is in the overbought territory (above 70). This suggests the asset may be overvalued, potentially indicating a reversal or correction soon.
Analysis:The price is approaching the Entry level (0.30700 USDT) and is close to the Stop Loss (0.34486 USDT), which could indicate a critical decision point for traders.
The RSI being overbought (89.20) warns of a possible pullback, especially if the price fails to break past the Stop Loss level.
The Take Profit levels suggest a trading strategy aiming for incremental gains, with TP4 being the highest target at 0.20456 USDT.

DOGE is about to flyI will use the next dump to buy lots of BINANCE:DOGEUSDT.P
I'm highly convinced this will pump to new ath in the near future.


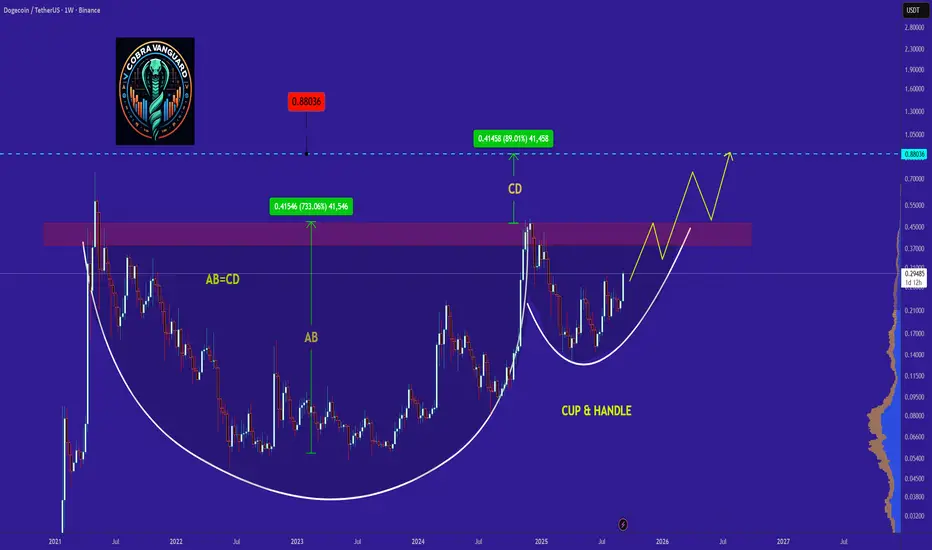
DOGE's Situation, A Comprehensive Analysis !!!It appears that the price is forming a cup and handle pattern, and if this occurs, it could push the price above $0.50.
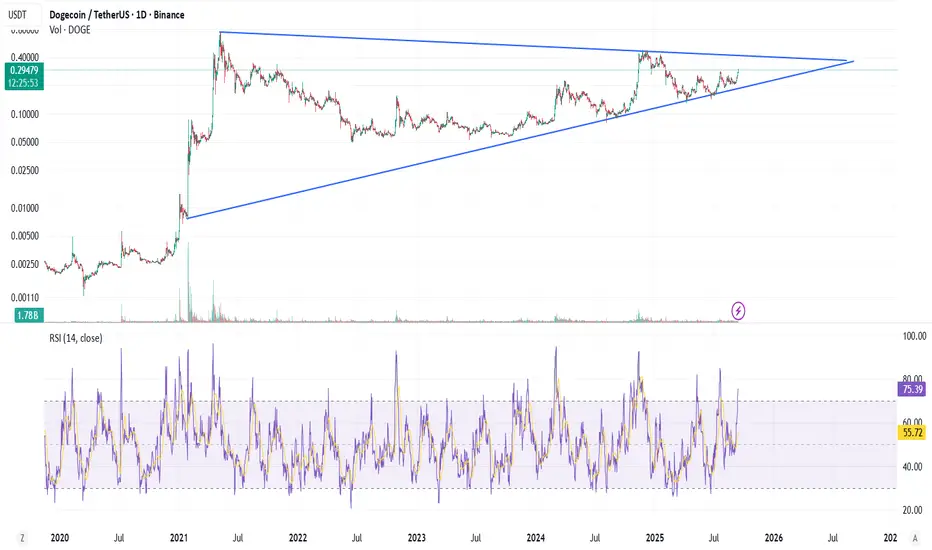
DOGE/USDT: Symmetrical Triangle Coils for a Major BreakoutThe DOGE/USDT pair is in a long-term symmetrical triangle pattern, a classic continuation pattern that suggests a significant price movement is imminent. This pattern is formed by a series of lower highs and higher lows, creating a narrowing trading range. The price is currently at a critical decision point, testing the upper resistance line of the triangle.
Key Technical Analysis:
Symmetrical Triangle Pattern: This pattern has been forming since mid-2020. The base of this triangle, from the low around $0.0011 to the high near $0.45, represents a massive price range.
Target Price Calculation: The standard way to calculate a target price for a symmetrical triangle breakout is to measure the height of the pattern's base and project it from the breakout point.
Base Height: The widest part of the triangle spans from approximately $0.0011 to $0.45, a difference of about $0.4489.
Breakout Point: A confirmed breakout would likely occur above the current resistance level, which is near $0.295.
Target Price: Projecting the base height from the breakout point ($0.295 + $0.4489) gives us a long-term target of approximately $0.7439.
Potential Scenarios & Trade Plan:
Bullish Scenario: A decisive close above the triangle's upper trend line, ideally with a significant increase in volume, would confirm a bullish breakout.
Entry: A confirmed breakout and retest of the upper trend line as support.
Target: The first major target is $0.7439. Subsequent targets would be the all-time high and potential price discovery beyond that.
Invalidation/Stop-Loss: A move back inside the triangle or a close below the lower trend line would invalidate the bullish thesis. A tight stop-loss could be placed just below the breakout level.
Bearish Scenario: A breakdown below the triangle's lower trend line, particularly on high volume, would be a strong bearish signal.
GOGE/USD Eyes 0.30--Monthly High Zone Insight !DOGE/USDT has shown strong upward momentum following a major breakout from the recent consolidation zone, previously marked by a liquidity grab near the $0.22 area. This move was supported by a key Buyers Rejection Zone around $0.199, which acted as a firm support base.
📈 Price Action Highlights:
* The pair is currently trading around $0.281, up +2.15% for the session.
* Clear **breakout above resistance**, now pushing toward the Monthly High Zone.
* Price is targeting the $0.29591 level – a potential monthly high if bullish momentum continues.
* Minor resistance at $0.2875, with previous structure supports now at
S1: $0.2388,
S2: $0.2341,
S3: $0.2203.
🔍 Technical View:
* Recent price structure suggests a bullish continuation pattern.
* Breakout was followed by strong volume and momentum.
* Key supports have held well, especially the Buyers Rejection Zone, which may serve as a strong demand area on any re-tracement.
💭 Outlook:
With bulls in control and momentum accelerating, DOGE appears set to test the monthly high. However, traders should watch for reaction near the highlighted Monthly High Zone as it may trigger profit-taking or further acceleration depending on market sentiment.
This analysis is for educational purposes only and does not constitute financial advice. Always do your own research before making trading decisions.

DOGE Long Idea - MemecoinDOGE Swing Long Idea
📊 Market Sentiment
Market sentiment remains strongly bullish as the FED is expected to deliver a 0.25% rate cut, with speculation building for a possible 0.5% cut in September. Monetary policy shifts are being driven by both inflation trends and weakening labor market data. The latest August and September job reports were soft, signaling that the economy is cooling rapidly. This environment continues to fuel expectations for a major bullish run in the weeks ahead.
📈 Technical Analysis
Price recently broke and closed above the bearish trendline with strong bullish candles, confirming the breakout.
This is a key technical shift that aligns with my previous outlook. (I mentioned this scenario in my last DOGE analysis — check the linked idea for more context.)
📌 Game Plan
I entered the trade at $0.24841 immediately after the breakout confirmation.
📋 Trade Management
Stoploss: $0.22900
Target: $0.28779
💬 Like, follow, and comment if you find this setup valuable!
⚠️ Disclaimer: This content is for informational and educational purposes only and does not constitute financial, investment, or trading advice. Always do your own research before making any financial decisions.

DOGEUSDT DIn the daily timeframe, after a correction, I expect Dogecoin to rise toward the specified zone

Doge...Is a 50% Pump Coming?Hello guys!
Trend Structure:
The price is moving within a broad ascending channel, with both upper and lower boundaries acting as dynamic resistance and support. The midline (dotted blue) appears to function as a short-term pivot zone.
Recent Movement:
After a mid-July decline from around $0.29, the price found support just above $0.17 and has since rallied sharply, now trading around $0.2367.
Projection Shown in Chart:
The drawn black curved arrow suggests a potential short-term pullback from the current levels before resuming the uptrend toward the $0.314 resistance, which corresponds to the upper boundary of the channel.
Key Levels:
Immediate resistance: $0.24 – $0.25 zone
Major resistance target: $0.314
Immediate support: Around $0.21 (midline of channel)
The outlook here is bullish, assuming that the midline support holds during any pullback. A break and close above $0.25 would strengthen the likelihood of a move toward $0.31.

DOGE 1D – Testing $0.277 Liquidity After Strong RallyDogecoin has surged from support blocks, reclaiming both EMAs and running directly into the $0.277 liquidity target. Momentum is strong, but the Stoch RSI is maxed at 100, showing stretched conditions.
Upside:
A breakout above $0.277 would open room toward $0.30+.
Holding above EMAs would confirm trend continuation.
Downside:
A rejection here could lead to a pullback into the $0.22–0.20 zone, with the golden pocket at $0.189 as critical support.
Losing that area exposes $0.163 and the major liquidity pool at $0.142.
📊 Key focus: Can DOGE hold above EMAs and break liquidity at $0.277, or will stretched conditions send it back into support first?

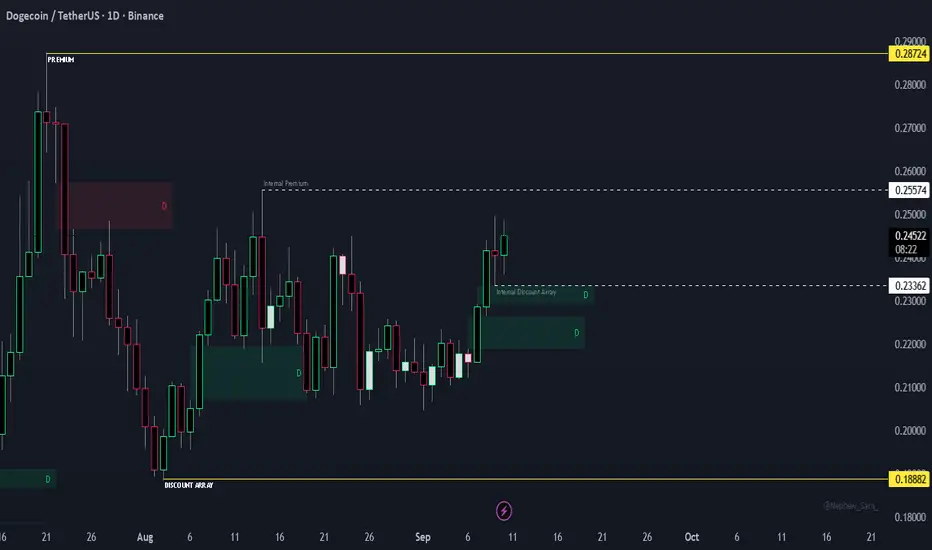
DOGE/USDT Respecting 4HR FVGDISCOUNT ARRAY
Price is respecting a 4HR FVG
Currently coiling / accumulating.
Low a possible liquidity grab?
🚩 Invalidation: If the supporting FVG breaks with a clear breakaway candle, this setup is void.

DOGEUSDTBINANCE:DOGEUSDT is now trading-renge in 0.2240$ resistance and 0.20800$ support.
I wait do to break any support and resistance for buy or sell.
Best support: 0.19100
Best resistance: 0.2450 - 0.26560 - 0.28200
⚠️ Please control risk management.

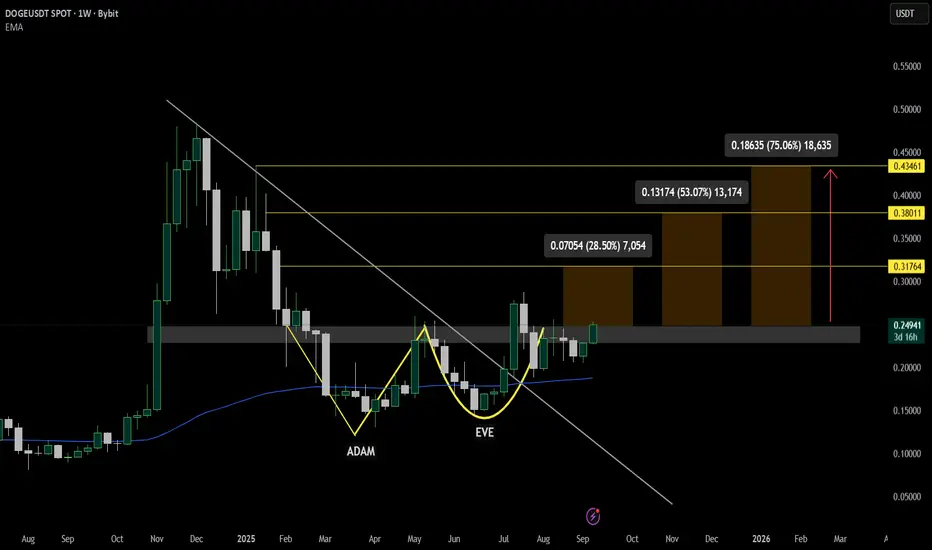
DOGEUSDT – Adam & Eve Pattern Targets $0.43CRYPTOCAP:DOGE on USDT market pair is gearing for a move upside after breaking out above the descending trendline.
With price forming an ADAM & EVE pattern, it going to provide an opportunity for bulls to obtain profits from a bullish rally with it now accumulating at pattern's neckline.
Key upside targets are marked at $0.317, $0.380, and $0.434,
As long as DOGE holds above $0.23,it remains bullish. A weekly close below this level would weaken the structure and could trigger a retest toward $0.20.
Doge - follow the trendDoge - follow the trend
Nearly 500m entered the market - follow it to make money

DOGE season is coming!The structure, price action, and catalysts all look incredibly bullish.
That’s why I rotated half of my CRYPTOCAP:PEPE stack into $DOGE. My overall target for this barbell distribution is a 3x from current levels.
⦿ Key Highlights
- Breaking out after a very long-term consolidation
- Breakout + retest seems complete
- Crypto may be entering the late bull phase
- Altcoins could soon enter the mania stage
- DOGE, as the top and most established memecoin, is well-positioned to lead the pack
- Treasury and ETF launches add strong tailwinds
- DOGE Digital Asset Treasuries (DATs) have started purchasing CRYPTOCAP:DOGE
- CleanCore bought $500M worth of DOGE this week, with another $500M planned in the coming weeks
- Rex-Osprey Dogecoin ($DOJE) goes live today
✅ What’s your read on this move?
Is this the real rotation to alts, or just another fakeout? Drop your take or send this to someone trading memecoins this week. 📢
⚠️ Disclaimer: Crypto products, NFTs, Memecoins are unregulated and can be highly risky. There may be NO regulatory recourse for any losses arising from such transactions.
This content is for educational and informational purposes only and does NOT constitute financial, investment, tax, or legal advice. Cryptocurrencies are highly volatile and speculative — you may lose part or ALL of your investment. I am NOT liable for your losses.
Please do NOT copy my trades. Always consult YOUR financial advisor before making any investment or trading decisions. Or at the very least, consult your cat. 🐱

Dogecoin Price Eyes 50% Rally on ETF FrenzyBINANCE:DOGEUSDT price trades near $0.249, pressing against the upper boundary of a symmetrical triangle. A daily close above $0.246–0.249 would confirm a breakout, opening the path toward $0.270, $0.287, and a measured target near $0.381. If momentum stalls, a move back under $0.224 would erase the bullish setup and risk a 10–12% pullback.
Charts show volume will be the key trigger — triangles can flip either way, and only strong buying flow secures continuation.
Supporting sentiment, whale wallets added 230M DOGE (≈$57M) in 24 hours, reflecting confidence in higher prices. The Dogecoin ETF ($DOJE) launch also fuels short-term hype. Still, the Net Unrealized Profit/Loss (NUPL) ratio has climbed to 0.36, a level that has previously led to sharp profit-taking dips.
It is important to watch $0.246–0.249 for confirmation — without volume and follow-through, bulls risk a trap.

DOGE/USDT Waiting for a Sweep of the PCL DAILYSweep of latest interim lows = scalp opportunity (shorter-term reaction).
Price failed to create new FVG off previous FVG. Failing to create new displacement out of the prior FVG is the source of the weak leg. We now need a sweep of the Prior Candle Low (PCL). This clears the liquidity sitting under the most recent leg—interim liquidity inside the structure. Sweeping this might trigger a bounce.
👉 So if you want a higher-probability setup, you wait for the sweep of the first bar that caused the FVG imbalance. That clears the true liquidity pool. you can treat it as a scalp trigger if you’re looking for smaller plays.
Key points:
FVG leg = imbalance created.
PCL sweep = liquidity grab + stop run.
After the sweep, look for rejection/market structure shift on a LOWER TIME-FRAME to confirm entry.
No sweep → no trade.
🚩 Invalidation: If the supporting FVG breaks with a clear breakaway candle, this setup is void.
DOGEUSDT.P 1WDOGE Update
Key Level: $0.27
Pattern: Double Bottom & Triangle
Bullish Target: $0.50 (on breakout)
Action: Watch for volume on a break above $0.27.
DYOR & NFA
