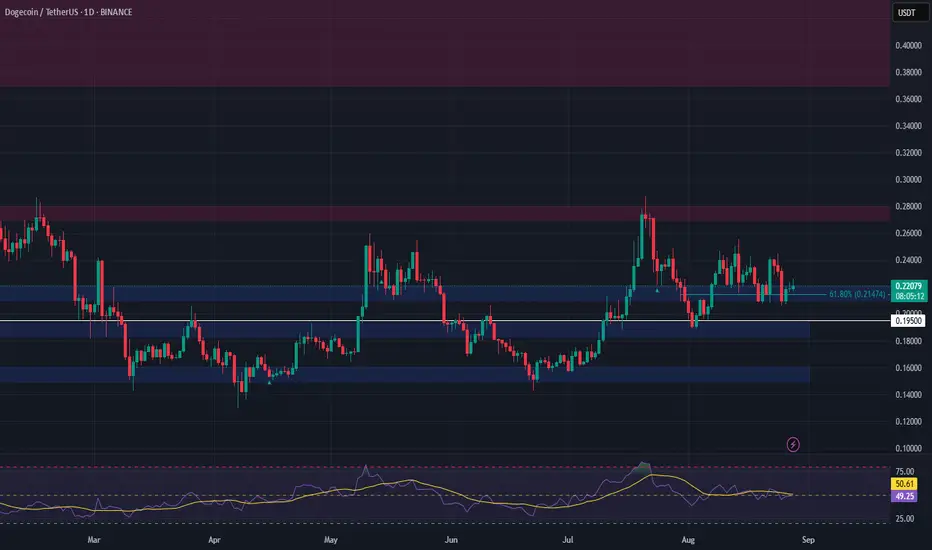
DOGE Setup – Fibonacci Confluence LongDogecoin (DOGE) has pulled back to a crucial support area around $0.21–$0.22. This zone aligns with the 61.80% Fibonacci retracement and the lower boundary of its recent range—a confluence that often marks potential turning points and strengthens the case for a rebound.
Trade Setup:
• Entry Zone: $0.21 – $0.22
• Take Profit Targets:
🥇 $0.27 – $0.28
🥈 $0.375 – $0.44
• Stop Loss: $0.195
DOGEUSDT.P trade ideas
$DOGE Squeeze IncomingCRYPTOCAP:DOGE is currently showing a promising structure, trading within a rising wedge formation. Price is holding above a rising support line, which has been respected multiple times, a good sign of bullish intent from buyers.
Above, we have a descending resistance line and a key horizontal supply zone acting as a strong barrier. For DOGE to see a breakout and push higher, it needs to flip this confluence zone cleanly.
DYOR, NFA

Thanks For Playing. Doge to the MoonBelieve me when i say this, this is your last time that you will ever see in this price range. Buy now with all your might and you will earn riches like a king in the jungle.
Lets GO DOGE!

DOGE IN SHORT TIME Hello friends
After the good growth we had, you can see that the price has dropped the same amount and has not broken the support range validly, and it just wanted to collect the liquidity below this support and then formed an ascending channel, which if the price channel breaks, can move to the specified targets.
*Trade safely with us*

Dogecoin (DOGE): 3 Potential Trades That Can Be TakenWe are looking for a proper break of structure on DOGE, following a recent upside movement from 0.208 that initiated the trend reversal; however, the price is currently stuck below the EMAs.
We are looking for a proper breakout from here, which would then open for a long trading setup opportunity.
Swallow Academy

DOGE's Situation, A Comprehensive Analysis !!!It appears that the price is forming a cup and handle pattern, and if this occurs, it could push the price above $0.50.
PREVIOUS ANALYSIS
Best regards CobraVanguard.💚

DOGEUSDT 15M – Supply Rejection, Bearish Move Unfolding
Dogecoin has tapped into the supply zone near $0.2260 – $0.2280, showing a clear rejection and failure to sustain above $0.2214. Price is now rolling over, indicating sellers are stepping in strongly.
🔑 Key Technical Levels
Supply Zone (Resistance): $0.2260 – $0.2280 → Fresh rejection confirms bearish pressure.
Immediate Support: $0.2147 → A minor demand zone and short-term reaction point.
Deeper Demand Zone: $0.2072 – $0.2060 → Strong historical support where buyers previously stepped in.
📉 Bearish Outlook
If DOGE fails to reclaim $0.2214, momentum favors the downside.
Price is likely to test $0.2147 first.
A breakdown below this level exposes the major demand zone at $0.2072 – $0.2060.
This zone could act as the next liquidity pool for buyers.
📈 Bullish Invalidation
A strong recovery and close above $0.2214 would invalidate the bearish scenario.
Only then can DOGE attempt another retest of the $0.2260 – $0.2280 supply area.
📊 Market Context
Recent bounce into supply lacked strong volume follow-through, suggesting weaker buying interest.
The overall structure on the 15M chart favors sellers unless $0.2214 is reclaimed.
✅ Trading Plan
Bearish traders: Look for short setups below $0.2214 with targets at $0.2147 and $0.2072.
Conservative traders: Wait for a confirmed break below $0.2147 before entering shorts.
Risk management: Place stops above $0.2225 (just beyond the rejection zone).
📝 Summary
DOGE is showing weakness after rejection from supply. As long as it trades below $0.2214, the bias remains bearish with downside targets at $0.2147 and $0.2072. Only a breakout above $0.2214 would flip the short-term outlook bullish.

DOGECOIN Looks Bearish (1D)It seems that Dogecoin is preparing for another decline. A bearish trendline has formed, and the candles are moving below this trendline.
Based on the ABC structure, it appears that Dogecoin is pulling back into the red zone to gather more sell orders for a deeper drop.
It is expected that upon touching the red box, the price will move toward lower levels.
The targets are marked on the chart.
A daily candle close above the invalidation level will invalidate this analysis.
For risk management, please don't forget stop loss and capital management
When we reach the first target, save some profit and then change the stop to entry
Comment if you have any questions
Thank You


DOGE 8H – Golden Pocket Retest Under Trendline ResistanceDogecoin is sitting inside the Fib Golden Pocket, testing demand while trading below trendline resistance.
Bullish path: A reclaim above the 0.5 Fib could spark continuation, with buyers challenging the descending trendline.
Bearish path: Rejection here risks a deeper move into the 0.618–0.786 range, with the demand box in focus around 0.19.
Stoch RSI oversold adds confluence for a potential reaction — but trendline resistance remains the key barrier.

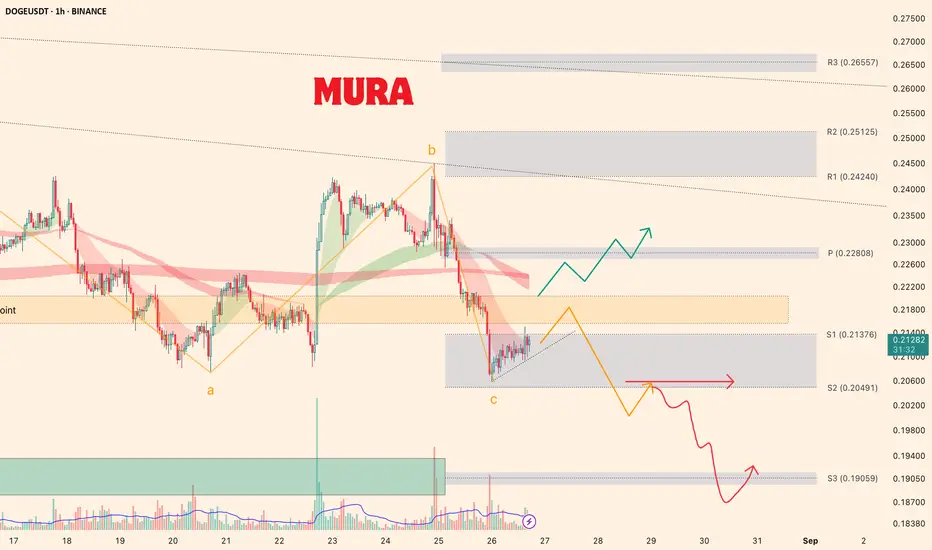
Weekly trading plan for DogeThe structure is shifting bearish, with lower highs and lower lows forming a prolonged ABC correction. The price has now moved back below the monthly pivot point. Previously, it managed to reclaim this level and show some growth, but at the moment the picture is as follows:
The price may face resistance from the monthly pivot point when attempting to break higher, leading to a move toward the support zone and S3 at 0.19 .
If the price manages to consolidate above the monthly pivot point, we could see continued growth with a target of updating the high at 0.255 .
dogeusdtIf the lower support line is broken, a pullback can be entered to this support line, which has now become resistance. The target is clear in the image, and if it breaks, the main TP will be the bottom of the channel.

My love for Doge, this is whyIn this picture I explained why I see Bullish movement and why my entry point is what it is in key detail, COINBASE:DOGEUSD always showed love to me of long-term holding therefore I'm explaining to the world how doge is so nice to me

DOGE/USDT Price prediction- 4H**** Yousef Sharafi ****
In the 4H time frame, a Symmetrical Triangle pattern is forming on the chart.
The probability of a downside breakout appears to be higher.
Follow me here for more analysis

DOGEUSDT: Swing Move Is Ready To LaunchPrice is currently at a critical support level and we are on the verge of exploding to the strong bullish movement. Please use risk management while trading crypto.
Team Setupsfx

May we get to our TragetsAs we see if Doge breaks the triangle, we're gonna feel the Alt season rush Again
Good Luck dudes

Dogeusdt Doge looks good for a breakout Macd cross also golden cross on the daily alt season started eth is pumping now alts will slowly fallow

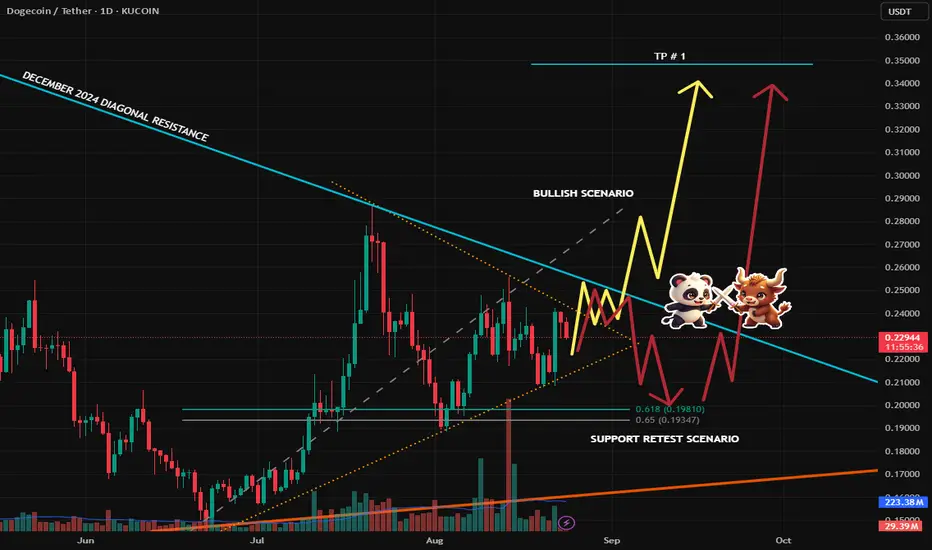
DOGE/USDT – Breakout or Retest?DOGE is coiling tighter inside this triangle and we’re now approaching the decision zone. I’ve mapped out two possible paths:
📊 Scenarios
🟡 Bullish Scenario
A breakout above the diagonal resistance (~0.24–0.25) with strong volume could ignite a rally.
Target (TP #1): 0.33 – 0.34
If momentum holds, higher levels are possible later.
🔴 Support Retest Scenario
If price gets rejected, DOGE could pull back into the 0.20–0.19 support zone (confluence with the 0.618–0.65 Fibonacci retracement).
A healthy retest here may provide fuel for a bigger move afterwards.
🧠 Market Context
Let’s be real — anything can happen here:
There’s still no significant buying volume confirming a breakout yet.
In fact, we recently saw a large red sell volume candle, showing sellers are still active.
Combine that with the usual September volatility (historically shaky month for crypto), and we should expect fakeouts and manipulation before a clear direction.
That’s why I don’t trade on hope — I wait for confirmation before committing.
💡 Final Thoughts
DOGE is at a critical zone — one strong move is coming. Whether we see the breakout first or a support retest before the bounce, the setup is already on the chart.
⚡ Smash the Follow button if you want more clean setups and pro-level breakdowns. Let’s trade smart and ride this DOGE wave together! 🚀🐕
Last and Best Buy spot is here near 0.2299$ ---soon---> 0.5000$I should start with this sentence now after years for BINANCE:DOGEUSDT : "Doge to the moon".
It is one of the last chance for DOGE to pump here and now after years of Range if it get back below 0.2$ once again the market is dead and range again so now and here i am looking for those daily +30% pump and gain to the targets like 0.4$ & 0.5$.
DISCLAIMER: ((trade based on your own decision))
<<press like👍 if you enjoy💚

DOGE 2H – Demand Reaction, Can Mid-Support Hold?DOGE swept liquidity into the 0.2158–0.2083 demand zone before launching higher. Price rejected the 0.2405 supply level and is now pulling back.
Key focus:
Holding above ~0.2280 keeps bullish structure intact, opening a path back toward 0.2405 and possibly 0.2450.
A break below ~0.2280 would suggest a deeper retrace into the demand zone at 0.2158–0.2083.
Watching how price reacts at mid-support will determine if momentum continues up or shifts back to retest liquidity.

DOGEUSDT Major supports and Fib levels can pump it Major Fibonacci retracement levels now are touching and even 0.5% can also break to the downside so we open buy this time near 0.61 Level which is major Fib level and strong Buys there can pump the price from falling once again.
DISCLAIMER: ((trade based on your own decision))
<<press like👍 if you enjoy💚

Get Ready for the Takeoff of DogecoinDoge is ready for takeoff. Target Points (TP) are displayed on the chart.

DOGE - SYMMETRICAL TRIANGLE FORMINGDOGE has been consolidating inside a symmetrical triangle on the daily timeframe. This pattern shows higher lows and lower highs, suggesting compression before a decisive move.
🔹 Pattern
Price is cooling between support and resistance trendlines.
Volume has been declining, which is typical before a breakout.
🔹 Key Levels
Support (lower trendline): 0.20 – 0.21
Resistance (upper trendline): 0.25 – 0.26
🔹 Targets on Breakout
Bullish breakout: 0.28 → 0.32 → 0.36
Bearish breakdown: 0.19 → 0.16
