Dogecoin Forming a Macro Cup & HandleHi!
Dogecoin is developing a clear macro Cup & Handle structure, formed over several years. After the strong pole & flag rally that initiated the 2021 bull market, price spent multiple years rounding out a large cup, signaling long-term accumulation.
Price is now moving inside a descending handle, which is typical before a major breakout. A clean move above the handle’s upper trendline would confirm a continuation of the macro bullish structure.
If the handle breakout is validated, DOGE could potentially enter a multi-year expansion phase aiming toward this upper target.
The target of these patterns is around $2.80–$4.00, based on the full cup-and-handle measured move and the strength of the previous pole.
Trade ideas

Dogecoin (DOGE): Seeing 2 Bullish Trades To Form | Good R:RDOGE had a strong breakdown after losing its bullish structure, and now we’re watching two potential trading setups forming. The first setup would trigger only if price breaks above the local resistance zone, while the second would come into play if buyers manage to reclaim the 100EMA.
The first target sits around the mid-range resistance, while the second aims for a move toward the 200EMA area. Until those confirmations happen, we stay patient and wait for the structure to show strength.
Swallow Academy

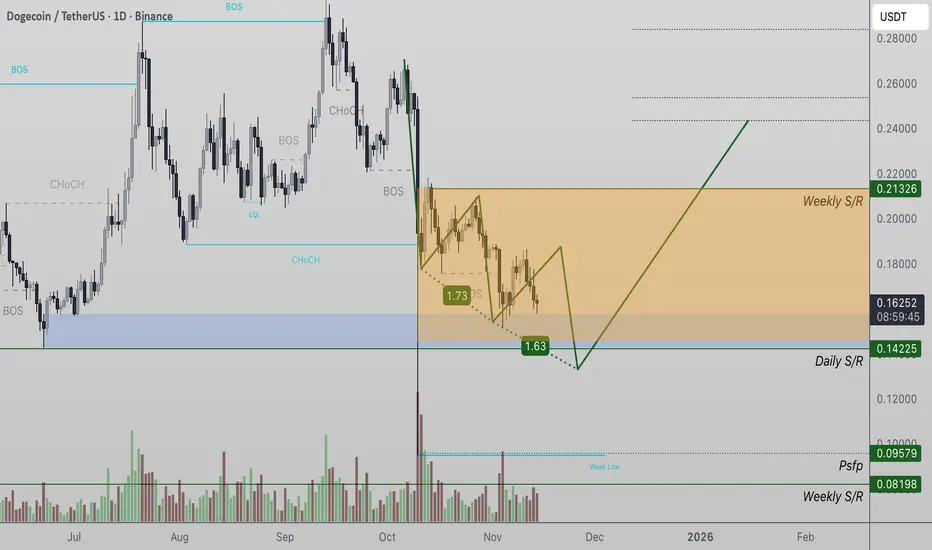
Dogecoin (DOGE/USDT) — 3 Drives Pattern Near CompletionDogecoin price action is currently trading within a developing 3 Drives pattern, signaling that the market is nearing a potential exhaustion phase. This structure opens the probability of a $0.14 retest in the immediate short term before a possible reversal.
Key Technical Points:
- Support: $0.14 (potential completion of 3 Drives pattern)
- Resistance: $0.21 key breakout level
- Bias: Bullish reversal if $0.14 holds
As long as price continues to respect the $0.14 region, the pattern remains valid and structurally intact. A third and final drive into this zone would confirm the 3 Drives formation, completing the corrective leg before a potential rotation higher.
If a reversal reaction occurs from this area with a strong reclaim candle, it would likely initiate a new impulsive wave targeting $0.21 and beyond. However, failure to defend $0.14 would invalidate the pattern and risk extending the decline.
From a technical perspective, Dogecoin is approaching a key inflection zone — maintaining the $0.14 base could mark the beginning of a broader bullish rotation as the 3 Drives setup completes.
Droppin LogsGreetings, earthlings.
Nice little logarithmic action with the dizzoge. What you thinking?


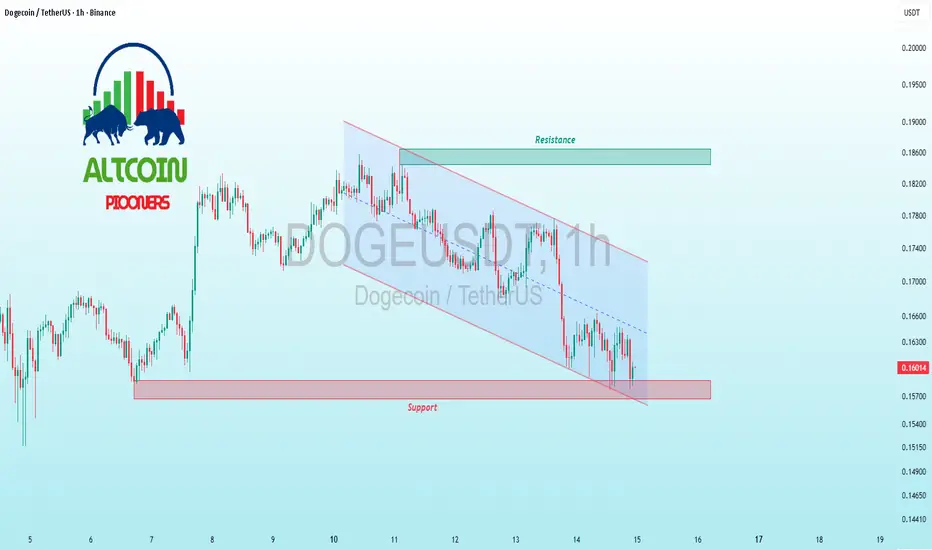
$DOGE Channel Compression – Meme Rebound Loading?BINANCE:DOGEUSDT CRYPTOCAP:DOGE Channel Compression – Meme Rebound Loading?
Current trend: DOGE's squeezing in a tight descending channel post-pump, testing 0.15 support after topping 0.19 resistance—meme volatility on pause, but wicks show buyers lurking 🐕.
Hold support? Bullish yes; prior bounces and volume clusters at 0.15 could flip sellers if holds firm.
Breakout above resistance? Primed for 0.19 close—unleashing 8-12% hype-fueled rip 🚀.
Dip risk? Low to 0.145 on BTC drag, cushioned by oversold.
Target: Upside 0.20 on escape; downside 0.14 buffer.
Indicators tracking: RSI (35, oversold pop), Channel squeeze, and MACD crossover 📊.
#DOGETrading #MemeCoinChannel #AltcoinPioneers

DOGE — Double Top Forming, Possible Continuation Down?DOGE shows signs of weakness as the overall crypto market remains in a short-term downtrend. After a sharp drop earlier today, price action suggests a potential continuation move lower.
From a pattern perspective, a clear double top formed yesterday with some liquidity grabs above the highs, indicating possible exhaustion from buyers. If momentum holds, DOGE could revisit lower support levels later today or tomorrow.
No major macro or crypto-specific catalysts are on the calendar today, so price movement may remain technically driven. Watch for confirmation through volume and structure before entering.

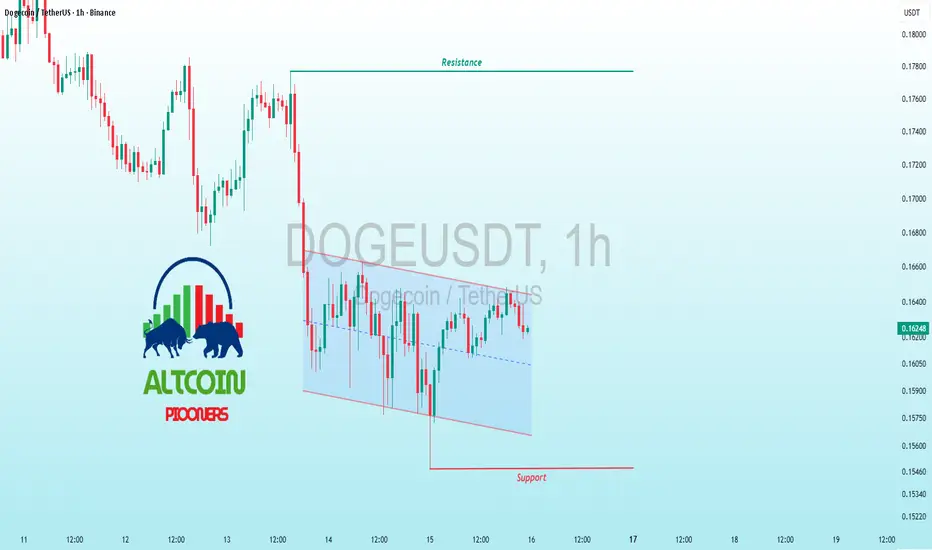
$DOGE Bouncing Off Key Support – Breakout or Breakdown?BINANCE:DOGEUSDT CRYPTOCAP:DOGE Bouncing Off Key Support – Breakout or Breakdown?
DOGE is testing the crucial 0.154 support on the 1H chart after a sharp dip, showing early signs of a bounce with increasing volume.
Bullish if it holds here—eyes on a potential breakout above 0.186 resistance targeting 0.20.
But watch for a deeper dip to 0.14 if it cracks; risk is real in this choppy market.
Key indicators: RSI rebounding from oversold (35), MACD histogram flipping positive, and rising buy volume.
Stay vigilant! 📈🐕
#Dogecoin #CryptoAnalysis #TradingView
Dogecoin (DOGE): Back in the Lows Zone | Bullish SetupDOGE is back in the lows again, repeating the same behaviour we’ve seen many times before. Price pushed up, failed, came back to sweep the lows, and now we’re sitting in that same zone once again.
The idea is simple — if buyers step in and we get a clean market structure break from here, the upside potential opens nicely. As long as we stay above this lower zone, DOGE still has room for a strong reversal.
Swallow Academy

$DOGE Meme Coin Base – Pump Setup Incoming?BINANCE:DOGEUSDT CRYPTOCAP:DOGE Meme Coin Base – Pump Setup Incoming?
Current trend: DOGE's in a classic retest of 0.167 support after rejection at 0.192 highs—wicks absorbing sells, with volume hints at meme frenzy reloading 🐕.
Hold support? Strong yes; bullish pins and EMA confluence at 0.165 zone holding firm.
Breakout above resistance? Locked and loaded for 0.192 flip—could unleash 10%+ moonshot on hype wave 🚀.
Dip risk? Light to 0.16 if BTC slips, but oversold RSI caps it.
Target: Quick 0.20 on break; stretch 0.22 with social buzz.
Indicators watching: RSI (32, prime bounce), MACD histogram flip, and social volume spikes 📈.
#DOGETrading #MemeCoinRally #AltcoinPioneers

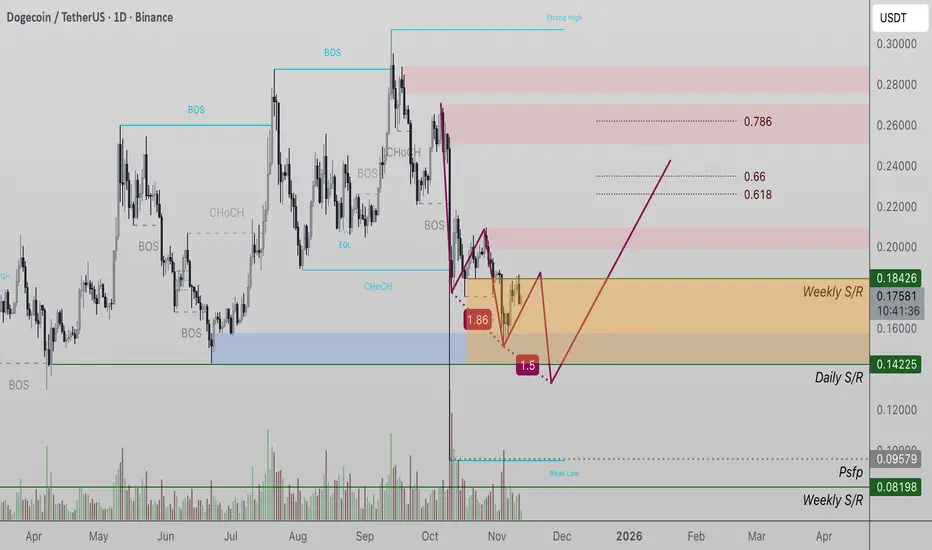
Dogecoin (DOGE) Forms Potential Three Drives PatternDogecoin price action is currently forming a potential three drives pattern, with price finding repeated resistance around the $0.18 region. This level continues to cap upside momentum, suggesting that the market may need to establish one more leg lower before a sustainable reversal can occur.
- Pattern Development: The three drives formation is in progress, requiring a third swing to confirm structure.
- Key Levels: As long as DOGE remains below $0.18, a retest of $0.14 support is likely to complete the pattern.
- Reversal Setup: A confirmed third drive at $0.14 could trigger a bullish rotation back toward upper range resistance.
From both a technical and structural perspective, Dogecoin is in the development phase of a reversal pattern that could shift short-term momentum once finalized.
Further consolidation and a controlled move into the $0.14 zone would solidify this setup before any upside expansion materializes.
DOGE: Final Support Before Breakdown?DOGE is retesting a major demand zone that has held since July — the same level that launched the last multi-week rally. But this time, price action looks weaker.
Here’s what stands out:
1️⃣ Price is compressing into a descending trendline
Sellers have controlled every lower high for months. Until DOGE reclaims this trendline, momentum stays bearish.
2️⃣ Blue demand zone = last structure support
This zone has been tapped repeatedly with diminishing bounces. If it fails, liquidity sits much lower and a deeper retracement becomes likely.
3️⃣ Stoch RSI is overbought while price is flat
That’s a classic bearish divergence signal — momentum is cooling while price can’t push upward.
4️⃣ Fibonacci supply zone capped the last rally
The 0.5 → 0.786 retracement zone above has acted as clean rejection structure, confirming sellers are still active on every rally.
📌 Bias:
DOGE needs a strong reaction from this demand zone to avoid a breakdown.
A clean reclaim of the descending trendline would shift momentum bullish.
A close below support opens the door to a much sharper move down.
This is a make-or-break moment for DOGE.

$DOGE Dips to Defend – Meme Magic or Moonshot Fade?BINANCE:DOGEUSDT CRYPTOCAP:DOGE Dips to Defend – Meme Magic or Moonshot Fade?
Altcoin Pioneers! 🐕 DOGE/USDT 1H is barking at that blue descending triangle's lower edge, price clawing back from support ~0.154 after a savage rejection at resistance 0.180. Elon whispers aside, volume's thinning on the downside – classic meme coin volatility brewing.
Hold support? Woof yeah, if RSI snaps from oversold 25 with a green engulfing; could trap shorts. Breakout above resistance? Pump city on tweet fuel, targeting 0.185. Deeper dip risk? Mucho – crack it and 0.148 (Fib 0.618) howls, dragging sentiment.
Target: Quick bark to 0.162 if holds, whimper to 0.152 on break. Eyes on: Bollinger squeeze for vol burst, OBV for accumulation, and DOGE/BTC for BTC leash. To the moon or bust? 🚀📉
#DOGE #MemeCoins #TradingView
DOGEUSDT weekly support hold strong wait for more pumpAs observed on the chart, the major weekly support for DOGEUSDT at $0.15 has demonstrated significant resilience, establishing a robust foundation for the asset. The subsequent bullish momentum we anticipated has indeed commenced, indicating a potential shift in market structure.
The critical technical level to monitor is the primary descending trendline resistance. A decisive and high-volume breakout above this resistance would serve as a strong confirmation of bullish strength, potentially invalidating the prior downtrend. Such a validated breakout could initiate a new bullish phase, with the potential to challenge previous cycle highs and establish new all-time highs on the chart.
DISCLAIMER: ((trade based on your own decision))
<<press like👍 if you enjoy💚

Doom for Dogecoin? - November 2025 - 4 cent forecastHere we go again. Dogecoin, the only “currency” that started as a joke, became a religion, and now looks like it’s back on life support. Every time the blue line (that’s the 50 SMA on shown 12-day chart above) touches price, the crowd shouts, “It’s breaking out!” Then gravity reminds everyone how charts and physics actually work.
Look left
As price action closed a 10 or 12 day candle on or below the blue line, that is the 50SMA, price rises to the moon or falls off a cliff. It’s like déjà vu but more expensive.
The technicals (A.K.A. reality check)
1. The support channel: Price has been obediently bouncing inside that nice little rising channel since 2022. When you see price action following the channel rather than reacting to it, that’s a warning. That's a warning of impending weakness. Now price has fallen like a drunk through a coffee table.
2. The RSI: Hovering in the mid-40s, which basically means it’s deciding whether to bother trying or just give up quietly. If it creeps down to 42, abandon ship!
3. The Stochastic RSI: You can see it curling down again. That red circle? That’s the technical equivalent of a yawn before a nap, usually followed by a drop. Once you’re below 20, you’re staying there for a period.
See that 78% correction from 2021? Yeah, we’ve just printed the same setup again (points 1 through 3). The only thing missing is a Twitter meme from a ketamine fuelled billionaire.
The Forecast
Best case: A dead cat bounce back to the bottom of the channel (~$0.17). Congrats, you’ve broken even on the way to losing more.
Base case: Another 70–80% correction, just like last time. History doesn’t repeat, but Dogecoin traders sure do. Price action would test 4-5 cents in this instance.
Worst case: Elon tweets something, it pumps 40% in an hour, and you buy the top again.
Conclusions
Dogecoin still does what it’s always done, remind us that markets are powered more by emotion than logic. It was fun while it lasted, but the joke’s over. The punchline is your portfolio. If history is any guide, the next few months will be spent pretending this is “accumulation.” It isn’t. It’s denial with extra steps. Could it moon again? Sure. So could my toaster if Elon tweets about it.
Ww
Disclaimer
===============================================================
This isn’t financial advice. It’s a bloke on the internet pointing at a picture of a dog and some candles. If you buy Dogecoin because of this, don’t DM me crying when it tanks, call your therapist. If it pumps, you’ll call yourself a genius. If it dumps, you’ll call it market manipulation.
Either way, it’ll be hilarious.

DOGECOIN : LIVE TRADEHello friends
According to the technical analysis conducted, we can say that with the entry of buyers in the pullback and their support of the price, it is possible to enter the transaction with risk and capital management and move with it to the specified goals.
*Trade safely with us*

Dogecoin (DOGE) to print 300% extension.... very soon!** The weeks ahead **
Following the vitriol received by the public on the short idea (below) it is time once more to extend that audacity with a long idea. Apologies to the 90%, I know how upsetting this must be for you.
On the above 3 day chart price action has corrected (as forecast) 70% from the short publication (red circle). Now is an excellent moment to consider a long position. But why?
1. 90% of the people reading this are selling, fear is not your friend right now. When there's blood on the streets, start a Black Pudding business.
2. Price action and RSI resistance breakouts.
3. Support on past resistance (red arrows).
4. Regular bullish divergence, just as before. Look left.
Is it possible price action continues to correct as a number of tradingview ideas are now calling for? Sure.
Is it probable? No.
Ww
50% short idea

DOGEUSDT – Bearish Setup Toward $0.15 DOGEUSDT – Bearish Setup Toward $0.15 📉
Dogecoin remains under strong bearish pressure, following multiple Breaks of Structure (BOS) and Market Structure Shifts (MSS) on the 3H timeframe. After a brief consolidation phase, price continues to respect the descending trend, indicating a lack of bullish strength.
Currently, DOGEUSDT is attempting a minor upward correction, likely to retest the $0.20 supply zone — a region that could act as a liquidity grab before the next major downside move. If price fails to hold above that zone, the market may trigger a sharp drop toward the $0.15 level, confirming continuation of the broader bearish trend.
Momentum remains weak, and sellers continue to dominate short-term rallies — suggesting further downside pressure in the coming sessions.

supports and resistanses in DOGEUSDTthe price of this cryptocurrency is in an expanding triangle and the supports and resistanses are clear in the chart

DOGEUSDT.P - November 12, 2025DOGEUSDT.P is showing signs of potential directional breakout setup after consolidating near the $0.1710–$0.1720 zone. The pair is currently trading within a narrow range, bounded by $0.1736 resistance above and $0.1708 support below. A decisive breakout from this range could determine the next short-term trend direction.
A bullish breakout above $0.1736 may signal renewed upside momentum, targeting the $0.1765 partial profit zone and the $0.1836 profit level (long). Conversely, a bearish breakdown below $0.1708 could trigger a continuation toward the $0.1667 support and the $0.1613 profit level (short).
Risk Assessment: Moderate — The setup favors a breakout strategy, but volatility could increase as price approaches key trigger levels. Traders may consider waiting for confirmation before entering either direction. A false breakout or rejection at the $0.1736 or $0.1708 boundaries would weaken directional bias and maintain the current consolidation range.

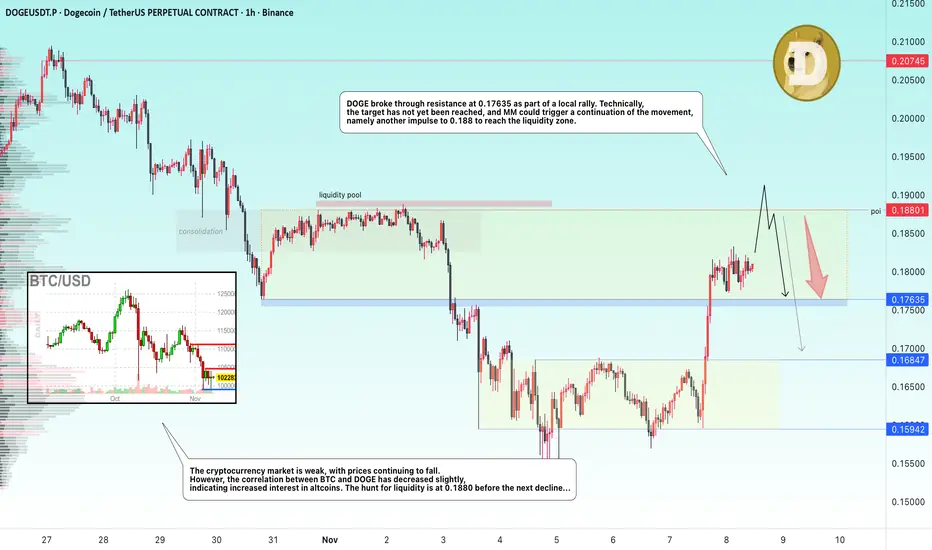
DOGE → The hunt for liquidity before the fallBINANCE:DOGEUSDT rose sharply on Friday. The reason is local news related to ETFs and Musk's tweet (it still works :) ). The growth potential may quickly exhaust itself...
The altcoin is strengthening, breaking resistance and consolidating between two important levels - 0.1763 and 0.188. The trend is bearish, the market is generally weak. I do not yet see any technical or fundamental potential for strong growth or a trend reversal.
In the current situation, DOGE may test the resistance zone of 0.188 due to the liquidity pool formed as part of local consolidation in early November. However, this liquidity pool may become a resistance to growth, which in turn may provoke a reversal and a fall.
Resistance levels: 0.188
Support levels: 0.1763
However, if the market does not allow the price to rise, it is worth watching the support level of 0.17635. Consolidation below this level will confirm the false breakout of the lower level and may trigger a decline.
Best regards, R. Linda!
DOGE — Coiling Above the Cloud: 0.174 Launchpad, 0.183 Trigger, **Timeframe:** 1H
**Thesis:** Price has constructed a constructive base above the Ichimoku cloud while compressing into a contracting triangle. The 0.174–0.175 shelf is the fulcrum.
## Structure
* Successive **higher lows** into a descending supply line → a classic coil.
* The base sits **above Kumo**, with **Tenkan > Kijun** and a gently rising forward cloud.
## Key Levels
* **Launchpad:** 0.174–0.175 (trendline + horizontal + Kumo edge + TK support)
* **Breakout trigger:** 0.183–0.184 (triangle lid / local resistance)
* **Targets:**
* T1 **0.1888**
* T2 **0.1945–0.1973**
* T3 **0.2057**
*(Measured move ≈ 0.010 from the coil.)*
## Trade Plan (illustrative)
* **Aggressive:** Buy pullbacks into **0.176–0.175**, stop **< 0.173**.
* **Conservative:** Wait for a **1H close > 0.183–0.184**, then buy the retest holding **≥ 0.181**.
* **Management:** Trail on the **Kijun** or the triangle’s rising trendline; scale at T1/T2.
## Invalidation
* 1H close **back inside/under the cloud** or a decisive loss of **0.174–0.175** opens **0.171 → 0.166 → 0.160**.
*This is an analytical view, not financial advice. Manage risk prudently.*

Dogecoin (DOGE) Holds $0.15 Support After Weak ReboundDogecoin is currently trading around the $0.15 mark after a shallow rebound that showed limited bullish conviction. The muted response from buyers highlights a lack of strong follow-through, suggesting that the market may revisit the $0.15 zone to test its structural integrity once more.
Despite this weakness, holding above this level keeps DOGE within a broader range, with potential for upside rotation still on the table if buyers re-enter.
Key Technical Points:
- Support Zone: $0.15 remains a critical area for maintaining short-term structure.
- Range Resistance: The $0.20 level continues to cap upward moves and define range -boundaries.
-bMomentum Outlook: Weak rebound and fading volume indicate ongoing consolidation.
Outlook:
If Dogecoin maintains its footing above $0.15, a gradual rotation toward $0.20 is likely, but a clean break below support could trigger a deeper correction in the short term.
