Doom for Dogecoin? - November 2025 - 4 cent forecastHere we go again. Dogecoin, the only “currency” that started as a joke, became a religion, and now looks like it’s back on life support. Every time the blue line (that’s the 50 SMA on shown 12-day chart above) touches price, the crowd shouts, “It’s breaking out!” Then gravity reminds everyone how charts and physics actually work.
Look left
As price action closed a 10 or 12 day candle on or below the blue line, that is the 50SMA, price rises to the moon or falls off a cliff. It’s like déjà vu but more expensive.
The technicals (A.K.A. reality check)
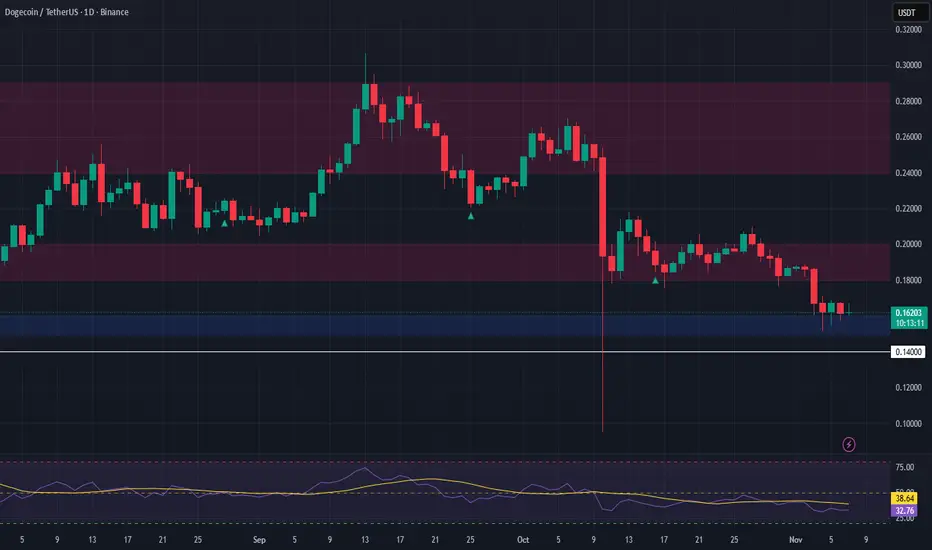
1. The support channel: Price has been obediently bouncing inside that nice little rising channel since 2022. When you see price action following the channel rather than reacting to it, that’s a warning. That's a warning of impending weakness. Now price has fallen like a drunk through a coffee table.
2. The RSI: Hovering in the mid-40s, which basically means it’s deciding whether to bother trying or just give up quietly. If it creeps down to 42, abandon ship!
3. The Stochastic RSI: You can see it curling down again. That red circle? That’s the technical equivalent of a yawn before a nap, usually followed by a drop. Once you’re below 20, you’re staying there for a period.
See that 78% correction from 2021? Yeah, we’ve just printed the same setup again (points 1 through 3). The only thing missing is a Twitter meme from a ketamine fuelled billionaire.
The Forecast
Best case: A dead cat bounce back to the bottom of the channel (~$0.17). Congrats, you’ve broken even on the way to losing more.
Base case: Another 70–80% correction, just like last time. History doesn’t repeat, but Dogecoin traders sure do. Price action would test 4-5 cents in this instance.
Worst case: Elon tweets something, it pumps 40% in an hour, and you buy the top again.
Conclusions
Dogecoin still does what it’s always done, remind us that markets are powered more by emotion than logic. It was fun while it lasted, but the joke’s over. The punchline is your portfolio. If history is any guide, the next few months will be spent pretending this is “accumulation.” It isn’t. It’s denial with extra steps. Could it moon again? Sure. So could my toaster if Elon tweets about it.
Ww
Disclaimer
===============================================================
This isn’t financial advice. It’s a bloke on the internet pointing at a picture of a dog and some candles. If you buy Dogecoin because of this, don’t DM me crying when it tanks, call your therapist. If it pumps, you’ll call yourself a genius. If it dumps, you’ll call it market manipulation.
Either way, it’ll be hilarious.
Trade ideas

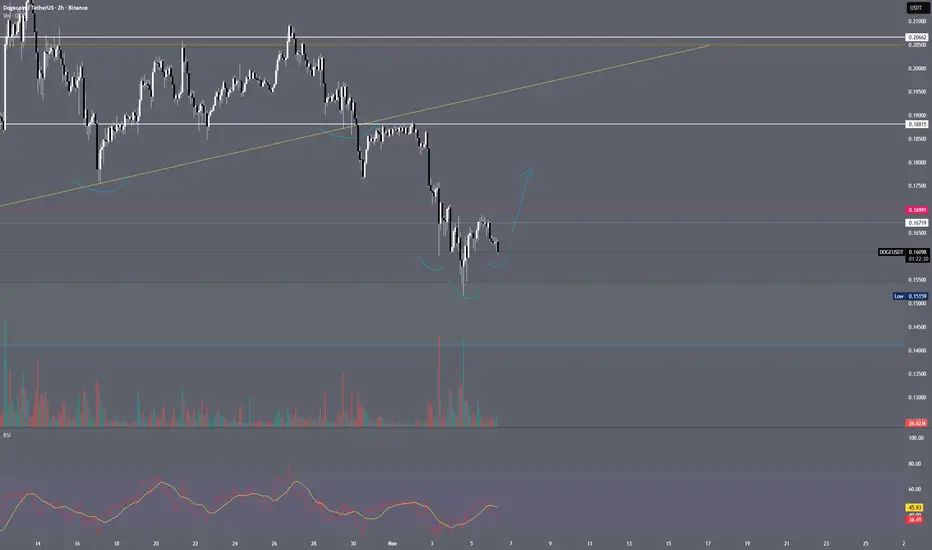
$DOGE is showing strength from the key support trendline.CRYPTOCAP:DOGE is showing strength from the key support trendline.
Holding above $0.18 looks good for a rebound.
A break above $0.23 could start the next move up.
🎯 Short-term target: $0.29
🎯 Swing target: $0.57
🎯 Long-term target: $1
#DOGE #dogeusdt

DOGE — Coiling Above the Cloud: 0.174 Launchpad, 0.183 Trigger, **Timeframe:** 1H
**Thesis:** Price has constructed a constructive base above the Ichimoku cloud while compressing into a contracting triangle. The 0.174–0.175 shelf is the fulcrum.
## Structure
* Successive **higher lows** into a descending supply line → a classic coil.
* The base sits **above Kumo**, with **Tenkan > Kijun** and a gently rising forward cloud.
## Key Levels
* **Launchpad:** 0.174–0.175 (trendline + horizontal + Kumo edge + TK support)
* **Breakout trigger:** 0.183–0.184 (triangle lid / local resistance)
* **Targets:**
* T1 **0.1888**
* T2 **0.1945–0.1973**
* T3 **0.2057**
*(Measured move ≈ 0.010 from the coil.)*
## Trade Plan (illustrative)
* **Aggressive:** Buy pullbacks into **0.176–0.175**, stop **< 0.173**.
* **Conservative:** Wait for a **1H close > 0.183–0.184**, then buy the retest holding **≥ 0.181**.
* **Management:** Trail on the **Kijun** or the triangle’s rising trendline; scale at T1/T2.
## Invalidation
* 1H close **back inside/under the cloud** or a decisive loss of **0.174–0.175** opens **0.171 → 0.166 → 0.160**.
*This is an analytical view, not financial advice. Manage risk prudently.*

DOGE/USDT – Key Breakout Zone Approaching Between $0.16 and $0.1Current Price: $0.1772
Trend: Short-term uptrend supported by an ascending trendline.
Support Zone: $0.1600 – $0.1660 (marked in red).
Resistance Zone: $0.1880 – $0.1920 (marked in green).
Scenarios:
Bullish Case:
If DOGE breaks and closes above the resistance zone, continuation towards the next target at $0.2100 is likely.
Watch for a strong candle breakout with volume above resistance for confirmation.
Bearish Case:
If DOGE fails to hold the trendline and breaks below it, price may retrace back to the support zone around $0.1600.
A confirmed breakdown below support could open room for deeper correction.
Summary:
DOGE is trading between key support and resistance. A breakout above $0.1900 could trigger bullish momentum toward $0.21, while a breakdown below $0.1700 may lead to a retest of $0.16. Traders should wait for confirmation before entering positions.

DOGE USDT LONG SIGNAL---
📢 Signal Alert
🔹 Pair: DOGE / USDT
📈 Trade Type: Long
💰 Entry Zone: 0.1593 – 0.1669
🎯 Take-Profit Targets (with partial management):
▫️ TP1 = 0.1840
▫️ TP2 = 0.1989
▫️ TP3 = 0.2146
🛑 Stop-Loss: 0.1505
📊 Timeframe: 1H
⚖️ Risk/Reward Ratio: 3.45
📌 Suggested Leverage: 3x – 5x
⚠️ Capital management is mandatory.
💬 Please review the chart before entry.
---
🧠 Technical Analysis Summary:
DOGE is showing strong bullish momentum after confirming support at the 0.159–0.160 zone.
The pair has formed a higher low pattern, indicating renewed buyer strength.
Momentum indicators (RSI > 50 and MACD crossover) confirm the probability of a continuation move toward 0.198–0.214.
A break and close above 0.167 resistance would confirm the bullish setup.
Stop-loss is placed just below the last swing to avoid fakeouts.
---
⚙️ Trade Management Tip:
After TP1 hits, move Stop-Loss to Entry and secure partial profits.
Allow the position to run toward TP2 and TP3 for maximum gain.
---
⚠️ Disclaimer:
This setup is for educational purposes only and not financial advice.
Always manage risk and perform your own analysis (DYOR) before trading.
---

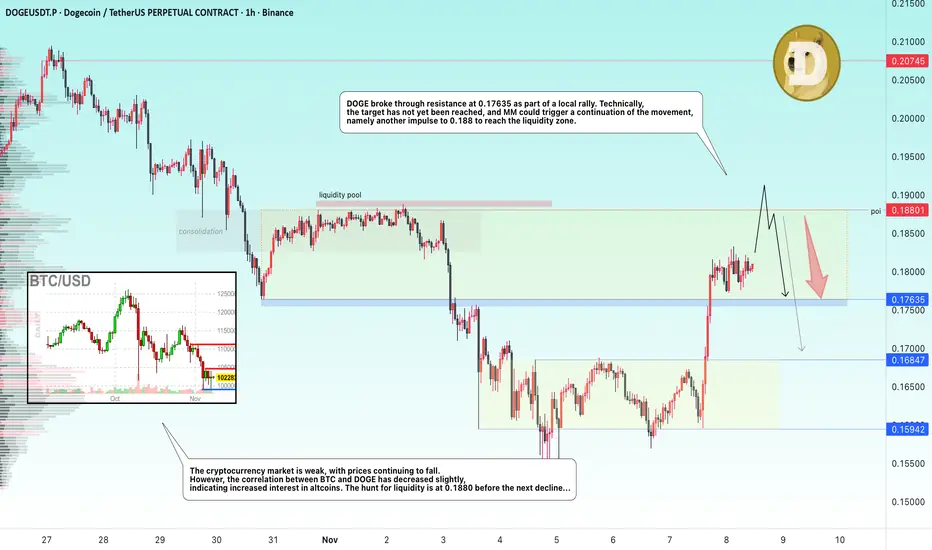
DOGE → The hunt for liquidity before the fallBINANCE:DOGEUSDT rose sharply on Friday. The reason is local news related to ETFs and Musk's tweet (it still works :) ). The growth potential may quickly exhaust itself...
The altcoin is strengthening, breaking resistance and consolidating between two important levels - 0.1763 and 0.188. The trend is bearish, the market is generally weak. I do not yet see any technical or fundamental potential for strong growth or a trend reversal.
In the current situation, DOGE may test the resistance zone of 0.188 due to the liquidity pool formed as part of local consolidation in early November. However, this liquidity pool may become a resistance to growth, which in turn may provoke a reversal and a fall.
Resistance levels: 0.188
Support levels: 0.1763
However, if the market does not allow the price to rise, it is worth watching the support level of 0.17635. Consolidation below this level will confirm the false breakout of the lower level and may trigger a decline.
Best regards, R. Linda!
DOGE Testing Key Support – Watching for ConfirmationDOGE is currently testing a critical support zone in the $0.15–$0.16 range. This level has historically acted as a base for bullish reversals. However, we're only considering a long entry if both DOGE and BTC confirm signs of holding their respective support levels. BTC’s structure remains crucial for altcoins to gain traction.
🔹 Long Spot Trade Setup (Conditional on Confirmation):
Entry Zone: $0.15 – $0.16
Take Profit Targets:
• TP1: $0.18 – $0.20
• TP2: $0.24 – $0.29
Stop Loss: Below $0.14
This setup targets a strong risk-to-reward structure, but we stress the importance of waiting for bullish confirmation before entry.
supports and resistanses in DOGEUSDTthe price of this cryptocurrency is in an expanding triangle and the supports and resistanses are clear in the chart

$DOGE (6-HOUR): WYCKOFF DISTRIBUTION pattern continuesI still haven't taken any profits off my CRYPTOCAP:DOGE short (18.7c), and it looks like another leg down might be coming next.
Another BEAR RSI divergence, a SELL signal flashing, and another LOWER HIGH on tiny VOLUME bars. Sellers are winning, so I wouldn't exclude a scenario where #Dogecoin has an unexpected surge to LIQUIDATE late BEARS (up to 17.5c as per the attached heatmap) first and then continues downwards.
I have modified my EXIT strategy — I would be 33% out of this position after each 4-HOUR candle close ABOVE 19c.
3 TAKE PROFIT levels are marked on the attached 6-HOUR chart.
💙👽
#WyckoffPattern continues

Dogecoin (DOGE) Holds $0.15 Support After Weak ReboundDogecoin is currently trading around the $0.15 mark after a shallow rebound that showed limited bullish conviction. The muted response from buyers highlights a lack of strong follow-through, suggesting that the market may revisit the $0.15 zone to test its structural integrity once more.
Despite this weakness, holding above this level keeps DOGE within a broader range, with potential for upside rotation still on the table if buyers re-enter.
Key Technical Points:
- Support Zone: $0.15 remains a critical area for maintaining short-term structure.
- Range Resistance: The $0.20 level continues to cap upward moves and define range -boundaries.
-bMomentum Outlook: Weak rebound and fading volume indicate ongoing consolidation.
Outlook:
If Dogecoin maintains its footing above $0.15, a gradual rotation toward $0.20 is likely, but a clean break below support could trigger a deeper correction in the short term.

Doge usdt Dogecoin seems to have completed the three-wave ABC correction and is forming the next 5 bullish waves, with wave 2 forming

$DOGE Long Setup – Bulls Returning
CRYPTOCAP:DOGE is rebounding from 0.151$ , forming a bullish structure on the 1h chart. Buyers are stepping in after a healthy pullback, signaling momentum building for a move higher.
🟢 Entry: 0.1670$ – 0.1655$
🎯 Targets: 0.174$ / 0.181$ / 0.190$ / 0.2$+
🔴 Stop Loss: 0.15$
💡 Holding above 0.166$ could confirm bullish strength and pave the way for an extended push toward 0.18$ - 0.2$ Keep an eye on volume for confirmation. ✅

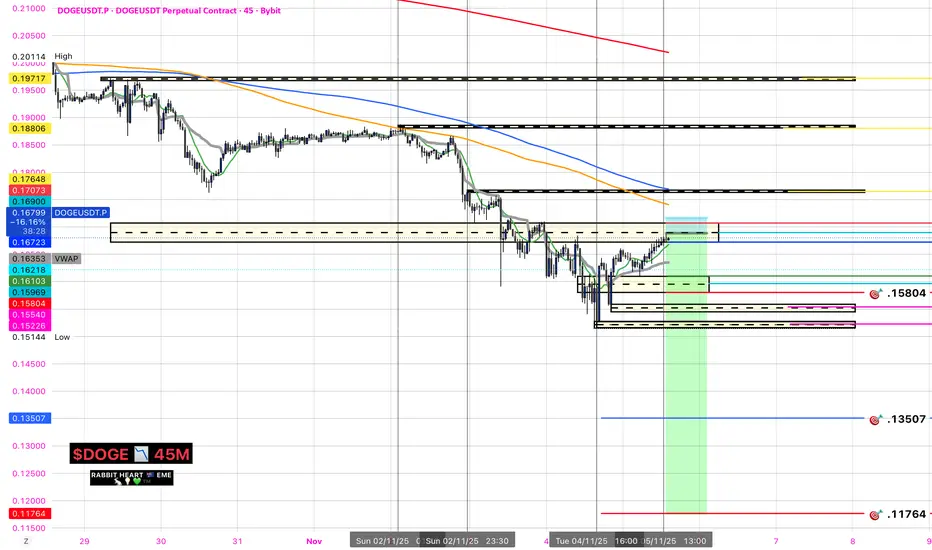
$DOGE M45 SELL / lack of divergencePrice has been appreciating , with lack of divergence and a swing point for quite some time, leaving Traders in open long positions vulnerable
DOGEUSDT.P - November 6, 2025A breakout and close above resistance could confirm bullish momentum toward higher levels, while a rejection or drop below the ascending trendline and support may indicate a bearish reversal—trade based on how price reacts at these critical zones.

$DOGE (6-HOUR): SHORT printing, TRADE summary so farCRYPTOCAP:DOGE short doing well.
I couldn't remember if I published TP levels or not, so I asked #Grok to summarize my latest trade on #DOGE and it did an incredible job of it, actually.
Here is the summary it generated:
Latest CRYPTOCAP:DOGE Trade SummaryTrade Type: Short (Bearish position)
Open Date: November 1, 2025
Entry Price: $0.187
Rationale: CRYPTOCAP:DOGE entered bear market territory after losing key supports (200 MA + horizontal), bearish retest in a downtrend, impending death cross (50 MA below 200 MA on daily), and multiple hidden bearish RSI divergences across timeframes. Relative weakness confirmed vs. CRYPTOCAP:BTC (three bearish RSI divergences on DOGE/BTC daily). Low-leverage entry in risk-off market climate. Stop Loss Tactic: Manual, multi-part exit to manage risk:
Close 25% position on each 4-hour candle close above the 200 MA (~$0.209 at entry).
Full exit sooner if solid bullish divergences appear on charts.
Invalidated if $0.21 flips into support (potential liquidation).
Take Profit Levels: Yes, explicitly mentioned:
Level 1: $0.143
Level 2: $0.130
Level 3: $0.092
(Targets subject to adjustment based on new technical developments; bearish bias holds until $0.21 reclaimed or risk-off ends.)
Overall Bias: Bear market coin below 200 MA daily—prefer shorts below, longs above. Position active as of November 2 update; monitoring for updates.
Wow. Let me know if you want summaries of this kind more, on top of my ramblings or instead of them, lol.
👽💙

DOGEUSDT.P - November 4, 2025DOGEUSDT.P is maintaining a mixed-to-bearish market structure, with price currently consolidating near the $0.1665 region after forming a sequence of lower highs and lower lows. The projected structure suggests a potential push higher toward the $0.1709–$0.1737 resistance zone before a possible reversal lower. A rejection from this zone could accelerate a move back toward the $0.1594 support area, aligning with the broader bearish bias. However, a sustained breakout above $0.1737 would invalidate this outlook and signal a shift toward short-term bullish momentum.

Dogecoin Tests Swing Low: Reversal Needed to Avoid CorrectionDogecoin price action is currently testing a key swing low, a level previously identified as a weak low during prior consolidation. The market is once again probing this region, where a new low may be established — making it a critical area for potential reversal or further downside continuation.
A quick reclaim of this region is essential for any bullish reversal to develop. Failure to do so would likely open the probability for a deeper corrective move, as liquidity resting below this level could be taken out before a broader recovery attempt.
Key Points:
- Swing Low Test: Price is revisiting a previous weak low, marking an inflection zone.
- Reversal or Breakdown: A reclaim here is needed to signal strength; failure increases downside risk.
- Liquidity Risk: Sub-low liquidity could attract further sell pressure if support fails.
From a technical perspective, Dogecoin sits at a key trade location — one that will likely determine the next major directional move.
What to Expect:
A successful reclaim of the current swing low could trigger a reversal back upward, while continued weakness below this zone would expose lower liquidity targets and confirm a bearish continuation for Dogecoin.

DOGECOIN. USDTDogecoin could gradually decline to 12-13 cents.
However, if the market turns bearish, it will fall back to 10 cents.
In any case, a drop of 3-4 cents is guaranteed.
Considering that Ethereum could potentially fall to $3,400, and Bitcoin to $102,000/$101,000/$100,000/$99,000, therefore, a drop in Dogecoin between 10 and 14 cents seems inevitable.
So, every decline is a buying opportunity, and every green candle is just bait for emotional buyers.

Elon Musk's favorite coin DOGEElon Musk's favorite coin CRYPTOCAP:DOGE #DOGE 🪙 also has a pretty good long setup.
The trade is 1 to 2.
Entry: $0.18684
Take Profit: $0.20940
Stop Loss: $0.17540
Based on the liquidation map, the trade is justified. A lot of liquidity has piled up above.

DOGECOINAfter a strong rally at the beginning of 2025, Dogecoin is in a downtrend within a broader consolidation phase.
The past 5–6 weeks have shown lower highs and lower lows, confirming a bearish phase within the wider range.
It is currently testing the critical support at 0.174, which marks the boundary between consolidation and a potential continuation of the decline.

Long setup is neutral biased now.Price is reacting inside a corrective pullback after impulsive downside.
Trade idea is based on multi timeframe Bias Matrix alignment.
Deep TF and DD TF are still negative so long exposure must be reduced.
Only NOW TF is showing early micro reversal potential.
Risk is defined below the last micro swing low.
Target zone is placed at the next structural liquidity cluster above.
Idea text (în engleză formal, profesional, eficient):
Trade Idea: DOGEUSDT Long Attempt – Neutral Probability Setup
The market is currently in a corrective pullback phase after a strong downward impulse. The multi timeframe Bias Matrix shows a neutral overall result: the higher timeframes remain bearish, but the NOW timeframe is showing a potential micro rotation. This entry is speculative and requires strict risk control.
Setup: Long attempt inside retracement zone
Reasoning: Local reversal signal on NOW TF while price is still in the lower liquidity band
Risk Control: Stop below the recent swing low
Target: Next liquidity cluster above current price
Notes: This is not a high confidence setup. Bias becomes more valid if the DD timeframe flips positive.
Conclusion: This is a controlled risk attempt to capture a short term bounce while macro bias remains bearish.

$DOGE (6-HOUR): ANOTHER WYCKOFF distribution variant, SHORTAnother chart and another variant of a WYCKOFF DISTRIBUTION schematic — this time on the medium-term CRYPTOCAP:DOGE charts.
Crypto is absolutely riddled with distribution patterns these days. Across all timeframes: I’ve shown you the clear 5-year CRYPTOCAP:DOT distribution, the current-cycle $RENDER distribution schematic, and the short-term $EVAA distribution setup.
Serious capital has been leaving crypto. You’ve seen rallies in metals, big stocks, and the Nasdaq — but not in crypto.
Cryptoville is Distribution-ville right now. Just my two cents.
As for the #DOGE mid-term charts (4H/6H), HIDDEN BEARISH divergences keep popping up on the 4-hour. The next leg should be DOWN, with the next SUPPORT at 17.5c.
Lose that, and my SHORT is going to start PRINTING.
💙👽
