May we get to our TragetsAs we see if Doge breaks the triangle, we're gonna feel the Alt season rush Again
Good Luck dudes
Trade ideas

Dogeusdt Doge looks good for a breakout Macd cross also golden cross on the daily alt season started eth is pumping now alts will slowly fallow

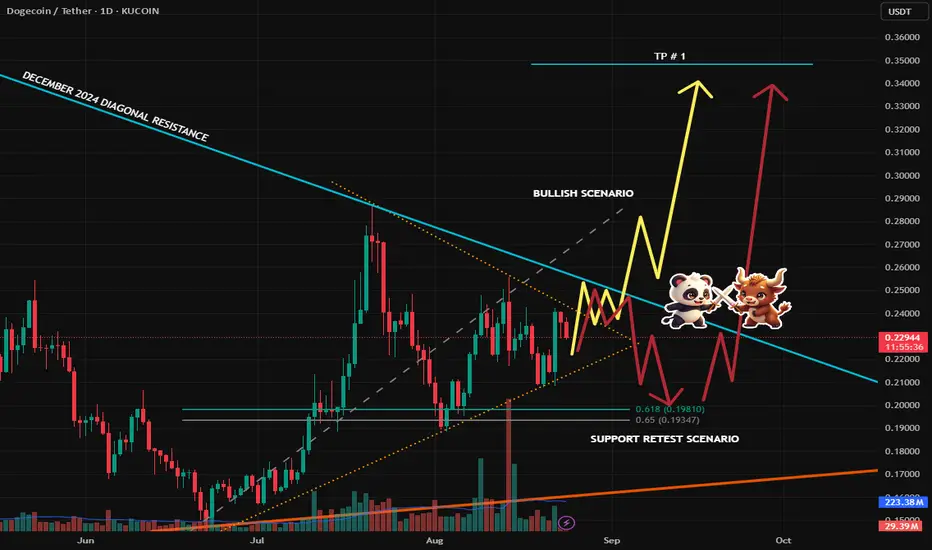
DOGE/USDT – Breakout or Retest?DOGE is coiling tighter inside this triangle and we’re now approaching the decision zone. I’ve mapped out two possible paths:
📊 Scenarios
🟡 Bullish Scenario
A breakout above the diagonal resistance (~0.24–0.25) with strong volume could ignite a rally.
Target (TP #1): 0.33 – 0.34
If momentum holds, higher levels are possible later.
🔴 Support Retest Scenario
If price gets rejected, DOGE could pull back into the 0.20–0.19 support zone (confluence with the 0.618–0.65 Fibonacci retracement).
A healthy retest here may provide fuel for a bigger move afterwards.
🧠 Market Context
Let’s be real — anything can happen here:
There’s still no significant buying volume confirming a breakout yet.
In fact, we recently saw a large red sell volume candle, showing sellers are still active.
Combine that with the usual September volatility (historically shaky month for crypto), and we should expect fakeouts and manipulation before a clear direction.
That’s why I don’t trade on hope — I wait for confirmation before committing.
💡 Final Thoughts
DOGE is at a critical zone — one strong move is coming. Whether we see the breakout first or a support retest before the bounce, the setup is already on the chart.
⚡ Smash the Follow button if you want more clean setups and pro-level breakdowns. Let’s trade smart and ride this DOGE wave together! 🚀🐕
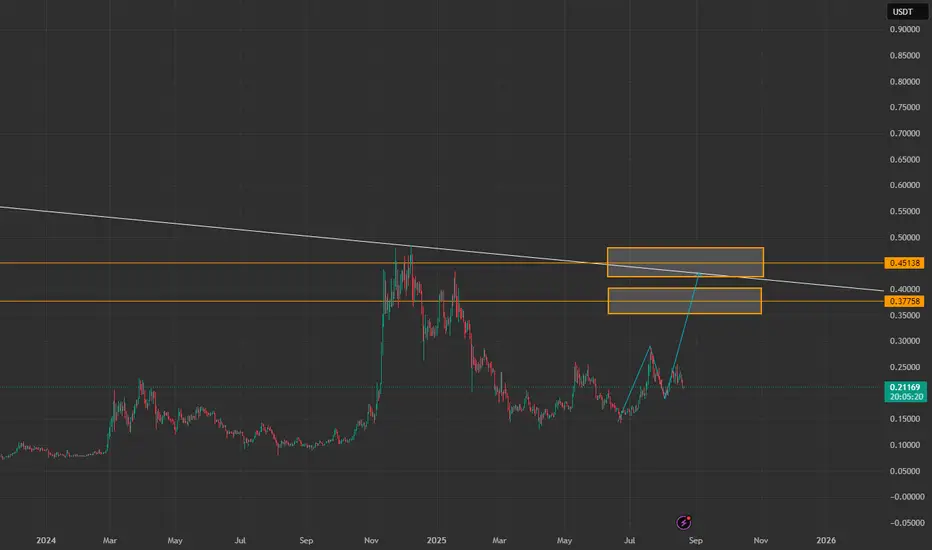
Last and Best Buy spot is here near 0.2299$ ---soon---> 0.5000$I should start with this sentence now after years for BINANCE:DOGEUSDT : "Doge to the moon".
It is one of the last chance for DOGE to pump here and now after years of Range if it get back below 0.2$ once again the market is dead and range again so now and here i am looking for those daily +30% pump and gain to the targets like 0.4$ & 0.5$.
DISCLAIMER: ((trade based on your own decision))
<<press like👍 if you enjoy💚

DOGE 2H – Demand Reaction, Can Mid-Support Hold?DOGE swept liquidity into the 0.2158–0.2083 demand zone before launching higher. Price rejected the 0.2405 supply level and is now pulling back.
Key focus:
Holding above ~0.2280 keeps bullish structure intact, opening a path back toward 0.2405 and possibly 0.2450.
A break below ~0.2280 would suggest a deeper retrace into the demand zone at 0.2158–0.2083.
Watching how price reacts at mid-support will determine if momentum continues up or shifts back to retest liquidity.

DOGEUSDT Major supports and Fib levels can pump it Major Fibonacci retracement levels now are touching and even 0.5% can also break to the downside so we open buy this time near 0.61 Level which is major Fib level and strong Buys there can pump the price from falling once again.
DISCLAIMER: ((trade based on your own decision))
<<press like👍 if you enjoy💚

Get Ready for the Takeoff of DogecoinDoge is ready for takeoff. Target Points (TP) are displayed on the chart.

DOGE - SYMMETRICAL TRIANGLE FORMINGDOGE has been consolidating inside a symmetrical triangle on the daily timeframe. This pattern shows higher lows and lower highs, suggesting compression before a decisive move.
🔹 Pattern
Price is cooling between support and resistance trendlines.
Volume has been declining, which is typical before a breakout.
🔹 Key Levels
Support (lower trendline): 0.20 – 0.21
Resistance (upper trendline): 0.25 – 0.26
🔹 Targets on Breakout
Bullish breakout: 0.28 → 0.32 → 0.36
Bearish breakdown: 0.19 → 0.16

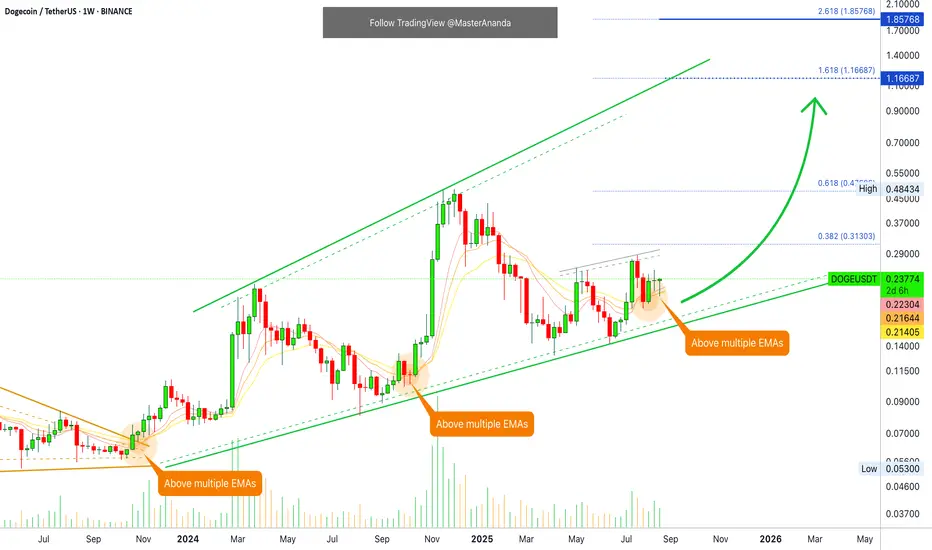
Dogecoin Set To Grow Immediately · Next Target $1.85 Mid-TermThis is it. If you are one of those traders that wait for confirmation, this is it. You can go LONG, all-in, right above the three moving averages shown on this chart. EMA8, EMA13 and EMA21. The stop below and you are safe because the Cryptocurrency market bulls own the game. The market is moving up.
This week is the fourth week that DOGEUSDT has been trading above support and seeing this support holding once more—support confirmed—simply ends the period of doubt.
Just a few days ago, a few weeks ago the market was divided in two groups, as it always happens. One group was bearish and another group was bullish. This is normal and always valid because the market can move in any direction. Where the market is headed can be predicted though based on what is happening.
If the action is happening above support/resistance with high volume and strong technical chart signals, we can say that prices are set to rise. When the contrary is true, the market is red below resistance/support, we know a drop follows.
Dogecoin is in the process of confirming a strong support and this confirmation is what reveals a higher high as the next major move. The market was already bullish and Dogecoin was already growing. What happened just now is the confirmation of the next advance. Now we know for certain Dogecoin is set to move beyond $1 in the coming months. It can go much higher of course.
Namaste.
DOGEUSDT – TECHNICAL BUY CALL | 1D TF | 22 August 2025 | 7:15 PMDOGEUSDT – TECHNICAL BUY CALL | 1D TF | 22 August 2025 | 7:15 PM GMT
The coin recently broke structure on the bullish side, pulled back in an A-B-C pattern, and now seems to have ended the pullback. The coin is ready to move upward, pursuing several bullish targets.

DOGE :I'm ordering a Lamborghini.Dogecoin is waiting for the green light
I have the purchase confirmation

DOGE to make a new ATH?!This is what we call 'crypto heritage'. Doge being one of the OG cryptos from 2013 is poised to make a new ATH this cycle. Doge is not just a meme coin, but a coin that also has utility.
Based on current trajectory, DOGE targets for potential Take Profits for the final wave 5:
Target 1: $0.90-$1.35
Target 2: $1.50-$2
Target 3: $2.80-$3.3 (moonshot)
Keep an eye out on X Payments and ELON to see DOGE fly higher.

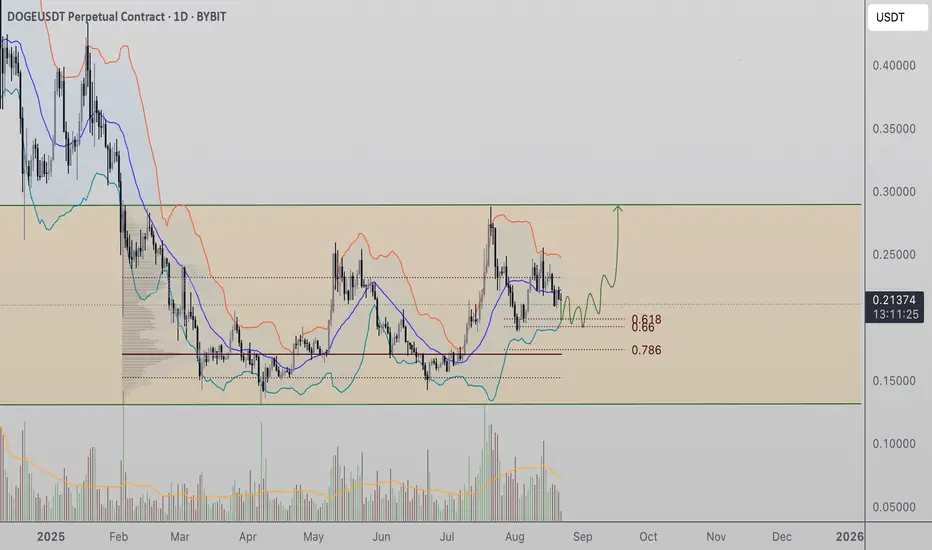
Dogecoin (DOGE) Holds Mid-Range Support, Prepares for Potential Dogecoin (DOGE) is consolidating within a high-timeframe range, currently holding support at the mid-range level. This support, aligned with the 0.618 Fibonacci retracement, provides a foundation for a rotation back toward the range high — a move that could eventually trigger a breakout if supported by strong volume.
Dogecoin’s price action remains range-bound on higher timeframes, with price trading between clearly defined support and resistance levels. The mid-range has once again provided support, creating an important pivot zone for traders. As long as DOGE holds this structure, probability favors another attempt at the range high, which could set the stage for a significant move if buying pressure strengthens.
Key Technical Points
- Mid-Range Support: DOGE is holding the mid-range level, confluencing with the 0.618 Fibonacci retracement
- Range-Bound Structure: Price continues to oscillate between range lows and range highs
- Upside Rotation: Holding mid-range opens probability of a move back toward the range high
DOGE is trading within a clearly established high-timeframe range, with well-defined boundaries acting as key liquidity zones. The current mid-range support has proven to be a crucial level, aligning with the 0.618 Fibonacci retracement and providing technical confluence for buyers. This level now serves as the foundation for a potential bullish rotation back to the range high.
From a market structure perspective, price action is range-bound, but how DOGE responds to the range high will be decisive. A rotation toward resistance without first sweeping the range lows would show strength, suggesting accumulation and controlled bullish pressure. To confirm a breakout, however, price must not only breach the range high but also do so with a noticeable increase in volume.
Volume dynamics will be essential to watch. A surge in trading activity as DOGE approaches and tests the highs would signal strong market participation and improve the probability of a breakout. Without this confirmation, DOGE risks remaining trapped within the range, continuing its oscillatory behavior between key levels.
What to Expect in the Coming Price Action
As long as Dogecoin maintains mid-range support, the bias leans toward a rotation back to the range high. A successful breakout above this resistance, supported by an influx of volume, could signal the start of a more impulsive bullish move. If the mid-range fails to hold, however, DOGE could once again revisit the range lows before any further upside attempts.
Too many whales won't give you a chance.After crossing the 27 cent price, the king of meme coins will be uncontrollable until 70 cents.

doge usdt target final Price
1.40 ┤ 🎯 Final Long-term Target
1.20 ┤ ⚡ Strong Resistance
1.00 ┤ 🎯 Major Target (Psychological Level)
0.85 ┤ ⚡ Resistance
0.70 ┤
0.55 ┤ 🎯 Mid-term Target
0.40 ┤ ⚡ Resistance / Previous ATH zone
0.35 ┤
0.30 ┤ ⚡ Strong Resistance Zone
0.27 ┤ 🎯 Short-term Target
0.23 ┤ ⚡ Current Resistance
0.21 ┤━━━━━━ 🔹 Strong Support / Floor
0.20 ┤━━━━━━ ❌ Stop Loss Zone⚡ Major Long-term Support
If bullish momentum continues with strong retail + whale activity, the final target of $1.40 becomes realistic.
---
✅ Summary
Support: $0.21 (critical), $0.20 (stop-loss), $0.15 (major floor).
Resistance / Targets:
Short-term: $0.27 → $0.30
Mid-term: $0.40 → $0.55 → $0.70
Long-term: $1.00 → $1.20 → $1.40
DOGE is showing accumulation signs. As long as it defends $0.21 support, the path to higher levels remains open. Breaking $0.30 will likely ignite the rally.

DOGE is trading inside a well-defined descending channelDOGE is trading inside a well-defined descending channel, with repeated rejections from the supply zone (yellow box) under channel resistance.
Current structure is forming lower highs, maintaining bearish momentum.
As long as supply holds, the next logical target is the 0.1888 support.
A breakdown below that would open the door to deeper channel support near 0.16–0.15.
Bulls need a decisive breakout above the supply zone + channel resistance to flip structure.
This chart illustrates a clean trend + supply/demand confluence, with 0.1888 as the key level to watch.

DOGE 1H timeframe a closer look! Bounce or Bleed?This is a follow-up from my previous idea, but now on the 1H timeframe for a closer perspective. DOGE is currently hovering around the 0.5 Fibonacci retracement ($0.2149), and the price action is tightening between key support and resistance levels.
Here’s what I’m watching:
✅ A bounce from the 0.5 FIB ($0.2149) could send price back up to test the December 2024 diagonal resistance.
❌ A break below this level may open the way to the 0.618 ($0.1982) and 0.65 ($0.1936) supports, where buyers could step in again.
🚀 On the bullish side, confirmation above the December 2024 diagonal resistance remains the major trigger, aligning with my bigger plan for a move toward TP1 = $0.348.
The June 2025 diagonal support line is still intact, keeping the broader structure supportive of higher lows.
In short:
Bulls need to hold $0.2149 → bounce likely.
Bears take control if $0.2149 breaks → next zone $0.1982–$0.1936.
Breakout above diagonal resistance → momentum builds toward higher targets.
💬 That’s my closer look at DOGE. What’s your short-term bias here — do you see bulls holding or bears taking over? Share your thoughts in the comments, and I’ll be happy to check out your trade ideas too! 🙌
If this breakdown helps, don’t forget to follow me here on TradingView for more updates and setups. 🚀

DOGE at the Crossroads: Bounce or Break?Currently, I’m watching how DOGE reacts around the 0.5 Fibonacci retracement ($0.2149). If this level fails to hold, my next support levels are at the 0.618 ($0.1982) and the 0.65 ($0.1936) zone. These areas could serve as strong demand zones where buyers may step in before DOGE begins another bullish leg.
The key resistance to watch is the December 2024 trendline (diagonal resistance connecting the recent highs). Once price breaks and confirms above this trendline, my first partial Take Profit (TP1) will be at the 0.618 level of the bigger Fibonacci retracement = $0.348.
The June 2025 diagonal support line (ascending trendline) also remains intact, providing structure for a possible higher-low formation.
Here’s my trading plan in simple steps:
✅ If 0.5 FIB ($0.2149) holds → bounce likely.
❌ If 0.5 FIB breaks → next support is 0.618 ($0.1982) / 0.65 ($0.1936).
🚀 Breakout above December 2024 trendline → first TP = $0.348.
That’s my take on DOGE. What’s yours? Share your thoughts in the comments — I’d love to check out your trade ideas too. 🙌 If you found this breakdown useful, don’t forget to follow me here on TradingView for more structured crypto setups and insights!

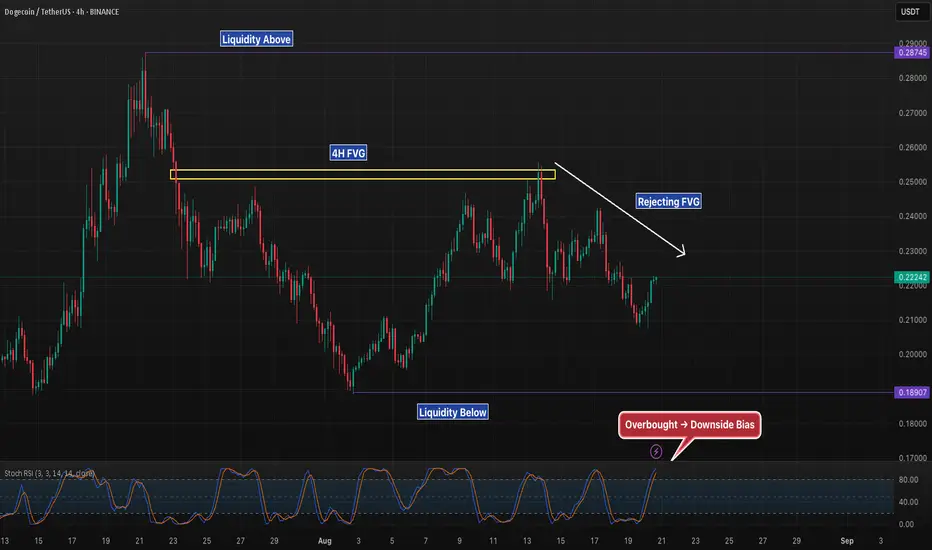
DOGE 4H – FVG Rejection Into Liquidity?Dogecoin rejected from the 0.228–0.235 FVG, with sellers stepping in and pushing price back under imbalance. Momentum now favors a move into downside liquidity unless bulls reclaim the zone.
FVG (0.228–0.235): Key rejection block.
Liquidity Below: 0.189 remains the next major draw.
Liquidity Above: 0.287 only comes into play if bulls reclaim the FVG.
Momentum: Stoch RSI overbought, reinforcing short-term rejection bias.
As long as DOGE trades below the FVG, the bias leans toward a liquidity sweep into 0.189 before any chance of reversal.
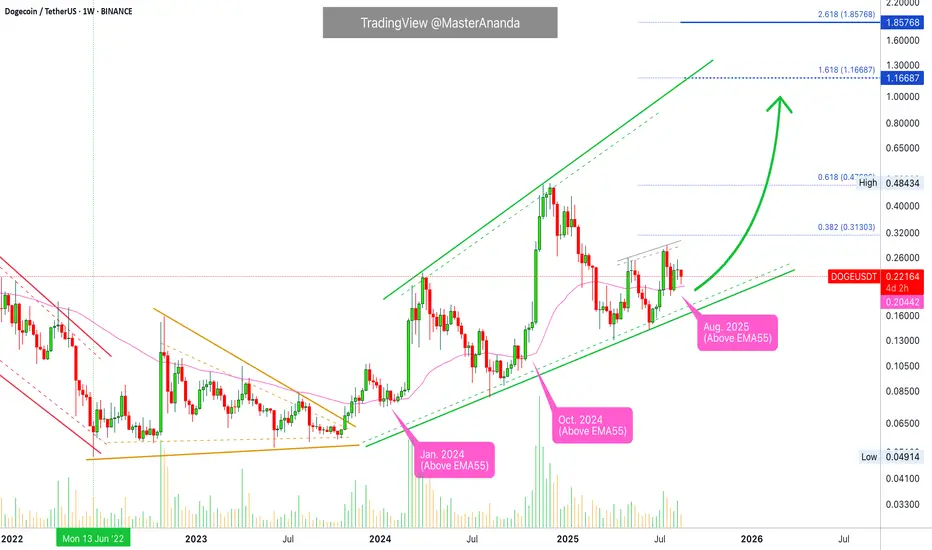
Dogecoin · EMA55 Weekly · See What I Mean?Here DOGEUSDT (Dogecoin) can be seen rising while staying above EMA55 weekly—magenta line on the chart.
This is technical analysis made simple.
» DOGEUSDT moved above EMA55 October 2024 and this produced a major bullish jump.
» DOGEUSDT moved above EMA55 January 2024 and this produced a bullish jump.
» DOGEUSDT moved above EMA55 November 2020. This event preceded the 65,000% 2021 bull market.
» The date is now August 2025 and Dogecoin is trading safely above EMA55 after a minor advance. It managed to break this level as resistance and later confirm it as support.
If DOGEUSDT can remain above this level for just 1-2 weeks without crashing down, expect a major advance, and this is exactly what we expect will happen in the coming weeks. Dogecoin is going to grow massive with targets at $1.16 and $1.85.
Thank you for reading.
Namaste.
DOGE RSI Signals WeaknessDOGE’s Relative Strength Index (RSI) currently sits at 47.33, struggling to stay above the neutral 50 mark. This reflects a drop in buy-side momentum, adding weight to the bearish outlook that has been developing after recent sell-offs.
The RSI measures whether an asset is overbought or oversold. A reading above 70 often signals an asset is overbought and may face a correction, while levels below 30 indicate oversold conditions and the potential for a bullish reversal.
At 47.33, DOGE’s RSI points to weakening bullish momentum. This suggests that buyers are losing control of the market, making it difficult to sustain upward pressure. The latest price action shows sellers pressing harder, with limited resistance from bulls.

DODUSDT (Daily)🔎 Chart Context
• Pair: DOGE/USDT
• Exchange: Binance
• Timeframe: 1D (Daily)
• Date: 21 August 2025
This chart applies price action, supply & demand zones, and liquidity sweeps to map DOGE’s likely paths.
📊 Key Observations
1. Market Structure
• DOGE bottomed at 0.129 – 0.142 zone earlier in the year.
• A bullish change of character (CH D) occurred around 0.193, shifting bias upward.
• Since then, price has established higher lows (0.164, 0.168, 0.188) and higher highs (0.259, 0.2875) → confirming an uptrend on the daily timeframe.
2. Support & Demand Zones
• 0.188 – 0.206 zone: Strong demand, aligned with previous accumulation and mitigation.
• 0.164 – 0.168 zone: Secondary demand if the higher zone fails.
• 0.142 – 0.129 zone: Long-term base and ultimate defense for the bullish structure.
3. Resistance & Supply Zones
• 0.259 – 0.2875 zone: Heavy supply, marked as the upside target.
• Price has rejected this zone twice, indicating strong liquidity resting above.
• A breakout above 0.2875 would expose the next major resistance at 0.320 – 0.340.
4. Liquidity Behavior
• Below: liquidity pools around 0.188 (recent HL) and 0.168 (old base).
• Above: liquidity above 0.259 and especially 0.2875, where many stop orders cluster.
• The projection suggests a sweep lower into 0.188, then a bullish continuation toward 0.2875.
📈 Bullish Scenario (Higher Probability)
• Price retraces into 0.188 – 0.206 demand zone.
• Buyers defend the zone, leading to a reversal.
• Path: bounce → reclaim 0.23 → push into 0.259 → liquidity grab at 0.2875.
• A successful break of 0.2875 confirms continuation toward 0.320 – 0.340.
📉 Bearish Scenario (Lower Probability)
• Failure to hold 0.188 demand zone leads to a deeper correction.
• Next downside targets:
• 0.168 (secondary demand)
• 0.142 – 0.129 (long-term accumulation zone)
• This would still keep DOGE inside a macro bullish accumulation, unless 0.129 breaks.
⚡ Trading Plan
• Long Setup (Preferred Play):
• Entry: 0.188 – 0.206 zone
• TP1: 0.259
• TP2: 0.2875
• TP3: 0.320 – 0.340 extension
• Stop-loss: Below 0.188 or conservative below 0.168
• Short Setup (Countertrend, Risky):
• Entry: 0.259 – 0.2875 supply zone rejection
• TP: 0.206 – 0.188 demand zone
• Stop-loss: Above 0.29

Doge Make A and B Now Go to CDoge Make A and B Now Go to C
Take Profit
Tp
0.35
0.37
0.40
0.42 Very import
0.45
0.47