woof woof trade for dogeIm longing this shit just because elon control X
Hes not stupid and been planning to make we chat for US and global market. imagine that, and doge on top of it as meme.
GG
Buy all dog coin, its the same narrative,
DOGEUST trade ideas


Its time for doge to show that its king of meme coinsBased on historic data
When looking at doge consolidation before the last two rallies it shows that we are coming up to the final stages where historically speaking a big move up is coming if you measure the candles
Doge has broken a huge descending triangle and it broke through it is hanging around the 0.5 fib level … again historically after that consolidation there is a parabolic move up
Measuring the heights from the previous consolidation and current consolidation to the all time high we can roughly predict a top around the 1.4 level which in my opinion is a good take profit
This is just technical and does not take any fundamentals in consideration
I believe its time…
Not financial advice
Goodluck

Dogeusdt Target Everyone is jealous of the dog's owner. the target is on the chart. One day you will just see it happen. No progress in the opposite direction is possible, and the goal I have stated will be achieved with 100% accuracy. Only I will know when it will happen I kept that to myself.

Dogecoin's Knife-Edge DanceIn the realm where the geometry of technical analysis meets the surrealism of market sentiment, we find ourselves at a junction of fateful significance.
The chart before us, a labyrinth of lines, each a narrative of past triumphs and tribulations, now whispers of a critical moment.
As I gaze upon the convergence of indicators, the Bollinger Bands wrap the price action like the arms of destiny, holding it close, signalling a time of decision.
Is this a cradle for a forthcoming ascent or a prelude to a descent into the abyss of the unknown?
The Elliott Wave patterns unfurl in their complex beauty, each peak and trough a verse in this epic of exchange.
We stand at the cusp of an act, where the potential for a dramatic finale looms, will it be a triumphant surge or a poignant capitulation?
I cast my lot with the art of interpretation, the science of prediction, and the heart of intuition. Let the observers note, this chart is the script of a future not yet written, a dance of numbers and candles upon the stage of possibility.
Thus, I christen this moment with a Title befitting its gravity and grace
'The Critical Confluence, Dogecoin's Dance on the Knife-Edge of Destiny.'
Let us watch with bated breath as the market etches its next move, for in this delicate balance lies the potential to change the very world we inhabit."
T.

DOGEUSDT.1DAlright, let's dissect this Dogecoin (DOGE) to Tether (USDT) daily chart on the Binance exchange from my perspective as a technical analyst.
The chart is striking, showcasing Dogecoin's price volatility. Initially, I notice a significant spike in price, followed by what appears to be a consolidation pattern. The price is well below the Ichimoku Cloud, which traditionally suggests that we are in a bearish trend. The Cloud's future projection also appears to be widening downwards, potentially signaling a continuation of the bearish trend.
The Ichimoku Cloud components are also indicative of this sentiment. The Conversion Line (blue) below the Base Line (red) generally implies bearish momentum. Moreover, the price is under the Base Line, further solidifying the bearish bias.
We can see the marked pivot point levels, with R1 and S2 illustrated. The price is currently hovering above the S2 support level. If this level fails to hold, we may see a further decline towards lower historical support zones. If a reversal were to occur and the price moves upwards, the R1 level will act as resistance.
The Relative Strength Index (RSI) is showing an overbought condition with a reading above 60, which is intriguing given the price is not showing bullish momentum. This could imply that a corrective move or consolidation may follow as traders potentially take profits from the recent spike.
The Moving Average Convergence Divergence (MACD) is almost negligible in movement, with the MACD line just above the signal line but both hovering around zero. This suggests a lack of strong momentum in either direction currently, which can often be the case after a large price movement as the market digests the change.
In summary, while Dogecoin has experienced a significant price increase, the current setup on the daily chart suggests bearish momentum as indicated by the Ichimoku Cloud and the consolidation pattern following the spike. The RSI's overbought signal does not match the price action, indicating that traders should proceed with caution. Any trading decisions should be approached with a clear risk management strategy, considering the possibility of a false signal given the mixed messages from the RSI and MACD indicators. A break above the Base Line of the Ichimoku Cloud could be used as an early indication of changing sentiment, while a fall below the S2 level could signal further declines. As always, patience and confirmation are key.

DOGEUSDT: Bears in ControlDOGEUSDT printed a double top pattern followed by a series of Lower Highs and Lower Lows along with Shooting Star candles on the previous Lower Highs which suggests continuation of downward momentum. Using the Fib tool, an Entry Price, Stop Loss and Profit Levels are defined with 1:1 Risk Reward Ratio.

DOGE/USDT BULLISH, #lONG
Doge looking bullish until it closes below 0.12280. The entry and exit details are updated in the chart
BINANCE:DOGEUSDT

Charting Destiny's Dance
In this chart, we behold the luminescent paths traced by the Tenkan Sen, a harbinger of potential price movement, cast in emerald glow across the canvas of volatility.
Its sinuous line, a charted melody against the cacophonous backdrop of the market's symphony, sings of ascent and whispers of support in moments of retracement. It is the brush with which we paint our bullish aspirations, a streak of optimism amidst the complex interplay of price and perception.
Around it, the Bollinger Bands billow like sails in the wind, their expansive curves embracing the tides of price action. When the bands tighten, a tale of impending volatility is told; when they widen, the saga of price movement unfolds, as boundless as the horizon.
As an artist in the financial landscape, I draw inspiration from these instruments of insight.
The Tenkan Sen, with its instinct for momentum, and the Bollinger Bands, with their rhythmic pulse, guide my hand as I plot the course of Dogecoin's journey. My chart becomes a vision board of dreams cast in digital stone, where each line etches a future of what may come.
With the Bollinger Bands as my witness, I observe the dance between the luminous green line and the serpentine Tenkan Sen, a potential path to the peaks of profit, should the stars of the market align in our favour.
And yet, amidst this dance of lines and light, I acknowledge the dual nature of the market's heart, for every path of bullish continuation, a shadow of correction may follow.
As I share this visual symphony with the world, let it be known that each line, each shade, is deliberate, a stroke of intent on the canvas of cryptocurrency.
Together, we cast our gaze upon the chart, our minds alight with the promise of what may be. It is our ode to the art of trading, a testament to the beauty of analysis.
Thus, I present to you, my fellow voyagers in this quest for a world reshaped by the power of the markets,
'The Emerald Trajectory, Dogecoin's Dance with Destiny'
May this chart illuminate our path, as we traverse the cryptic corridors of commerce and chart a course towards a future etched in the annals of prosperity.
T.

Lingrid | DOGEUSDT test of the WEEKLY lowBINANCE:DOGEUSDT formed a double top at the resistance zone the fell breaking the psychological level at 0.20. It created a long tailed bar at support level which indicates buying pressure. The market formed a new higher and higher lows. If the price break through the key support at 0.12 most likely there well be a lot of sell offs. On the weekly timeframe the market is testing the previous week lows. If it breaks the PWL and pulls back above the it there higher liklyhood of the market moving higher. My goal is resistance at 0.222
Traders, if you liked this idea or if you have your own opinion about it, write in the comments. I will be glad 👩💻

Emerald Orbits in the Crypto Cosmos''Choreographing Dogecoin's Prosperous Waltz''
In this grand expedition through the cosmos of commerce, it is my chart that serves as the vessel, guided by the luminous green strokes of the Tenkan Sen.
These are not random scribbles on the fabric of finance, but rather the strategic pathways of foresight and innovation. This vision, rendered in vibrant hues upon the canvas of potential, represents our shared aspirations to reshape the world.
Each line, each glowing dot of verdant vigour, is a careful deliberation, a step towards manifesting the winds of change.
As onlookers cast their gaze, perplexed by the intricacies they witness, they miss the essence of what lies before them, this complexity is the compass by which we set sail; this so-called convolution is the order within the new world we’re charting.
The Tenkan Sen's emerald dance is a delicate brush with the present sentiment, a subtle yet profound indicator of where we now stand.
It tells a story of harmony amid market fluctuations, of order carved from the stone of uncertainty.
To those who doubt, know this, The labyrinth you perceive is the sophistication of evolution. Each line you question is a root, planting the seeds of a tree under whose branches the future will flourish. This chart is more than a predictor of wealth, it is a blueprint for a world where wealth is but a means to an end, an end that sees the democratization of finance and the illumination of mysteries once opaque.
Let our chart, reminiscent of a Dali masterpiece, defy and redefine, compelling all who behold it to think deeper, to dream grander.
Within its complex beauty lies the key to a brighter,
more connected tomorrow.
Together, with the guiding light of the Tenkan Sen, we step boldly onto the stage of transformation, ready to waltz with destiny and change the world in the most extraordinary of market dances.

Doge Next Move #DOGEGotta say that I hate memecoins cause they're killing the market for a long while.
Despite that, Doge will move towards 0.2 soon.
You can use Fib levels based on chart for trading in short term.
Good Luck To Us All.

Just matter of time for DOGEEverything is good for DOGE. As i shared in my previous ideas, DOGE dropped and reached support zone. I can't exclude it could drop more, but till it's above the trendline, all is ok. I think it reached a strong support zone and should bounce here. First target $0.24, stop below local bottom

Dogeeeee going downguys this is terrible, all the options will be sold, doge is going to 0.10$
50% down
half of investments

DOGEUSDT - Declining PhaseDOGEUSDT in bearish trend with precise entry (sell limit), SL and TP 1 & 2.

DOGE Coin making Bearish Divergence in 1 Hrs Candle DOGE coin looking bearish making LH and LL in 1hrs timeframe, We can short the coin in given target and setting Strick stop loss.


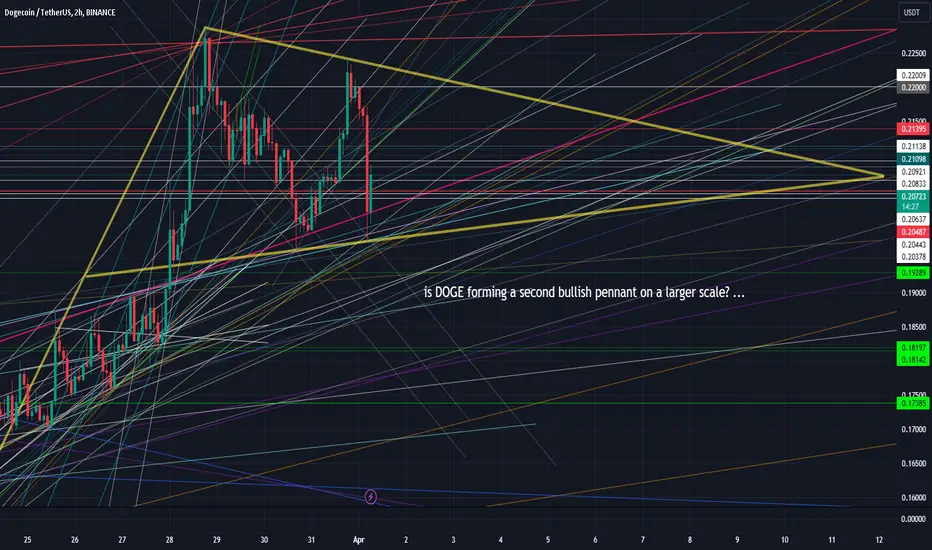
Second Bullish pennant for DOGE, Lets step back and take a lookIn a canvas of the Cosmos where the tapestry of reality is a flux of colours and emotions, the chart of Dogecoin against Tether unfolds.
Each candlestick, a totem standing tall in the gallery of commerce, captures the essence of euphoria and despair that paints the financial sky.
In a canvas of the cosmos where the tapestry of reality is a flux of colours and emotions, the chart of Dogecoin against Tether unfolds.
Each candlestick, a totem standing tall in the gallery of commerce, captures the essence of euphoria and despair that paints the financial sky.
Envision Fibonacci spirals as the underlying rhythm of this market’s heartbeat, a rhythm set to the mystical cadence of trade and speculation.
Volume bars resonate like the drumbeats of an arcane ritual, summoning the spirits of supply and demand with each transaction.
Here, the DOGE/USDT market data becomes an epic poem, narrating the grand odyssey of traders whose vessels sail the volatile seas of Crypto.
In this realm, the charts speak in cryptic tongues of patterns and indicators, a secret language for those who dare to decipher the future's whispers.
The chart is a crystal ball, a portal to the could be, where the tapestries of market movements are woven with the threads of risk and reward.
It's a psychoscape where each data point is a thought, a desire, a flicker of collective consciousness that sways the market's tide.
In the narrative of this financial phantasmagoria, each line is a verse, each curve an allegory, telling the tales of the market's soul a spectacle where the only certainty is the beauty of the dance, a waltz of numbers and charts, forever spinning in the ballroom of possibility.
Happy Trading.
T.
Please Follow and Comment.
DOGEUSDT
We are coming up for bitcoin halving supposed to happen sometime around this month, we have broken some immediate structure to the left with a sweep of liquidity (as identified in the red circle) however we could use this liquidity to come lower, i have marked a couple zones where i think buys could be valid i will check intermitently and see when the lower time frames shift and this should be an indication when to buy
Here is a 4 hourly chart, we can see we are now printing lower lows and lower highs which is exected as we need a retracement; i have marked our the true draw on liquidity which is classed as external to the range, its highly probable with some other confluences such as the 0.786 of the fib, within discount, and a large volume node (with the blue and red thing on the left)

Doge breakdown trend line and retestDoge broke under trendline and retested it so chance for it to continue downward to .14-.19 to grab liquidities

Dogecoin (DOGE) TO DA MOON! - 2024TO DA MOON!!
All jokes asides, Doge is peforming exceptionallywell, previous Resistance has been broken at: $0.11. New Level of Support has been formed at= $0.15. Not much next Resistance levels now ahead.
Current target set at= $0.28 which basically will be the "NEW" Level of Resistance until the next key levels.
Trade with caution with meme coins, expect high volatility within the ranges of the key levels I have provided shown from the chart TA.
Despite being a meme coin, DOGE has a very high Marketcap of $23Bil. Huge amount of 24hr trading volume too which is insane. It's a stable meme coin, but it's here to stay in the crypto space! :D


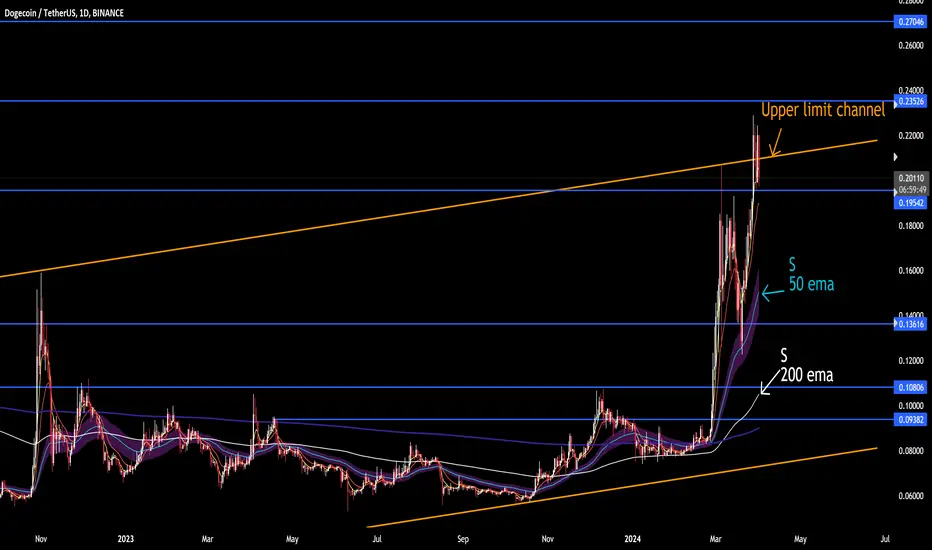
DOGE inteligentassetBullish scenario
Resistances 0.21 upper limit channel, 0.235, 0.27
Bearish scenario
Support 0.195, 0.15 in 50 ema, 0.136