DOGE/USDT MarkupAnother Saturday and another chart -- directions? I hope it helps to give some guidance. I feel we need to give that WEEKLY FVG a big dirty sweep before another major upward pounding.
Trade ideas

DOGE/USDT – 1H | FVG + Liquidity TrapPrice respected the daily FVG and set up a bullish reaction.
FVGs often act as high-probability demand zones.
Liquidity sweeps at highs/lows fuel the next move.
Stops safely below structure.
This is a textbook SMC sequence:
Respect → Sweep → Expansion.
Daily FVG respected ✅
Prior high liquidity swept ✅
Targeting highs above for clean 3R+
*IGNORE THE DAY NAMES ON DAILY CANDLES - Current 5 candles.

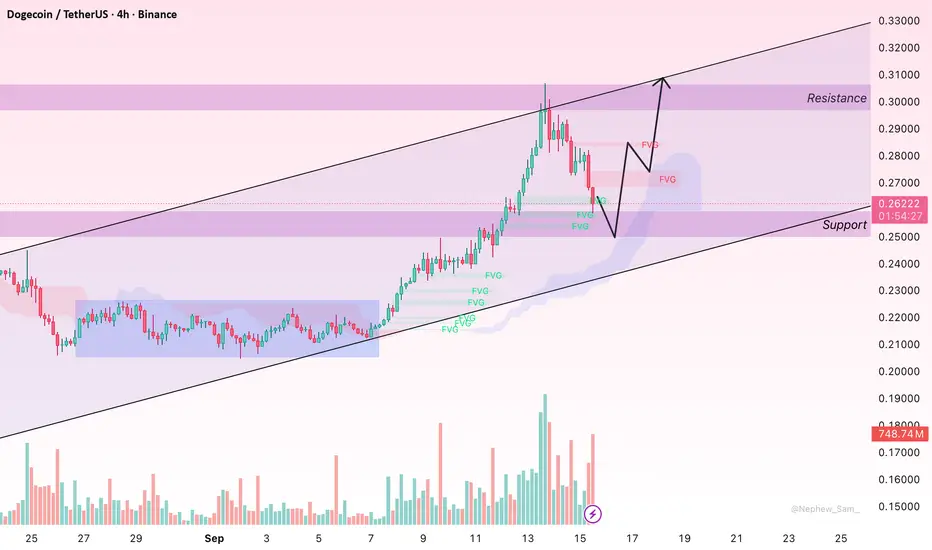
Lingrid | DOGEUSDT Bull Run Retracement PlayThe price perfectly fulfilled my previous idea . BINANCE:DOGEUSDT has shown strong bullish momentum, breaking through a triangle pattern and extending toward the 0.3080 resistance zone. After topping out, price pulled back into the upward trendline, where buyers are attempting to re-establish control. Holding above 0.2600 keeps the bullish structure valid, with potential for another test of 0.3000 and higher levels. The broader trend remains constructive as long as higher lows are maintained.
⚠️ Risks:
A breakdown below 0.2600 could shift momentum and expose 0.2015 support.
Weakness in overall crypto sentiment may cap DOGE’s upside.
Sudden volatility from BTC dominance shifts could pressure DOGE short term.
If this idea resonates with you or you have your own opinion, traders, hit the comments. I’m excited to read your thoughts!

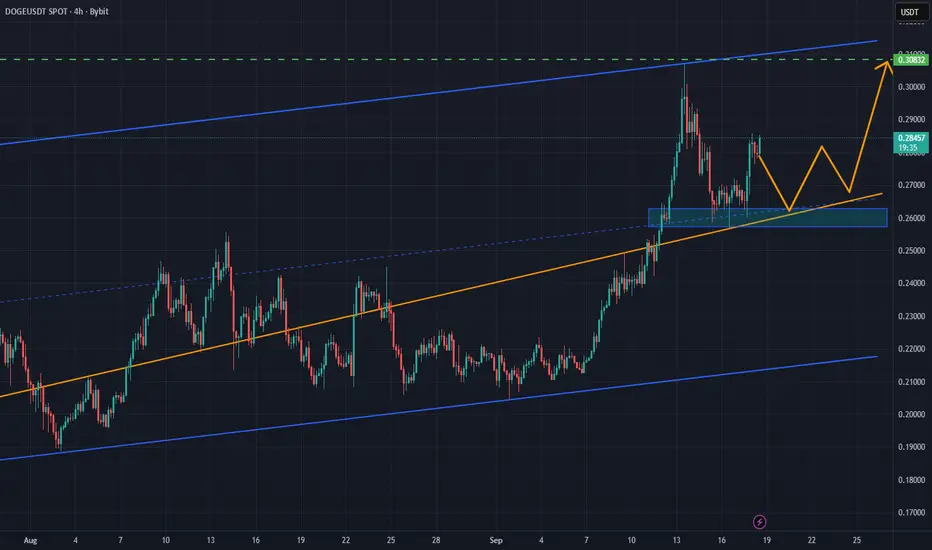
DOGE/USD Weekly Outlook: Bulls Target $0.349 After ETF LaunchPair: DOGE/USD
Current Price: 0.308
Trend: Testing violet resistance zone
⸻
🔵 Market Overview
Dogecoin rebounded after a retest of the breakout area near 0.256, gaining momentum as the first Dogecoin ETF launched on Wall Street. A widening upper Bollinger Band supports the bullish outlook, with targets above 0.349 now in play.
⸻
📊 Bullish Targets
• 0.286 / 0.310
• 0.349 (golden pocket)
• 0.365
• 0.410 / 0.435
• 0.466
• 0.480 / 0.500
📉 Bearish Targets
• 0.260 / 0.245 (20-day EMA)
• 0.237
• 0.217 / 0.209 (23% Fib, 200-day EMA)
• 0.189
• 0.177 / 0.170
• 0.156
• 0.143 / 0.131
⸻
🔎 Indicators
• RSI (daily): 66, still room for gains.
• RSI (weekly): Fresh buy signal supports bullish bias.
• Trend: Above EMA cluster, buyers remain in control.
⸻
📈 Trading Scenarios
Scenario (Bullish Continuation)
• Recommendation: BUY STOP
• Entry Point: 0.310
• Take Profit: 0.349, 0.365, 0.410
• Stop Loss: 0.286
Alternative (Bearish Breakdown)
• Recommendation: SELL STOP
• Entry Point: 0.260
• Take Profit: 0.237, 0.217
• Stop Loss: 0.273

DOGE/USDT: Bullish Structure Intact Above Key Support ZoneDOGE/USDT has displayed strong bullish momentum, breaking out of a triangle pattern and extending toward the 0.3080 resistance zone. Following the peak, price has pulled back to retest the upward trendline, where buyers are stepping in to defend support.
As long as price holds above the 0.2600 level, the bullish structure remains valid, with potential for a retest of 0.3000 and possible extension to higher levels. The broader trend stays positive, supported by the continuation of higher lows within the current market structure.
DOGECOIN BREAKOUT CONFIRMED BULLISH DOGEUSDTDOGECOIN 🚀 Breakout Confirmed – $1.15 on the horizon
One month ago we highlighted DOGE’s 1D Golden Cross (first in 9 months) inside the 2Y Bullish Megaphone. Now the breakout is confirmed ✅.
Historically, these Golden Cross rallies peak near the 3.618 Fib extension — projection still points at $1.15 before year-end 🎯.
Kaizo precision. Bullish phase unleashed 🥷🔥

Doge - new long after rangeDoge - new long after range
Doge hit 1st key resistance
time to book part of profit
new plan is simple - wait for a range and take long

DOGE Breakout or Bull Trap? Read Before You Enter!Yello Paradisers! Could this be the breakout that finally sends DOGE flying, or is it just another trap designed to lure in early bulls before dumping hard? If you’re thinking about entering here, you’ll want to read this entire breakdown — because the price action is sending mixed signals, and it’s critical to stay sharp right now.
💎DOGEUSDT has just broken out of a classic falling wedge pattern — a historically bullish setup that often marks the end of a corrective phase. What strengthens this move even more is the presence of a hidden bullish divergence on the RSI and a bullish divergence on the MACD, both suggesting that momentum is building to the upside. In addition, we’ve now seen a bullish CHoCH (Change of Character) right after a liquidity grab, which further increases the probability that this could be the start of a new impulsive move upward.
💎That said, the current risk-reward ratio from this level is sitting at around 1:1, which is not ideal for a high-conviction trade — especially if you're managing capital with a long-term mindset. For that reason, the more strategic move here would be to wait for a pullback and watch for a strong bullish candlestick confirmation on the lower timeframes. This would offer a better entry with improved risk-reward, giving you more confidence and cleaner structure to trade off.
💎Still, if you're an aggressive trader, taking a small position now with that same 1:1 RR could make sense — but only if your risk is clearly defined and well managed. Chasing a breakout without a confirmed entry trigger or without patience could cost you, especially in a choppy market like this one.
💎However, if DOGE breaks back down and closes below the invalidation level, then the entire bullish setup is invalidated. In that case, it’s best to step aside, wait for cleaner structure, and only re-enter once we see stronger bullish confirmation or a new range develop.
🎖We are playing it safe right now. If you want to be consistently profitable, you need to be extremely patient and always wait only for the best, highest probability trading opportunities.
MyCryptoParadise
iFeel the success🌴

$DOGE entering a long position @ $0.272CRYPTOCAP:DOGE entry right now at $0.272.
Stop loss at $0.255 to account for volatility.
We had a great volume spike during a breakout above both 50 and 200 SMA and now ready to start Wave 5 targetting 33c.
Still risky so soon after FED rate cut, but willing to risk some here, stop loss is a must as always💙👽

$DOGE bullish on the DAILY. Wave 5 incoming soon.CRYPTOCAP:DOGE is looking very strong after retesting a breakout above the long-time resistance area around $26c.
Clear Elliot's Wave 4 playing out with expected support just below and we could get a nice Wave 5 money making ride which could easily take liquidity around 30-31c and overextend so this has to monitored on lower timeframes for entry.
Stay tuned 💙👽

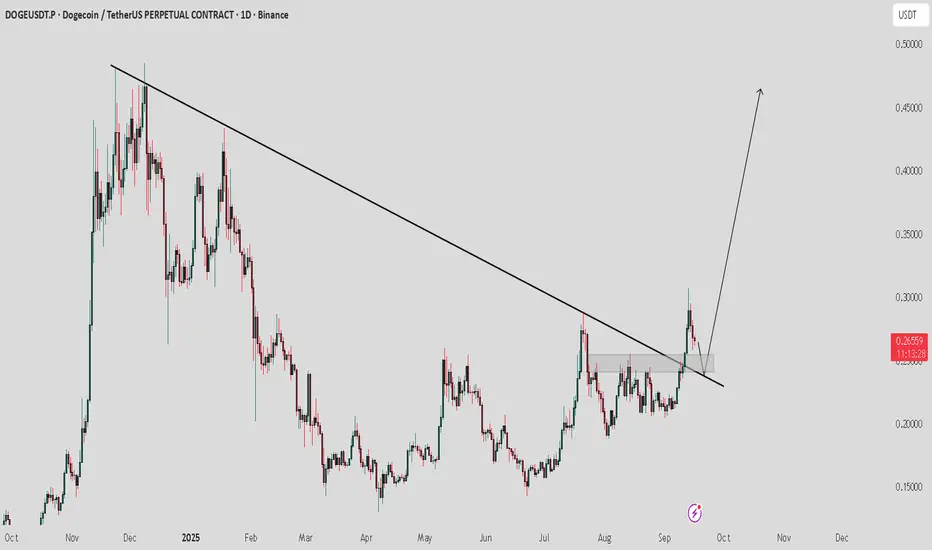
DOGE/USDT – Daily OutlookDogecoin has broken above the medium-term downtrend and is now retracing into demand zones on the daily timeframe.
Primary demand is located around 0.25. If price respects this level, continuation to the upside remains likely, with the next target at the supply area near 0.317.
Secondary demand lies lower at 0.223, which may act as the next area of interest if the primary demand fails to hold.
The overall structure remains bullish as long as demand levels are respected. The supply zone at 0.317 serves as the key upside target and resistance to watch for the next potential move.

DOGE/USDT —Golden Pocket Retest, Rally Toward Key Resistance?
Full Analysis
Dogecoin (DOGE) has just made a significant move on the Daily timeframe (1D). After spending months in consolidation, price has finally broken out from a long-standing supply zone and is now undergoing a retest at the Golden Pocket Fibonacci zone ($0.240–$0.249).
This breakout marks a potential shift in market structure to bullish, as the zone that once acted as resistance could now flip into strong support. Such setups are classic in technical analysis: Breakout → Retest → Continuation, provided the key support holds.
---
🔑 Key Technical Levels
Current Price: $0.265
Primary Support (Golden Pocket): $0.240–$0.249 (Fib 0.5–0.618)
Minor Resistance: $0.273–$0.289
Major Resistance: $0.332–$0.342 (supply zone & previous high)
Critical Support if breakdown: $0.129 (multi-month low)
---
📊 Structure & Pattern
Clear Breakout → Retest → Potential Continuation formation.
Golden Pocket acts as a strong demand zone, adding confluence for a potential bounce.
As long as DOGE holds above $0.240–$0.249, the higher-low structure remains intact, supporting bullish continuation.
The next major challenge lies at $0.332–$0.342, which could act as a supply block before any push towards psychological levels like $0.40–$0.45.
---
🚀 Bullish Scenario
1. If price holds above $0.249 and closes above $0.273–$0.289, this would confirm short-term bullish continuation.
First target: $0.332–$0.342.
Upside potential: ~+25% from current levels.
2. If price dips back into the $0.240–$0.249 Golden Pocket and bounces with strong reversal candles + volume, it offers a solid long opportunity.
Conservative entry: inside the Golden Pocket.
Stop loss: below $0.235.
---
🐻 Bearish Scenario
1. Failure to break above $0.289–$0.332 could lead to a rejection, pushing price back into the Golden Pocket zone ($0.240–$0.249).
2. A daily close below $0.240 would invalidate the bullish structure, opening the door for a deeper correction toward $0.190 or even the $0.129 multi-month low if selling pressure accelerates.
---
📌 Conclusion
DOGE is at a critical decision point:
As long as the $0.240–$0.249 Golden Pocket holds, the bullish structure remains valid.
A break and daily close above $0.289 strengthens momentum toward $0.332–$0.342.
A breakdown below $0.240, however, flips the setup bearish and could trigger deeper downside.
In short, Dogecoin is setting up for its next major directional move, and traders should carefully watch reactions at the Golden Pocket and resistance at $0.289–$0.332.
---
#DOGEUSDT #Dogecoin #Crypto #Breakout #GoldenPocket #Fibonacci #TechnicalAnalysis #SwingTrade #Altcoins

DOGE/USDT 1hr scalpFalling slop
Easier breakout; follow slope momentum
Use a tight stop just beyond the wick to avoid getting caught if the stop hunt continues.

DOGE / USDT : Expecting strong move after successful retestDOGE/USDT has broken out from trendline resistance with strong potential. Currently, a retest is in progress — a successful retest could trigger a bullish rally towards $0.40 – $0.50.
📌 Always wait for confirmation of the bullish move and manage risk wisely.
Dogecoin Price Needs $0.29 Break To Regain StrengthBINANCE:DOGEUSDT price is holding near $0.26 after a sharp pullback. On the 4-hour chart, the RSI shows a hidden bullish divergence: price has made higher lows since September 7, while RSI has made lower lows. This pattern often signals weakening selling momentum and a chance for the uptrend to resume. Key supports sit at $0.25 and $0.23.
The critical hurdle is $0.29. Reclaiming this level would confirm strength and open the door to $0.30+, while a drop under $0.23 would cancel the bullish case for now.
On-chain data adds context. In the past week, 4.96B DOGE (≈$1.29B) flowed into exchanges, showing retail selling. Yet whales stepped in, buying about 890M DOGE (≈$231M), absorbing nearly one-fifth of that pressure. This buying, combined with the RSI setup, keeps $0.29 in focus as the line that could decide BINANCE:DOGEUSDT ’s next move.

DOGEUSDT major daily support is 0.23$ and target 0.4$If our major daily support hold which is 0.23$ to 0.25$ then DOGE can pump more and heavy to the next targets which are mentioned on the chart.
else we may have more range and short-term dump for a while but market now is still extremely bullish and gain is expected like green arrows.
DISCLAIMER: ((trade based on your own decision))
<<press like👍 if you enjoy💚

DOGE Bullish ideaWatching Doge slowly build momentum in this range.
Current retrace may continue until the end of September but expecting a pivot around that time and around the 0.238 level where I see lots of support. Will watch for a reaction otherwise will wait for lower, with the previous low being my invalidation.
Expecting to see a massive upleg if the macro bullish sentiment continues.
#DOGE/USDT is about to blast off! Study internet bubble stocks.#DOGE
The price is moving within a descending channel on the 1-hour frame, adhering well to it, and is heading for a strong breakout and retest.
We have a bearish trend on the RSI indicator that is about to be broken and retested, which supports the upward breakout.
There is a major support area in green at 0.2520, representing a strong support point.
We are heading for consolidation above the 100 moving average.
Entry price: 0.2658
First target: 0.2727
Second target: 0.2835
Third target: 0.2947
Don't forget a simple matter: capital management.
When you reach the first target, save some money and then change your stop-loss order to an entry order.
For inquiries, please leave a comment.
Thank you.

Dogecoin: Waiting for confirmation at 0.30 USDHi everyone, Dogecoin recently surged from 0.22 USD up to 0.30 USD, clearly reflecting strong inflows into this altcoin. However, the 0.30 USD area has turned into a solid resistance zone, with selling pressure pushing the price back to around 0.26 USD. A retest of the 0.28–0.30 USD region will be crucial in determining whether DOGE can sustain its upward momentum.
On the support side, the 0.22–0.23 USD FVG zone acts as a key buffer. If price dips deeper but holds this area, the likelihood of DOGE bouncing back to continue the uptrend remains high. Additionally, staying above the Ichimoku cloud suggests the bullish structure is still intact. Trading volume has tapered off recently, reflecting investor caution, but a clear breakout above 0.30 USD could open the way for higher targets.
What’s your view – will DOGE maintain its momentum, or will we see a deeper pullback first?
DOGUSDT: Potential Reversal at Key Level in Rising ChannelHey everyone, Ken here!
Right now, I'm closely watching DOGUSDT and it seems like it might be going through a correction phase as the price tests the lower boundary of the rising channel. This is a key level, and if the price bounces from here, I believe it could continue towards the next target around 0.3200.
However, if the price breaks below this support, the bullish outlook would weaken, and we could see further declines. That’s why I always pay close attention to price action and trading volume to identify solid buying opportunities.
Risk management is essential in trading, so I always make sure to carefully confirm setups and trade with caution. What do you think about the current situation? Feel free to share your thoughts in the comments!

Dogecoin is about to blast off! Study internet bubble stocks.I believe Dogecoin will see a strong run all the way to a new all-time high. When you study other market cycles, like Apple during the internet bubble, you see the same story told over and over again with subtle differences. Watch for a big bull market ahead.
As always, stay profitable.
– Dalin Anderson

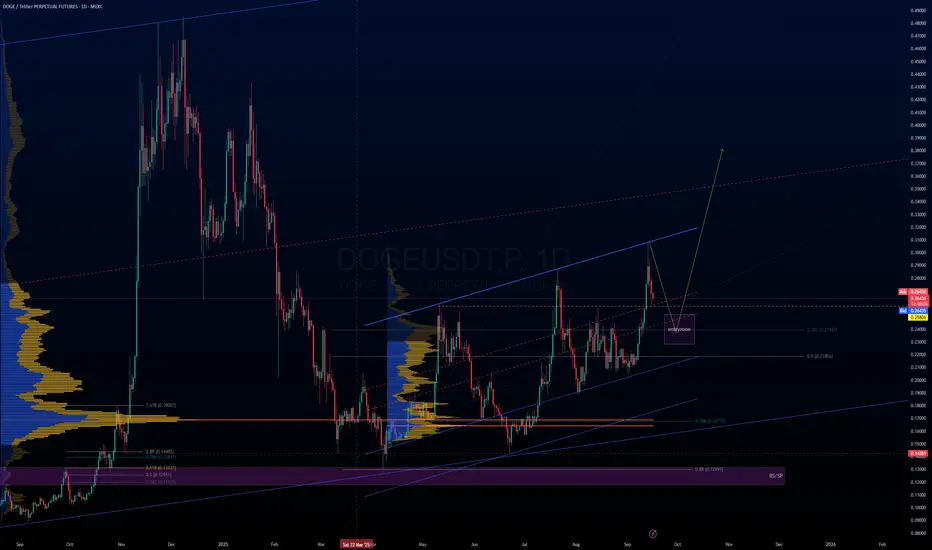
DOGE 1D – Liquidity Above 0.43, Fib Support BelowDogecoin tapped the daily FVG around 0.29–0.30 before rejecting, now retracing into Fibonacci support. Liquidity levels remain clear both above and below.
FVG at 0.29–0.30: Initial rejection confirms this as a strong supply zone.
Liquidity Pools: Lower liquidity near 0.142, upper liquidity sitting around 0.478.
Fib Supports: 0.248 (0.5), 0.234 (0.618), and 0.214 (0.786) are key levels for reaction.
Intermediate Resistance: 0.433 dotted line marks the next upside target if 0.30 is reclaimed.
Momentum indicators show cooling from overbought, but defending Fib levels keeps the path open for continuation toward upper liquidity.

Potential Bullish Reaction at POI _ $DOGE/USDT (4H).Description:
Bias: Long / Bullish reversal potential
Setup details:
• Price has entered a key Point of Interest (POI) zone and shown rejection candles at that area.
• Likely support confluence based on prior structure.
• If bulls manage to hold this zone, price could target ~$0.30+ in the coming sessions.
Why it matters:
• Good risk/reward entry if stop loss is placed just below POI.
• Useful for futures / swing traders waiting for confirmation.
Timeframe: 4H
Trade idea type: Long
Feel free to leave your thoughts on alternative targets / SL placements! #DOGE #Crypto #Trading
