#DOGS – Launchpad or Breakdown?
#DOGS
The price is moving within a descending channel on the 4-hour frame and is expected to break and continue upward.
We have a trend to stabilize above the 100 moving average once again.
We have a downtrend on the RSI indicator that supports the upward break.
We have a support area at the l
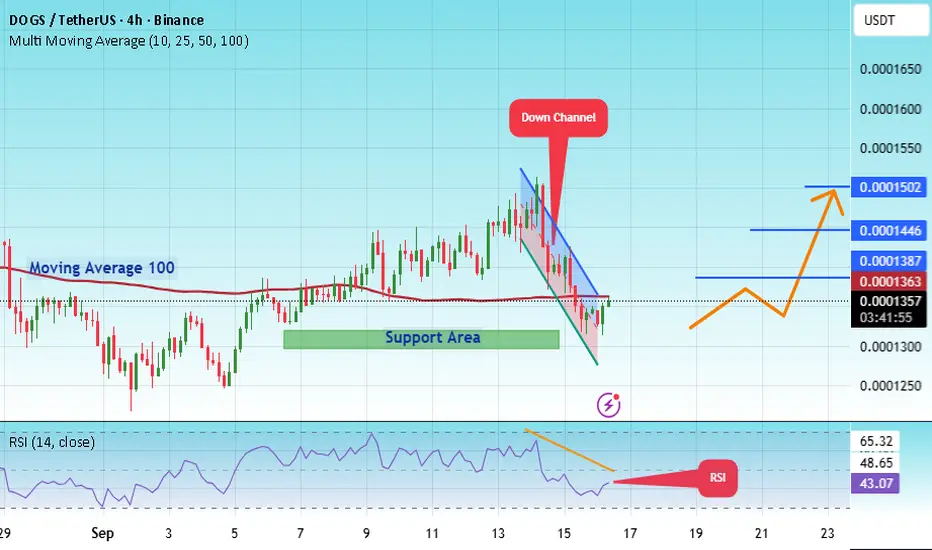
#DOGS/USDT – Launchpad or Breakdown?#DOGS
The price is moving within a descending channel on the 1-hour frame and is expected to break and continue upward.
We have a trend to stabilize above the 100 moving average once again.
We have a downtrend on the RSI indicator that supports the upward break.
We have a support area at the low

DOGS SIGNALHello friends
Given the decline we had, the price has been trading in a range for a long time in a support area.
You can see that once the buyers attacked the ceiling of the range, but they were met with a reaction from the sellers and the price could not break the range and fell to the bottom of
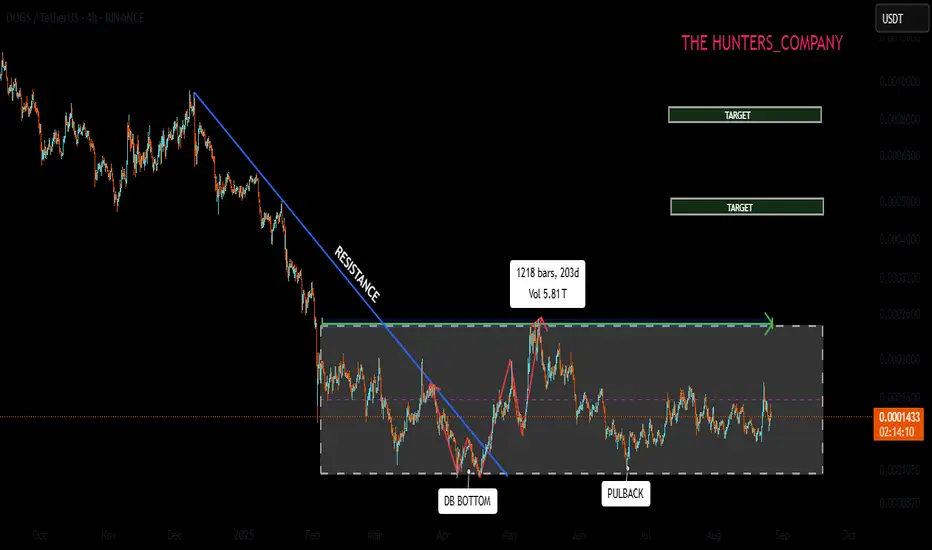
Dogs · The Bottom Structure · Accumulation Continues But...Notice here how DOGSUSDT continues to trade long-term at bottom prices. Notice how on 23-August the highest volume since March came up. Notice how there are always big green buying days but no significant big red selling days, when it comes to volume.
The action at bottom range has now been ongoing
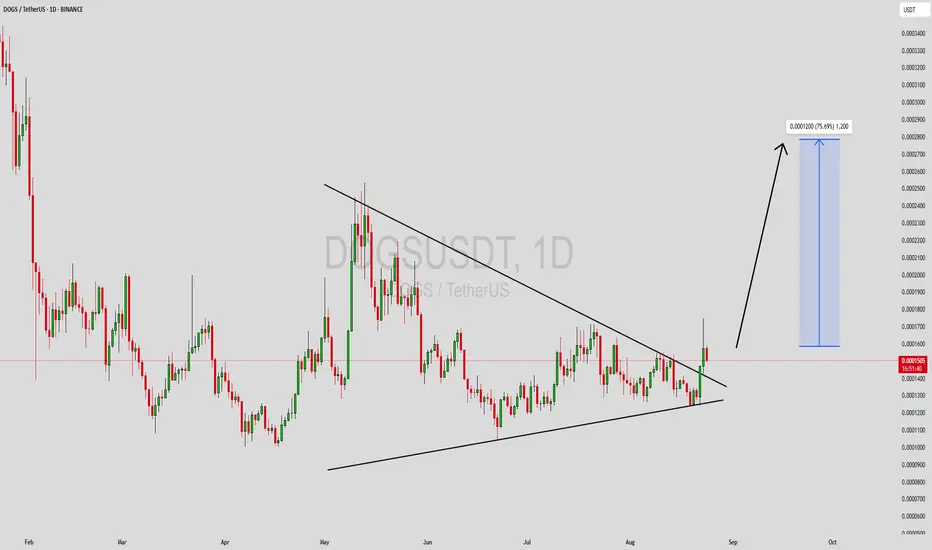
DOGSUSDT Forming Symmetrical TriangleDOGSUSDT is showing an interesting technical setup as price action breaks out of a long-term symmetrical triangle pattern. This breakout, supported by good volume, suggests that bullish momentum could be building for the next major upward wave. Historically, such breakouts often lead to strong conti
#DOGS/USDT – Launchpad or Breakdown?#DOGS
The price is moving within an ascending channel on the 1-hour frame, adhering well to it, and is poised to break it strongly upwards and retest it.
We have support from the lower boundary of the ascending channel, at 0.0001280.
We have a downtrend on the RSI indicator that is about to break

#DOGS/USDT — Capitulation Zone. Is the Breakout Coming?#DOGS
The price is moving within an ascending channel on the 1-hour frame, adhering well to it, and is poised to break it strongly upwards and retest it.
We have support from the lower boundary of the ascending channel, at 0.0001366.
We have a downtrend on the RSI indicator that is about to break

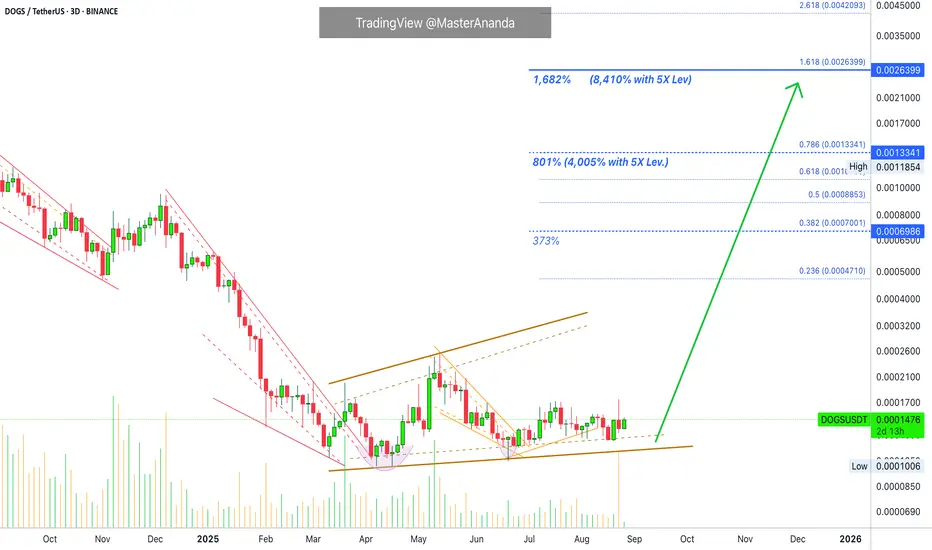
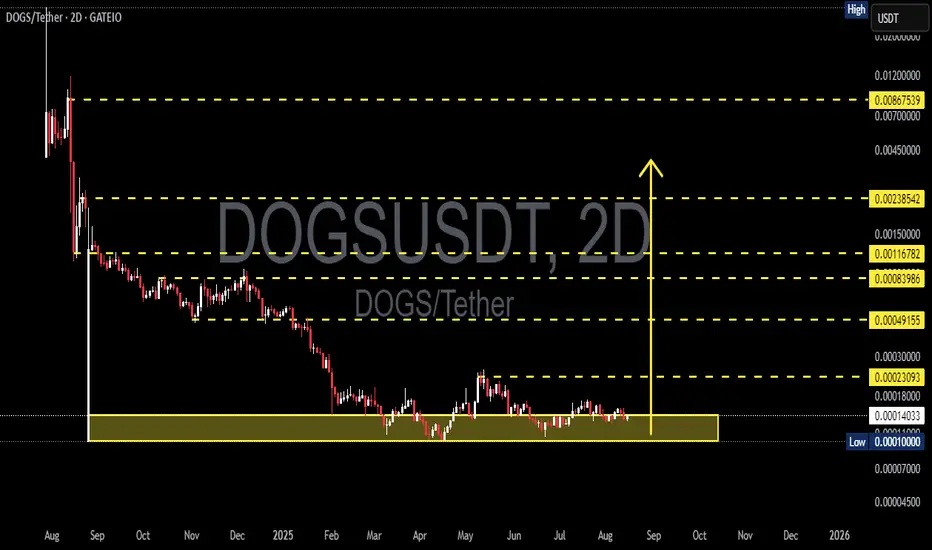
DOGSUSDT — Accumulation Zone, Preparing for a Major Breakout?DOGS/USDT has been consolidating for months inside the historical support zone at 0.00010–0.00018 (yellow area). After a sharp decline since its listing, price action has shifted into a prolonged sideways phase, often seen as a classic accumulation pattern before a potential major move.
This stage
$DOGS – Is This Telegram Mini-App Token About to Wake Up?Yo traders, Skeptic from Skeptic Lab! 🩵 Breaking down SEED_ALEXDRAYM_SHORTINTEREST1:DOGS with a skeptical lens — weekly still bearish, daily stuck in consolidation, but key breakout levels could flip the script.
📊 Weekly & daily analysis
📈 4H trigger levels with volume & RSI confirmations
⚠️ W

Momentum Building: DOGS Could Surge 18% To 0.0001777Hello✌️
Let’s analyze DOG’s price action both technically and fundamentally 📈.
🔍Fundamental analysis:
DOGS uses Telegram’s TON wallet to airdrop 70% of supply to 17M wallets, making onboarding simple. Since July 2025, its charity portal has sent $515K+ to shelters and aid groups, aiming for 6

See all ideas
Summarizing what the indicators are suggesting.
Oscillators
Neutral
SellBuy
Strong sellStrong buy
Strong sellSellNeutralBuyStrong buy
Oscillators
Neutral
SellBuy
Strong sellStrong buy
Strong sellSellNeutralBuyStrong buy
Summary
Neutral
SellBuy
Strong sellStrong buy
Strong sellSellNeutralBuyStrong buy
Summary
Neutral
SellBuy
Strong sellStrong buy
Strong sellSellNeutralBuyStrong buy
Summary
Neutral
SellBuy
Strong sellStrong buy
Strong sellSellNeutralBuyStrong buy
Moving Averages
Neutral
SellBuy
Strong sellStrong buy
Strong sellSellNeutralBuyStrong buy
Moving Averages
Neutral
SellBuy
Strong sellStrong buy
Strong sellSellNeutralBuyStrong buy
Displays a symbol's price movements over previous years to identify recurring trends.