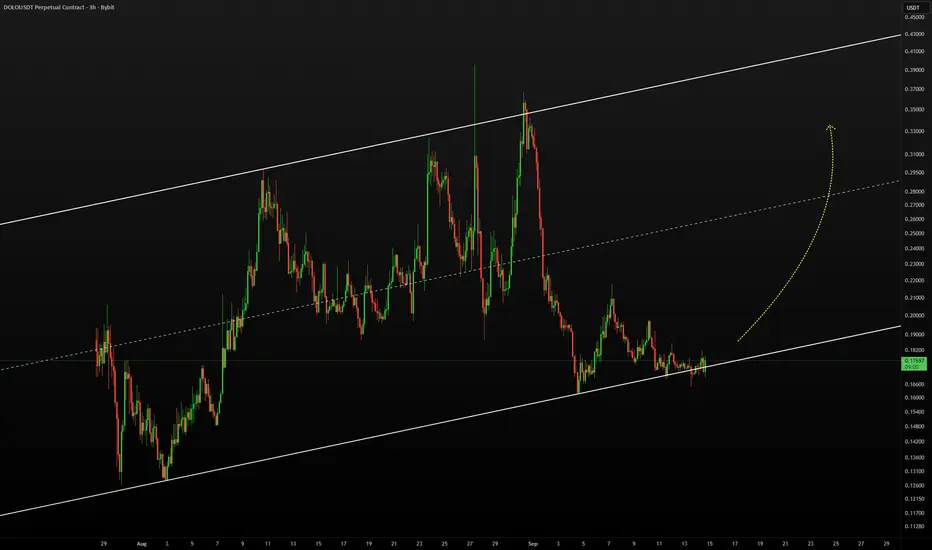
Dolomite —Low risk vs a high potential for reward (Part 2)Bitcoin's crash and marketwide lower low didn't do much to Dolomite, not even to Ether which ended with a long-term higher low. This is to show that sellers action does have a limit, and the limit is right around that part when the buyers say "no more, enough is enough!"
For DOLOUSDT, the previous
DOLO / TetherUS
No trades
Related pairs

Dolomite weekly —Downtrend, classic patterns & bullish potentialGood morning, we have a very small and simple chart here. This one is great for learning purposes. The trading opportunity is also awesome. Watch!
Thanks a lot for your support.
Dolomite produced a strong downtrend, a neat and perfectly shaped descending channel—left side of the chart. Once suppor

$DOLO:Narrative, Volume, and Structure AlignedBINANCE:DOLOUSDT ’s recent breakout isn’t hype — it’s the start of a structurally backed move driven by real liquidity and a credible narrative.
Imagine a DeFi protocol suddenly gaining mainstream legitimacy, volume exploding, and price breaking structure at the same time — while late traders are s

DOLO STRONG ON HTF🔥 Fortune AI Radar — CRYPTOCAP:DOLO
Fresh activity detected on CRYPTOCAP:DOLO today.
Data suggests increasing market interest & buyers stepping in.
Technicals currently lean bullish, with momentum trending upward.
Whales showing hints of accumulation and hype rising among traders.
This coin is

DOLOUSDT Forming Falling WedgeDOLOUSDT is forming a clear falling wedge pattern, a classic bullish reversal signal that often indicates an upcoming breakout. The price has been consolidating within a narrowing range, suggesting that selling pressure is weakening while buyers are beginning to regain control. With consistent volum

DOLO/USDT: Golden Zone Pullback Sets the Stage for the Next BullDOLO is holding a bullish structure after a strong impulsive move up. Price has pulled back into the Fibonacci golden zone (0.5–0.618), indicating a healthy retracement rather than a trend reversal.
Bias: Bullish continuation
Entry Zone: ~$0.0395 (golden zone support)
Invalidation: Clean break be

$DOLO 2D CHART UPDATE 📌This is a 2-day chart, so it shows the higher time-frame trend of CRYPTOCAP:DOLO ✅
📌The green highlighted area is a strong support zone.This zone is marked because price reacted from this area before and buyers are currently active here again 🔥
📌You can see that one previous time, price made a

DOLO/USDT (1H) - DOLO TO MOON??Price remains in a short-term bullish structure after a strong impulsive move. A minor bearish CHoCH triggered a pullback, which is now retracing into a key demand zone.
Buying Zone: $0.03965 – $0.03865
Entry: ~$0.03950
Stop Loss: $0.03850 (structure invalidation)
Targets:
TP1: $0.04150
TP2: $

Massive move is about to happen on DOLODolo is currently trading at the lower boundary of its channel, a typical buy zone where strong reversals often occur. The structure remains very bullish, and as long as the price holds this level, we could see a move toward the upper side of the channel, offering a potential +100% upside.
🔹 Stop

See all ideas
Summarizing what the indicators are suggesting.
Oscillators
Neutral
SellBuy
Strong sellStrong buy
Strong sellSellNeutralBuyStrong buy
Oscillators
Neutral
SellBuy
Strong sellStrong buy
Strong sellSellNeutralBuyStrong buy
Summary
Neutral
SellBuy
Strong sellStrong buy
Strong sellSellNeutralBuyStrong buy
Summary
Neutral
SellBuy
Strong sellStrong buy
Strong sellSellNeutralBuyStrong buy
Summary
Neutral
SellBuy
Strong sellStrong buy
Strong sellSellNeutralBuyStrong buy
Moving Averages
Neutral
SellBuy
Strong sellStrong buy
Strong sellSellNeutralBuyStrong buy
Moving Averages
Neutral
SellBuy
Strong sellStrong buy
Strong sellSellNeutralBuyStrong buy
Displays a symbol's price movements over previous years to identify recurring trends.
Frequently Asked Questions
The current price of DOLO / TetherUS (DOLO) is 0.03669 USDT — it has fallen −2.24% in the past 24 hours. Try placing this info into the context by checking out what coins are also gaining and losing at the moment and seeing DOLO price chart.
DOLO / TetherUS price has risen by 18.53% over the last week, its month performance shows a −37.01% decrease, and as for the last year, DOLO / TetherUS has decreased by −81.65%. See more dynamics on DOLO price chart.
Keep track of coins' changes with our Crypto Coins Heatmap.
Keep track of coins' changes with our Crypto Coins Heatmap.
DOLO / TetherUS (DOLO) reached its highest price on Aug 31, 2025 — it amounted to 0.37190 USDT. Find more insights on the DOLO price chart.
See the list of crypto gainers and choose what best fits your strategy.
See the list of crypto gainers and choose what best fits your strategy.
DOLO / TetherUS (DOLO) reached the lowest price of 0.02862 USDT on Feb 6, 2026. View more DOLO / TetherUS dynamics on the price chart.
See the list of crypto losers to find unexpected opportunities.
See the list of crypto losers to find unexpected opportunities.
The safest choice when buying DOLO is to go to a well-known crypto exchange. Some of the popular names are Binance, Coinbase, Kraken. But you'll have to find a reliable broker and create an account first. You can trade DOLO right from TradingView charts — just choose a broker and connect to your account.
DOLO / TetherUS (DOLO) is just as reliable as any other crypto asset — this corner of the world market is highly volatile. Today, for instance, DOLO / TetherUS is estimated as 6.26% volatile. The only thing it means is that you must prepare and examine all available information before making a decision. And if you're not sure about DOLO / TetherUS, you can find more inspiration in our curated watchlists.
You can discuss DOLO / TetherUS (DOLO) with other users in our public chats, Minds or in the comments to Ideas.