*DOT* *DOT* Who's there?Lots of energy, and double bottom if that initial live price wick is legit
NFA
GL ALL
Polkadot Holding Key Support: Why a Short-Term Bounce Is LikelyCurrent Price: 2.07 (Analysis was generated on Monday Morning)
Direction: LONG
Confidence level: 58%(This is a moderate-confidence setup. The signals are mixed, but price location near support and improving social momentum tip the balance to the upside.)
Targets
Target 1: 2.20
Target 2: 2.29
Sto
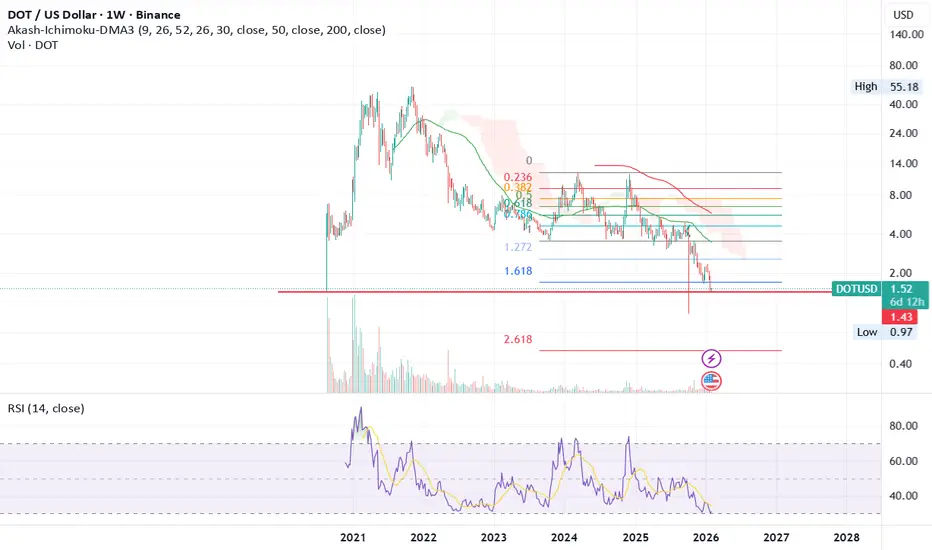
1W Polkadot (DOT): Full updates & thoughts on the chain Technical situation (chart)
On the weekly, DOT is still struggling to show sustainable strength. Price continues to sit near the low end of the range around ~2.0, failing to make meaningful higher highs or clear range expansion. This looks like more consolidation and distribution pressure rather tha
DOTUSD -> Potential Wyckoff Accumulation DOTUSD -> Potential Wyckoff Accumulation
This looks like a Model 1 Wyckoff Accumulation to me. It is evident on the monthly timeframe, but more clear on the weekly.
If this is the case, currently we would be in the wyckoff spring phase.
What do you think?

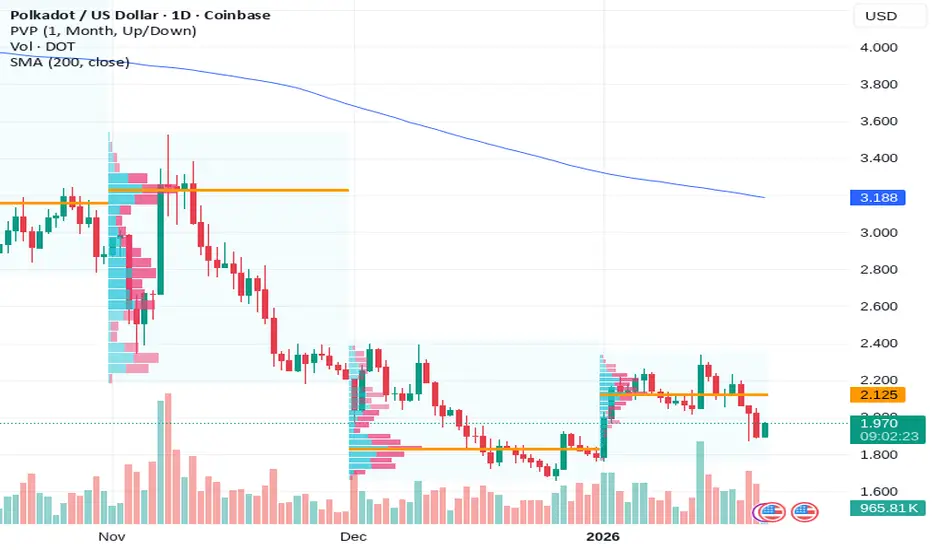
Great opportunity Polkadot resting on top of an algorithm support.
Expecting bulls to defend this level.
Opportunity given the right conditions.
NFA

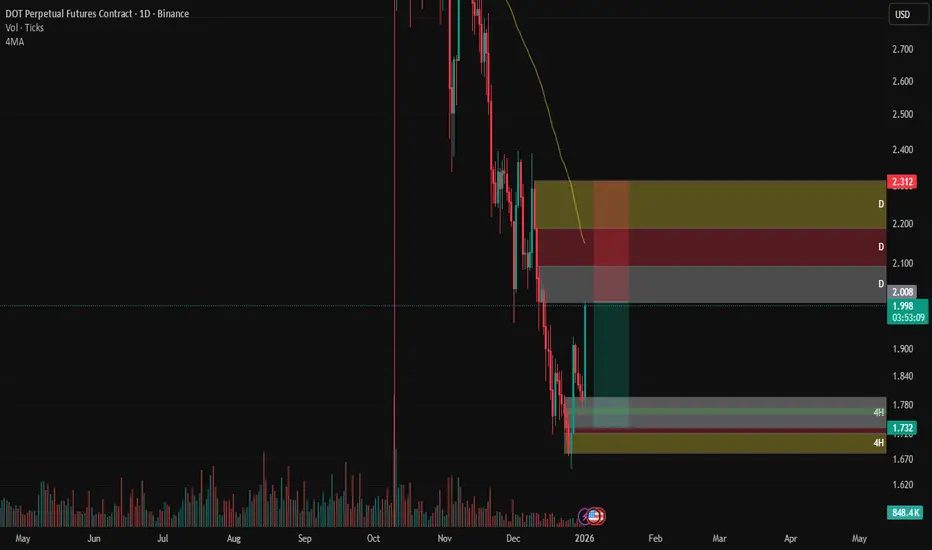


Wedge Breakout, Bull Flag, & All Time Low1D Chart Technical Analysis. An inside bar bull flag pattern in a parallel channel is forming after a breakout of descending wedge pattern highlighted in the bluish green triangle. Immediate support is at the bottom of the bull flag parallel channel. Next, and stronger support is at the white descen

WEDGE BREAKOUT, BULL FLAG, ALL TIME LOW1D Chart Technical Analysis. An inside bar bull flag pattern in a parallel channel is forming after a breakout of descending wedge pattern highlighted in the bluish green triangle. Immediate support is at the bottom of the bull flag parallel channel. Next, and more strong support is at the white des

See all ideas
Summarizing what the indicators are suggesting.
Oscillators
Neutral
SellBuy
Strong sellStrong buy
Strong sellSellNeutralBuyStrong buy
Oscillators
Neutral
SellBuy
Strong sellStrong buy
Strong sellSellNeutralBuyStrong buy
Summary
Neutral
SellBuy
Strong sellStrong buy
Strong sellSellNeutralBuyStrong buy
Summary
Neutral
SellBuy
Strong sellStrong buy
Strong sellSellNeutralBuyStrong buy
Summary
Neutral
SellBuy
Strong sellStrong buy
Strong sellSellNeutralBuyStrong buy
Moving Averages
Neutral
SellBuy
Strong sellStrong buy
Strong sellSellNeutralBuyStrong buy
Moving Averages
Neutral
SellBuy
Strong sellStrong buy
Strong sellSellNeutralBuyStrong buy
Displays a symbol's price movements over previous years to identify recurring trends.