Polkadot (DOTUSD) is currently consolidating around the criticalPolkadot (DOTUSD) is currently consolidating around the critical **$5.20** support level, which has served as a key psychological and technical baseline since February 2024. The asset faces persistent bearish pressure, trading below both the 50-day moving average (**$5.80**) and the 200-day moving average (**$6.40**). Volume has remained subdued during recent declines, indicating a lack of strong selling momentum but also absence of substantial buying interest.
The daily RSI reads **36**, hovering near oversold conditions yet without clear bullish divergence. The MACD remains below its signal line, though the histogram shows signs of convergence, suggesting weakening downward momentum. Immediate resistance is seen at **$5.80** (50-day MA), with more significant resistance at the **$6.20** Fibonacci retracement level.
Fundamentally, Polkadot continues to demonstrate robust ecosystem development with increasing parachain activity and cross-chain integrations. However, these strengths are being offset by prevailing bearish market sentiment. A breakdown below **$5.20** could trigger accelerated selling toward the next major support at **$4.80**. Conversely, a sustained move above **$5.80** with expanding volume could indicate near-term stabilization and potential retest of higher resistance zones. Traders should monitor Bitcoin's trajectory for broader market cues, given DOT's high correlation with major crypto movements.
DOTUSD.P trade ideas

Slowest altcoin gear up everLooks good here, only negating factor is the green cloud - but with NFP, who knows what will happen.
Not financial advice.

Zoom out - DOT weekly analysis Sep 3 - 9thAfter a period of very active trading, where I made profits but ultimately lost much more, I have decided to return to swing trading, as you can likely tell from the timeframe of this analysis. Accordingly, my analyses will now be structured with a broader outlook.
Polkadot is currently in an Intermediate 1–2 setup, which itself forms part of Primary Wave 3. My primary expectation is for an impulsive move toward the $5 level. However, this may prove challenging given seasonality effects, as September has historically tended to produce losses rather than gains.
From the order book perspective, we see several clusters of orders positioned above the current price, which is initially bullish. The liquidity heatmap, however, shows significant liquidity both above and below us, raising the possibility that the current move upward could merely be a liquidity grab before another downward leg.
Derivative data does not currently suggest an over-leveraged market or excessive greed or fear. Funding rates are holding steady at normal levels, and open interest is stagnant to slightly rising.
In summary, I remain long on DOT and expect an impulsive rally to follow soon.

DOTUSD H4 | Bullish bounce off major supportBased on the H4 chart analysis, we can see that the price has bounced off the buy entry, which is an overlap support that aligns with the78.6% Fibonacci projection and could rise to the take profit.
Buy entry is at 3.479, which is an overlap support that lines up with hte 78.6% Fibonacci projection.
Stop loss is at 3.189, which is a swing low support.
Take profit is at 3.837, which is a pullback resistance.
High Risk Investment Warning
Trading Forex/CFDs on margin carries a high level of risk and may not be suitable for all investors. Leverage can work against you.
Stratos Markets Limited (tradu.com ):
CFDs are complex instruments and come with a high risk of losing money rapidly due to leverage. 65% of retail investor accounts lose money when trading CFDs with this provider. You should consider whether you understand how CFDs work and whether you can afford to take the high risk of losing your money.
Stratos Europe Ltd (tradu.com ):
CFDs are complex instruments and come with a high risk of losing money rapidly due to leverage. 66% of retail investor accounts lose money when trading CFDs with this provider. You should consider whether you understand how CFDs work and whether you can afford to take the high risk of losing your money.
Stratos Global LLC (tradu.com ):
Losses can exceed deposits.
Please be advised that the information presented on TradingView is provided to Tradu (‘Company’, ‘we’) by a third-party provider (‘TFA Global Pte Ltd’). Please be reminded that you are solely responsible for the trading decisions on your account. There is a very high degree of risk involved in trading. Any information and/or content is intended entirely for research, educational and informational purposes only and does not constitute investment or consultation advice or investment strategy. The information is not tailored to the investment needs of any specific person and therefore does not involve a consideration of any of the investment objectives, financial situation or needs of any viewer that may receive it. Kindly also note that past performance is not a reliable indicator of future results. Actual results may differ materially from those anticipated in forward-looking or past performance statements. We assume no liability as to the accuracy or completeness of any of the information and/or content provided herein and the Company cannot be held responsible for any omission, mistake nor for any loss or damage including without limitation to any loss of profit which may arise from reliance on any information supplied by TFA Global Pte Ltd.
The speaker(s) is neither an employee, agent nor representative of Tradu and is therefore acting independently. The opinions given are their own, constitute general market commentary, and do not constitute the opinion or advice of Tradu or any form of personal or investment advice. Tradu neither endorses nor guarantees offerings of third-party speakers, nor is Tradu responsible for the content, veracity or opinions of third-party speakers, presenters or participants.

DOTUSD H4 | Bearish Pressure Likely to ExtendDOT/USD is rising towards the sell entry, which is a pullback resistance that aligns with the 78.6% Fibonacci retracement and could reverse from this level to our take profit.
Sell entry is at 3.899, which is a pullback resistance that lines up with the 78.6% Fibonacci retracement.
Stop loss is at 4.154, which is a swing high resistance that aligns with the 127.2% Fibonacci extension.
Take profit is at 3.587, a pullback support.
High Risk Investment Warning
Trading Forex/CFDs on margin carries a high level of risk and may not be suitable for all investors. Leverage can work against you.
Stratos Markets Limited (tradu.com ):
CFDs are complex instruments and come with a high risk of losing money rapidly due to leverage. 65% of retail investor accounts lose money when trading CFDs with this provider. You should consider whether you understand how CFDs work and whether you can afford to take the high risk of losing your money.
Stratos Europe Ltd (tradu.com ):
CFDs are complex instruments and come with a high risk of losing money rapidly due to leverage. 66% of retail investor accounts lose money when trading CFDs with this provider. You should consider whether you understand how CFDs work and whether you can afford to take the high risk of losing your money.
Stratos Global LLC (tradu.com ):
Losses can exceed deposits.
Please be advised that the information presented on TradingView is provided to Tradu (‘Company’, ‘we’) by a third-party provider (‘TFA Global Pte Ltd’). Please be reminded that you are solely responsible for the trading decisions on your account. There is a very high degree of risk involved in trading. Any information and/or content is intended entirely for research, educational and informational purposes only and does not constitute investment or consultation advice or investment strategy. The information is not tailored to the investment needs of any specific person and therefore does not involve a consideration of any of the investment objectives, financial situation or needs of any viewer that may receive it. Kindly also note that past performance is not a reliable indicator of future results. Actual results may differ materially from those anticipated in forward-looking or past performance statements. We assume no liability as to the accuracy or completeness of any of the information and/or content provided herein and the Company cannot be held responsible for any omission, mistake nor for any loss or damage including without limitation to any loss of profit which may arise from reliance on any information supplied by TFA Global Pte Ltd.
The speaker(s) is neither an employee, agent nor representative of Tradu and is therefore acting independently. The opinions given are their own, constitute general market commentary, and do not constitute the opinion or advice of Tradu or any form of personal or investment advice. Tradu neither endorses nor guarantees offerings of third-party speakers, nor is Tradu responsible for the content, veracity or opinions of third-party speakers, presenters or participants.

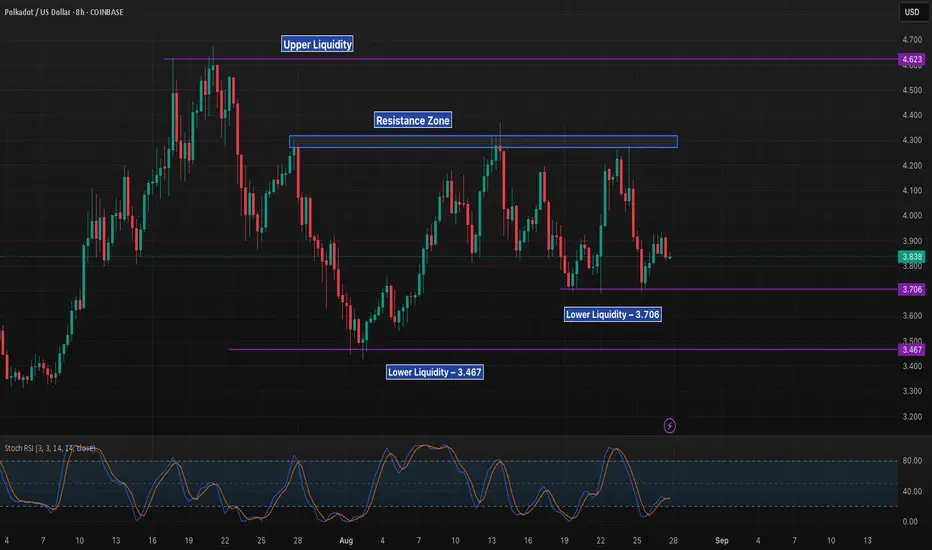
DOT 8H – Range Between Liquidity Levels, Breakout or Breakdown?Polkadot is trading in a defined range, capped by resistance at $4.20–$4.30 and supported between $3.70 and $3.46. These liquidity levels have repeatedly shaped recent price action.
Bullish path: A breakout above resistance could target the $4.62 liquidity level.
Bearish path: Losing $3.70 risks a sweep of $3.46 liquidity and possible continuation lower.
Stoch RSI is rising from oversold territory, but confirmation will require strength above resistance. Until then, DOT remains trapped in consolidation between these key zones.
Critical - DOT weekly update Aug 27 - 2ndPolkadot has developed a structure that rests on very shaky ground and could flip from bullish to bearish at any time. The main concern lies with the Minor Wave 2, which retraced exactly 100%. According to Elliott Wave rules, a Wave 2 may not retrace beyond the starting point of Wave 1, making this a near-perfect but fragile setup. Nevertheless, given the ongoing correlation with other altcoins, I have kept this scenario as my primary count.
From an Elliott Wave perspective, DOT is now positioned at the start of Minor Wave 3, which also aligns with Intermediate Wave 3 and Primary Wave 3. Altogether, this creates a technically solid setup for swing long positioning—provided that the structure holds.
The order book shows some clustering around the high of Minor Wave 1, but no significant concentrations beyond that. Similarly, the liquidation heatmap remains sparse, with only minor liquidity pockets at the high of Wave 1.
Derivative data confirms this lack of conviction, as funding rates are neither strongly positive nor negative. This reflects a market in uncertainty—neither euphoric nor fearful. Broader macro correlations may also be a factor, especially with Nvidia’s (NVDA) earnings announcement tomorrow. Tech and crypto often move in tandem, meaning the results could play an important role in shaping DOT’s next move.
For now, I will wait to see how events unfold, particularly as I am already positioned in Cardano. Positive earnings could act as a catalyst for a potential Wave 3 breakout, while negative results could instead trigger a deeper correction.

DOTUSD H4 | Bullish bounce offBased on the H4 chart analysis, we could see the price fall to the buy entry, which acts as an overlap support that aligns with the 78.6% Fibonacci projection and could bounce from this level to the take profit.
Buy entry is at 3.479, which is an overlap support that lines up with the 78.6% Fibonacci projection.
Stop loss is at 3.183, which is a swing low support that lines up with the 127.2% Fibonacci extension.
Take profit is at 3.825, which is a pullback resistance.
High Risk Investment Warning
Trading Forex/CFDs on margin carries a high level of risk and may not be suitable for all investors. Leverage can work against you.
Stratos Markets Limited (tradu.com ):
CFDs are complex instruments and come with a high risk of losing money rapidly due to leverage. 65% of retail investor accounts lose money when trading CFDs with this provider. You should consider whether you understand how CFDs work and whether you can afford to take the high risk of losing your money.
Stratos Europe Ltd (tradu.com ):
CFDs are complex instruments and come with a high risk of losing money rapidly due to leverage. 66% of retail investor accounts lose money when trading CFDs with this provider. You should consider whether you understand how CFDs work and whether you can afford to take the high risk of losing your money.
Stratos Global LLC (tradu.com ):
Losses can exceed deposits.
Please be advised that the information presented on TradingView is provided to Tradu (‘Company’, ‘we’) by a third-party provider (‘TFA Global Pte Ltd’). Please be reminded that you are solely responsible for the trading decisions on your account. There is a very high degree of risk involved in trading. Any information and/or content is intended entirely for research, educational and informational purposes only and does not constitute investment or consultation advice or investment strategy. The information is not tailored to the investment needs of any specific person and therefore does not involve a consideration of any of the investment objectives, financial situation or needs of any viewer that may receive it. Kindly also note that past performance is not a reliable indicator of future results. Actual results may differ materially from those anticipated in forward-looking or past performance statements. We assume no liability as to the accuracy or completeness of any of the information and/or content provided herein and the Company cannot be held responsible for any omission, mistake nor for any loss or damage including without limitation to any loss of profit which may arise from reliance on any information supplied by TFA Global Pte Ltd.
The speaker(s) is neither an employee, agent nor representative of Tradu and is therefore acting independently. The opinions given are their own, constitute general market commentary, and do not constitute the opinion or advice of Tradu or any form of personal or investment advice. Tradu neither endorses nor guarantees offerings of third-party speakers, nor is Tradu responsible for the content, veracity or opinions of third-party speakers, presenters or participants.

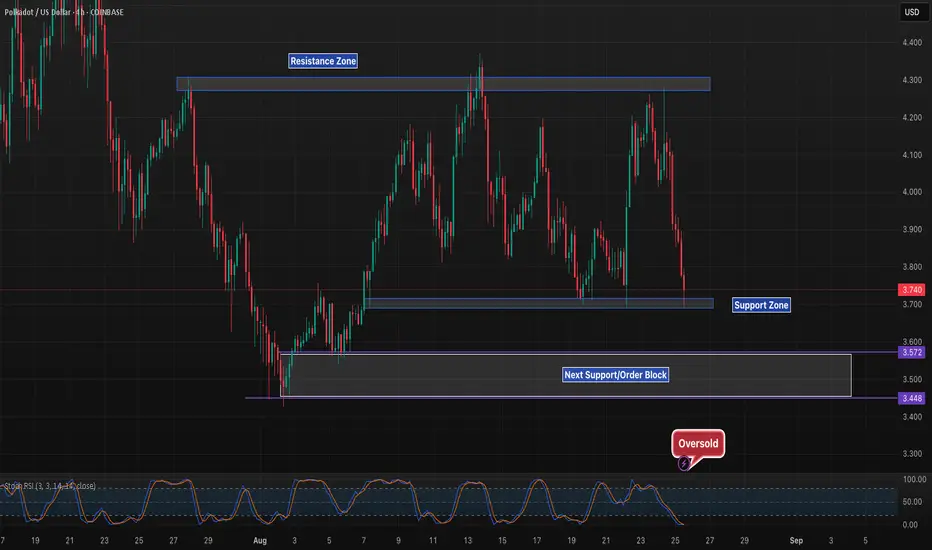
DOT 4H – Sitting on Support, Can Bulls Defend $3.70?Polkadot is retesting the $3.70 support zone after a strong selloff from the $4.25–4.30 resistance. This range has acted as a key pivot level in recent weeks, and today’s reaction will determine whether DOT holds structure or breaks lower.
If $3.70 fails, downside targets are marked at $3.57 and $3.45, which represent deeper support and potential liquidity grabs. On the other hand, if buyers defend this area, DOT may rebound back toward the upper range resistance near $4.25.
The Stoch RSI is oversold, which gives room for a bounce, but momentum remains weak. Traders should watch the close around $3.70 closely — it could dictate the next multi-day move.
Polkadot Holds Key Support - Analysts See Toward $23 Long-TermThe price has reacted positively to a key weekly support zone, which has prevented further downside movement. As seen on the chart, the latest pivot low is higher than the previous pivot low, and the resistance that had created the lowest low was unsuccessfully broken once.
taken together, these signals suggest the beginning of a bullish trend that could provide solid returns for investors.
Price targets:
> $5.40
> $6-7
> $9
> $11
if the $10-11 resistance zone will get broken, the price has the potential to reach $23 an ultimately $49 -- although these two targets are currently considered long-term and less attainable in the near future.
This analysis reflects personal opinion and is not financial advise.

DOT is bullish now and many Traders don't see it !!The price is trapped inside a triangle, and it is currently at the triangle's bottom. If we look at previous lows, the price has typically seen strong growth after hitting the bottom. If the price follows previous trends, we should now expect a price increase.
DOTUSD H4 | Bullish bounce off major supportBased on the H4 chart analysis, we could se the price fall to the buy entry which is an overlap supprt and could bounce from this level to the upside.
Buy entry is at 3.479, which is an overlap support that is slightly below the 127.2% Fibonacci extension.
Stop loss is at 3.178, which is a swing low support.
Take profit is at 3.825, which is a pullback resistance.
High Risk Investment Warning
Trading Forex/CFDs on margin carries a high level of risk and may not be suitable for all investors. Leverage can work against you.
Stratos Markets Limited (tradu.com ):
CFDs are complex instruments and come with a high risk of losing money rapidly due to leverage. 65% of retail investor accounts lose money when trading CFDs with this provider. You should consider whether you understand how CFDs work and whether you can afford to take the high risk of losing your money.
Stratos Europe Ltd (tradu.com ):
CFDs are complex instruments and come with a high risk of losing money rapidly due to leverage. 66% of retail investor accounts lose money when trading CFDs with this provider. You should consider whether you understand how CFDs work and whether you can afford to take the high risk of losing your money.
Stratos Global LLC (tradu.com ):
Losses can exceed deposits.
Please be advised that the information presented on TradingView is provided to Tradu (‘Company’, ‘we’) by a third-party provider (‘TFA Global Pte Ltd’). Please be reminded that you are solely responsible for the trading decisions on your account. There is a very high degree of risk involved in trading. Any information and/or content is intended entirely for research, educational and informational purposes only and does not constitute investment or consultation advice or investment strategy. The information is not tailored to the investment needs of any specific person and therefore does not involve a consideration of any of the investment objectives, financial situation or needs of any viewer that may receive it. Kindly also note that past performance is not a reliable indicator of future results. Actual results may differ materially from those anticipated in forward-looking or past performance statements. We assume no liability as to the accuracy or completeness of any of the information and/or content provided herein and the Company cannot be held responsible for any omission, mistake nor for any loss or damage including without limitation to any loss of profit which may arise from reliance on any information supplied by TFA Global Pte Ltd.
The speaker(s) is neither an employee, agent nor representative of Tradu and is therefore acting independently. The opinions given are their own, constitute general market commentary, and do not constitute the opinion or advice of Tradu or any form of personal or investment advice. Tradu neither endorses nor guarantees offerings of third-party speakers, nor is Tradu responsible for the content, veracity or opinions of third-party speakers, presenters or participants.

Buying PolkadotTrading the breakout of the downtrend. Daily shows uptrend. Looking for buys. Found it from observing the break of the down trend line.

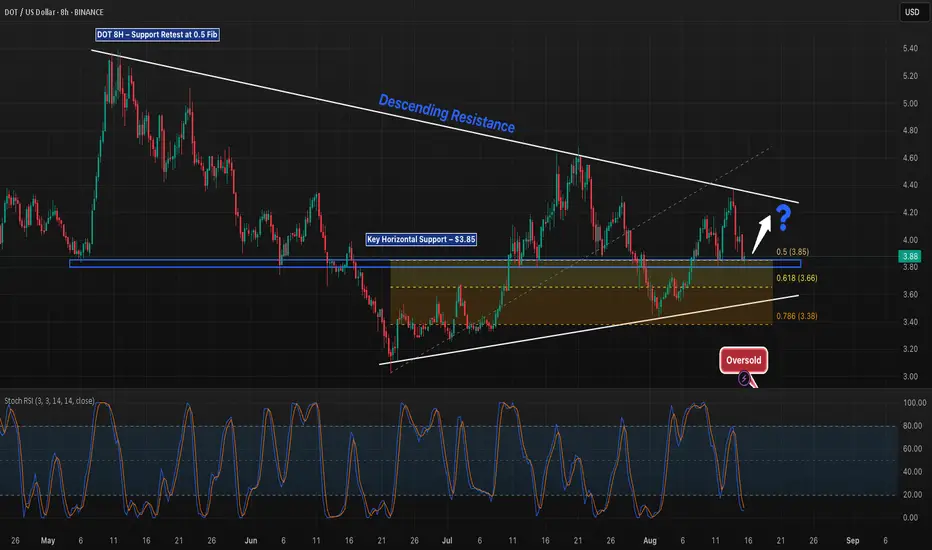
DOT 8H – Support Retest at 0.5 Fib, Will It Hold or Break?DOT is once again testing the $3.85 horizontal support, aligning with the 0.5 Fibonacci retracement from the recent swing low to high. A breakdown here opens the door to the $3.66 0.618 Fib and the $3.38 0.786 Fib, both of which align with the ascending trendline. On the upside, price faces descending resistance near $4.40, which has capped rallies since April. The Stoch RSI is oversold, suggesting possible short-term relief, but confirmation is needed to avoid a deeper retracement. Monitoring volume and reaction at $3.85 will be key for the next move.
DOTUSD H4 | Bearish drop off 50% Fibonacci resistanceDOT/USD is rising towards the sell entry which is a pullback resistance that lines up with the 50% Fibonacci retracement and could reverse to the take profit.
Sell entry is at 3.982, which is a pullback resistance that lines up with the 50% Fibonacci retracement.
Stop loss is at 4.165, which is an overlap resistance.
Take profit is at 3.600, which is a pullback support that is slightly above the 78.6% Fibonacci retracement.
High Risk Investment Warning
Trading Forex/CFDs on margin carries a high level of risk and may not be suitable for all investors. Leverage can work against you.
Stratos Markets Limited (tradu.com ):
CFDs are complex instruments and come with a high risk of losing money rapidly due to leverage. 65% of retail investor accounts lose money when trading CFDs with this provider. You should consider whether you understand how CFDs work and whether you can afford to take the high risk of losing your money.
Stratos Europe Ltd (tradu.com ):
CFDs are complex instruments and come with a high risk of losing money rapidly due to leverage. 66% of retail investor accounts lose money when trading CFDs with this provider. You should consider whether you understand how CFDs work and whether you can afford to take the high risk of losing your money.
Stratos Global LLC (tradu.com ):
Losses can exceed deposits.
Please be advised that the information presented on TradingView is provided to Tradu (‘Company’, ‘we’) by a third-party provider (‘TFA Global Pte Ltd’). Please be reminded that you are solely responsible for the trading decisions on your account. There is a very high degree of risk involved in trading. Any information and/or content is intended entirely for research, educational and informational purposes only and does not constitute investment or consultation advice or investment strategy. The information is not tailored to the investment needs of any specific person and therefore does not involve a consideration of any of the investment objectives, financial situation or needs of any viewer that may receive it. Kindly also note that past performance is not a reliable indicator of future results. Actual results may differ materially from those anticipated in forward-looking or past performance statements. We assume no liability as to the accuracy or completeness of any of the information and/or content provided herein and the Company cannot be held responsible for any omission, mistake nor for any loss or damage including without limitation to any loss of profit which may arise from reliance on any information supplied by TFA Global Pte Ltd.
The speaker(s) is neither an employee, agent nor representative of Tradu and is therefore acting independently. The opinions given are their own, constitute general market commentary, and do not constitute the opinion or advice of Tradu or any form of personal or investment advice. Tradu neither endorses nor guarantees offerings of third-party speakers, nor is Tradu responsible for the content, veracity or opinions of third-party speakers, presenters or participants.

DOT 1D – Testing Downtrend ResistancePolkadot’s daily chart shows price testing the long-term downtrend resistance near $4.00 after a sharp -6.73% pullback. The $3.50–$3.70 zone remains key support, while Stoch RSI is overbought, suggesting possible short-term weakness. A breakout above the trendline could open a move toward $5.00, while rejection risks another drop back into the support zone.

Up to $5 - DOT weekly update August 13 - 19thWe are currently in Minor Wave 5 and Intermediate Wave 1, with the broader Primary Cycle forming a Wave 3. Once Intermediate Wave 1 is complete, I anticipate a larger corrective move toward the 0.618 Fibonacci retracement level, or potentially deeper.
The liquidation heatmap reveals limited liquidity slightly above the current price, but a substantial concentration below it—liquidity that is likely to be targeted during the formation of Wave 2. The order book further indicates some resting orders at the 1.0 Fibonacci extension level and a significantly larger cluster at the 1.618 extension level.
Funding rates remain moderately positive, and open interest is steadily increasing, suggesting a stable upward trend. This also implies that market sentiment has not yet reached excessive euphoria and that risk appetite remains relatively contained.
In summary, the confluence of liquidity positioning, derivatives data, and Elliott Wave structure leads me to favor a primary scenario in which prices reach the 1.618 extension level of Minor Wave 5, encountering both the psychological $5.00 mark and a prominent sell wall. This confluence is expected to trigger the onset of Wave 2.

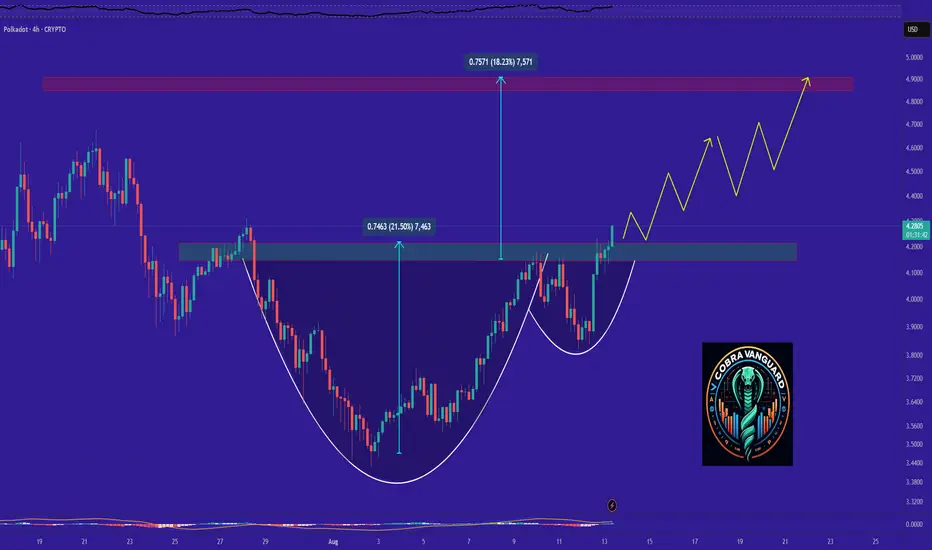
DOT is bullish now and many Traders don't see it !As I said,the cup and handle pattern has completed and broken out, which could quickly drive the price above $4.5.
DOTUSD H4| Bearish reversal off Fib confluenceDOT/USD is rising towards the sell entry which is an overlap resistance and could reverse to the downside.
Sell entry is at 4.161, which is an overlap resistance that aligns with the 127.2% Fib extension, 78.6% Fib projection and slightly above the 61.8% Fibonacci retracement.
Stop loss is at 4.530, which is a swing high resistance.
Take profit is at 3.744, which is an overlap support.
High Risk Investment Warning
Trading Forex/CFDs on margin carries a high level of risk and may not be suitable for all investors. Leverage can work against you.
Stratos Markets Limited (tradu.com ):
CFDs are complex instruments and come with a high risk of losing money rapidly due to leverage. 65% of retail investor accounts lose money when trading CFDs with this provider. You should consider whether you understand how CFDs work and whether you can afford to take the high risk of losing your money.
Stratos Europe Ltd (tradu.com ):
CFDs are complex instruments and come with a high risk of losing money rapidly due to leverage. 66% of retail investor accounts lose money when trading CFDs with this provider. You should consider whether you understand how CFDs work and whether you can afford to take the high risk of losing your money.
Stratos Global LLC (tradu.com ):
Losses can exceed deposits.
Please be advised that the information presented on TradingView is provided to Tradu (‘Company’, ‘we’) by a third-party provider (‘TFA Global Pte Ltd’). Please be reminded that you are solely responsible for the trading decisions on your account. There is a very high degree of risk involved in trading. Any information and/or content is intended entirely for research, educational and informational purposes only and does not constitute investment or consultation advice or investment strategy. The information is not tailored to the investment needs of any specific person and therefore does not involve a consideration of any of the investment objectives, financial situation or needs of any viewer that may receive it. Kindly also note that past performance is not a reliable indicator of future results. Actual results may differ materially from those anticipated in forward-looking or past performance statements. We assume no liability as to the accuracy or completeness of any of the information and/or content provided herein and the Company cannot be held responsible for any omission, mistake nor for any loss or damage including without limitation to any loss of profit which may arise from reliance on any information supplied by TFA Global Pte Ltd.
The speaker(s) is neither an employee, agent nor representative of Tradu and is therefore acting independently. The opinions given are their own, constitute general market commentary, and do not constitute the opinion or advice of Tradu or any form of personal or investment advice. Tradu neither endorses nor guarantees offerings of third-party speakers, nor is Tradu responsible for the content, veracity or opinions of third-party speakers, presenters or participants.

Bitcoin and Broad Market Breakout (BTC, ETH, SOL, PENDLE)In this video we take a look at why the market rallied Thursday.
- 93% of FOMC September Rate cut and 3 possible cuts in 2025
- UK just dropped rates to 4%
- President Trump approved letting 401k's invest in crypto
- Trump removed resitrictions by banks to 'de-bank' crypto investors
The charts looks very bullish here and I revisit the potential path to $150 BTC this year.
Also ETH, Solana charts and 'The Rocket'
As well as the 25% move on Pendle which I had recommended as a 'Buy' the day before.
Let me know what you think...
The BULL is Back.

DOTUSD | H4 Bullish reversalDOT/USD has bounced off the buy entry which is a pullback support and could potentially rise to the take profit.
Buy entry is at 3.482, which is a pullback support that aligns with the 78.6% Fibonacci retracement.
Stop loss is at 3.187, which is a swing low support.
Take profit is at 3.801, which is a pullback resistance that aligns with the 50% Fibonacci retracement.
High Risk Investment Warning
Trading Forex/CFDs on margin carries a high level of risk and may not be suitable for all investors. Leverage can work against you.
Stratos Markets Limited (tradu.com ):
CFDs are complex instruments and come with a high risk of losing money rapidly due to leverage. 65% of retail investor accounts lose money when trading CFDs with this provider. You should consider whether you understand how CFDs work and whether you can afford to take the high risk of losing your money.
Stratos Europe Ltd (tradu.com ):
CFDs are complex instruments and come with a high risk of losing money rapidly due to leverage. 66% of retail investor accounts lose money when trading CFDs with this provider. You should consider whether you understand how CFDs work and whether you can afford to take the high risk of losing your money.
Stratos Global LLC (tradu.com ):
Losses can exceed deposits.
Please be advised that the information presented on TradingView is provided to Tradu (‘Company’, ‘we’) by a third-party provider (‘TFA Global Pte Ltd’). Please be reminded that you are solely responsible for the trading decisions on your account. There is a very high degree of risk involved in trading. Any information and/or content is intended entirely for research, educational and informational purposes only and does not constitute investment or consultation advice or investment strategy. The information is not tailored to the investment needs of any specific person and therefore does not involve a consideration of any of the investment objectives, financial situation or needs of any viewer that may receive it. Kindly also note that past performance is not a reliable indicator of future results. Actual results may differ materially from those anticipated in forward-looking or past performance statements. We assume no liability as to the accuracy or completeness of any of the information and/or content provided herein and the Company cannot be held responsible for any omission, mistake nor for any loss or damage including without limitation to any loss of profit which may arise from reliance on any information supplied by TFA Global Pte Ltd.
The speaker(s) is neither an employee, agent nor representative of Tradu and is therefore acting independently. The opinions given are their own, constitute general market commentary, and do not constitute the opinion or advice of Tradu or any form of personal or investment advice. Tradu neither endorses nor guarantees offerings of third-party speakers, nor is Tradu responsible for the content, veracity or opinions of third-party speakers, presenters or participants.

This time, we'll get there - DOT weekly update August 6-12thPolkadot is currently in the early stages of a major impulsive advance, supported by a strong multi-timeframe Elliott Wave structure. According to the primary count, the asset has just completed a corrective Wave and is now entering a new bullish cycle that could unfold across several degrees of trend. Specifically, we appear to be at the beginning of Cycle Wave 1, Primary Wave 3, Intermediate Wave 1, and Minor Wave 3 — a highly bullish alignment suggesting both immediate and longer-term upside potential.
There is an alternative scenario with lower probability that assumes the recent advance is still part of a larger corrective structure, implying that the correction could extend further to make a new low. This would correspond to an ongoing Wave (5) or , targeting a drop below the $3.02 level. However, given the clean impulsive structure of the recent move and the rejection from key support zones, this bearish alternative currently lacks strong evidence and remains unlikely unless the local low is breached.
Sentiment and derivatives data support the bullish thesis. Funding rates are positive, indicating that traders are willing to pay to hold long positions, and open interest is rising, showing increased conviction and participation. One area of caution, however, comes from the liquidity heatmap, which highlights significant liquidity sitting below the current price. This suggests that a short-term liquidity sweep cannot be ruled out, even within a bullish context.
That said, structurally and probabilistically, the primary scenario remains intact and dominant. The recent corrective structure has found strong support, and the initial breakout signals the early phase of a Wave 3 advance. Given the high reward-to-risk ratio at current levels, this zone represents an optimal entry opportunity for traders aligning with the macro bullish thesis.

DOTUSD H4 | Bullish reversalThe price has bounced off the buy entry, which is a pullback support, and could potentially rise from this level to the upside.
Buy entry is at 3.482, which is a pullback support that aligns with the 78.6% Fibonacci retracement.
Stop loss is at 3.18, which is a swing low support.
Take profit is at 3.80, which is a pullback resistance that aligns with the 50% Fibonacci retracement.
High Risk Investment Warning
Trading Forex/CFDs on margin carries a high level of risk and may not be suitable for all investors. Leverage can work against you.
Stratos Markets Limited (tradu.com ):
CFDs are complex instruments and come with a high risk of losing money rapidly due to leverage. 65% of retail investor accounts lose money when trading CFDs with this provider. You should consider whether you understand how CFDs work and whether you can afford to take the high risk of losing your money.
Stratos Europe Ltd (tradu.com ):
CFDs are complex instruments and come with a high risk of losing money rapidly due to leverage. 66% of retail investor accounts lose money when trading CFDs with this provider. You should consider whether you understand how CFDs work and whether you can afford to take the high risk of losing your money.
Stratos Global LLC (tradu.com ):
Losses can exceed deposits.
Please be advised that the information presented on TradingView is provided to Tradu (‘Company’, ‘we’) by a third-party provider (‘TFA Global Pte Ltd’). Please be reminded that you are solely responsible for the trading decisions on your account. There is a very high degree of risk involved in trading. Any information and/or content is intended entirely for research, educational and informational purposes only and does not constitute investment or consultation advice or investment strategy. The information is not tailored to the investment needs of any specific person and therefore does not involve a consideration of any of the investment objectives, financial situation or needs of any viewer that may receive it. Kindly also note that past performance is not a reliable indicator of future results. Actual results may differ materially from those anticipated in forward-looking or past performance statements. We assume no liability as to the accuracy or completeness of any of the information and/or content provided herein and the Company cannot be held responsible for any omission, mistake nor for any loss or damage including without limitation to any loss of profit which may arise from reliance on any information supplied by TFA Global Pte Ltd.
The speaker(s) is neither an employee, agent nor representative of Tradu and is therefore acting independently. The opinions given are their own, constitute general market commentary, and do not constitute the opinion or advice of Tradu or any form of personal or investment advice. Tradu neither endorses nor guarantees offerings of third-party speakers, nor is Tradu responsible for the content, veracity or opinions of third-party speakers, presenters or participants.
