I know you dont like me but..but... the whole universe is a huge fractal. Repetition inside a repetition repeated over time. Trading and investing is not far away from philosophy.
Look ar my BTC fractal prediction. its simple on point week by week.
Not an investment advice. Go to meditate.
Elon rules.
TL01 trade ideas

Tesla - Here we goooooo!🚗Tesla ( NASDAQ:TSLA ) is finally breaking out:
🔎Analysis summary:
Finally, after a consolidation of four years, Tesla is attempting another all time high breakout. With the bullish triangle coming to an end, bulls are dominating this stock. It just comes down to the next couple of months but a triangle breakout remains far more likely.
📝Levels to watch:
$400
SwingTraderPhil
SwingTrading.Simplified. | Investing.Simplified. | #LONGTERMVISION

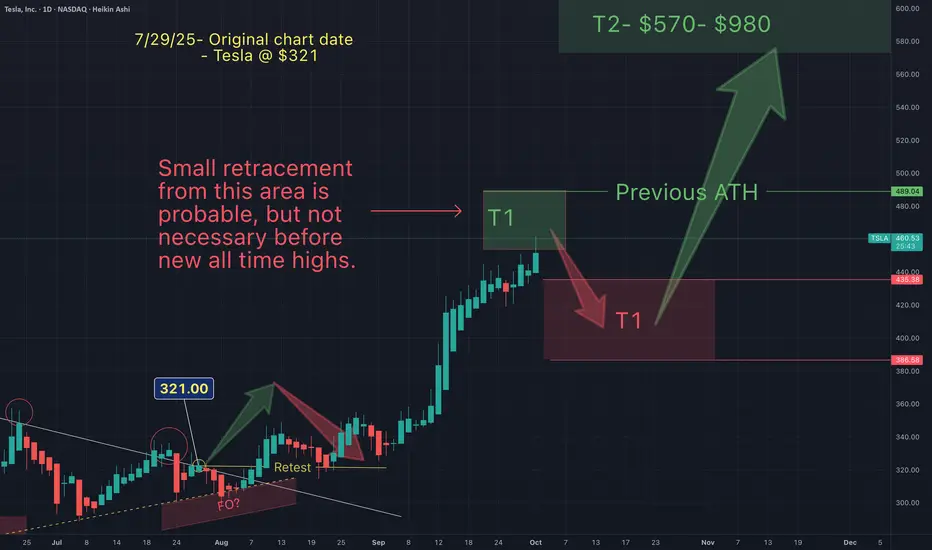
Telsa - NEW ALL TIME HIGHS INCOMING (price action simplified)Here's a simplified version of my short term targets. On July 29th Tesla was around $321 and I suggested that after a long downtrend, Tesla would breakout, retest and continue up ("without any major retraces)", to between $400-$600.
Tesla has now hit my T2 (currently $460) and I am anticipating a small retracement, before new all time highs in the near term.
Congrats to all of you who have made gains from my charts.
May the trends (continue) to be with you.
TESLA Set To Fall! SELL!
My dear friends,
TESLA looks like it will make a good move, and here are the details:
The market is trading on 440.30 pivot level.
Bias - Bearish
Technical Indicators: Supper Trend generates a clear short signal while Pivot Point HL is currently determining the overall Bearish trend of the market.
Goal - 432.72
Recommended Stop Loss - 444.15
About Used Indicators:
Pivot points are a great way to identify areas of support and resistance, but they work best when combined with other kinds of technical analysis
Disclosure: I am part of Trade Nation's Influencer program and receive a monthly fee for using their TradingView charts in my analysis.
———————————
WISH YOU ALL LUCK

$TSLA broke down today on the 15-minute chart.NASDAQ:TSLA broke down today on the 15-minute chart.
Not with fireworks, but with precision — the type of move that punishes late longs and rewards those who prepared.
The truth? It’s never about guessing the direction.
It’s about setting the framework before the bell: pre-market levels mapped, risk defined, noise filtered.
When the signal confirms, you don’t hesitate. You execute.
Most of the time, the market whispers.
Sometimes, it shouts.
Your edge is built in the quiet hours, so when the move comes, you’re already positioned.
Cut losers fast.
Let winners breathe.
Keep showing up until probability pays you.
Long trade Trade Journal Entry
Pair/Asset: TSLA (Tesla Inc.)
Trade Type: Buyside trade
Date: Friday, 26th Sept 2025
Session: London to New York Session AM (11:00 AM)
Trade Details
Entry: 427.51
Profit Level (TP): 465.20 (+8.82%)
Stop Level (SL): 425.82 (-0.40%)
Risk–Reward (RR): 22.3
Technical Narrative
Pre-Trade Context:
The price consolidated above a demand zone at 423–427, which coincided with the origin of a prior order block. Inducement & BOS (Break of Structure) confirmed bullish intent.
Several fair value gaps (FVGs) were present on the climb, supporting bullish continuation.
Entry Justification:
*Entry at 427.51 aligns with the mitigation of the demand zone and FVG fill.
*The structure flipped bullish after the sweep of local lows, setting the stage for an upside liquidity grab.
Target Rationale:
*TP aimed at 465.20, aligning with the previous swing high and liquidity above.
*Clean imbalances left on the rally offer magnets for price.
Risk Management:
Tight SL at 425.82, just below the demand origin to invalidate trade if broken.
Observations & Notes
The accumulation structure within demand was well-formed before the breakout.
Entry captured an early move with FVG alignment + inducement sweep.
Monitor for potential rejection near 448.96 (intermediate resistance) before TP.

Gold extensions10 1 2005 I am really happy with this video because it did so many things that could have been helpful to your trade looking at the market the way we've been looking at it for a long time. The tools that I look at work. The only thing that concerns me is that I told you how you could have made money on gold by shorting it and then when it came back to support you could have made money on gold in both directions and each Direction was nearly 3000,,, so in 2 4-hour periods of time you could have made over $6000..... But I would guess that at the beginning Trader is going to get in trouble with this without some more screen time and observation if your trades at the end of the day when you start doing an analysis from early that day. Actually on today you could have been long then short then long and it looks obvious it is very stressful trading that way. So look at it, get a feel and whenever you do don't over trade it's very important to avoid drawdowns because if you are starting and you try to train hot markets that are going to trade in both directions and you blow it and you get an 8000 drawdown... You will never appreciate the attributes of the market because it's very difficult to get back and trade when you're not prepared for the volatility. And it's very hard psychologically to go long and then go short and vice versa... But the patterns the market. And all the reversals would have minimal drawdowns and none of them would have been touched in this particular Market earlier today.

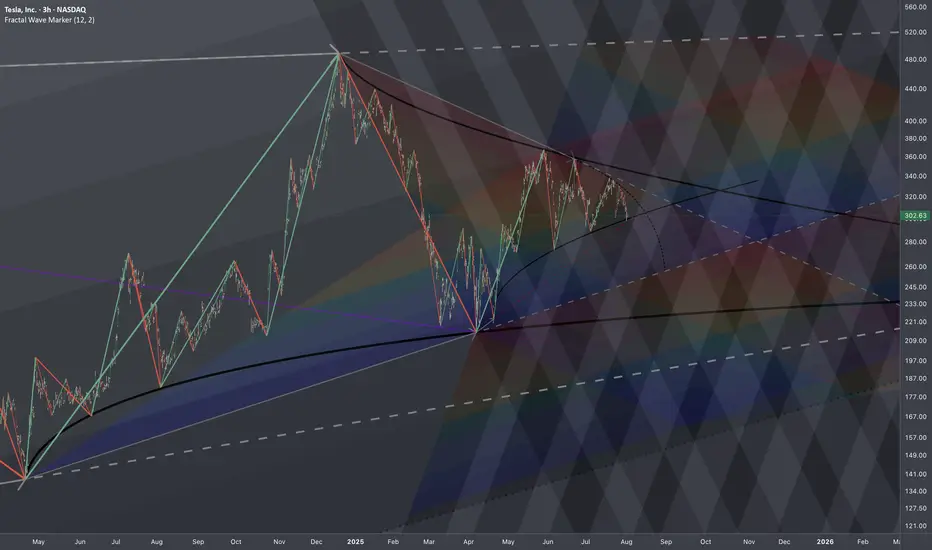
$TSLA: Branching Effect🏛️ Research Notes
Reaching branching effect through cross-cycle interconnection. Alongside I'll test some elements mentioned below.
Local Progressions
Rhyme and levels derived from apparent cycle compression.
Added channels with darkening gradient that cover bullrun from mid 2019, driven by angle of tops.
In the local scope, as price deepens into denser zone the probability of disproportional reaction gets higher. t would probably complete its intermediate and even longer-term cycles before escaping the boundary.
TeslaIf you recall, last week I mentioned that I think Tesla gives us another high before it is all said and done. That would complete what I am calling an ED to finally finish off intermediate wave (B). Currently, price is trading @ $434.32 in the overnights according to Robinhood. This creates the new high I was looking for, and if correct, would conclude this move higher. Also, if this is an ED, then once it finally completes, it will move swiftly towards the $400-$405 area as that is where it started. That move lower would be considered the start of wave (C) and would either be wave a, or the start of wave 1.
In short, I believe the high we got in the overnights should be the last leg of this move higher. Rather it finishes tomorrow or sometime in the upcoming week, I do believe this move higher is finally coming to an end. If this is correct, it would be a good area to short the stock...with stops of course.
The ALT that I am watching for is that this high we're getting now in the overnights is just the last leg of micro-wave 3 with 4 & 5 yet to come. The strength in which it moves lower after completion will answer that question for us. A swift move to the above-mentioned price level = completion. A choppy lackadaisical move lower would likely mean the turquoise count is coming to fruition.

TSLA – Watching for Wave 3 Extension Toward 455–460 Zone Tesla (TSLA) is completing a contracting triangle (ABCDE) as wave (iv), setting up for a potential wave (v) of 3. With delivery numbers scheduled for Thursday, momentum could build into the report, creating a rally toward the 455–460 zone, which also aligns with channel resistance and the 1.618 extension. This would complete a ABCD harmonic pattern.

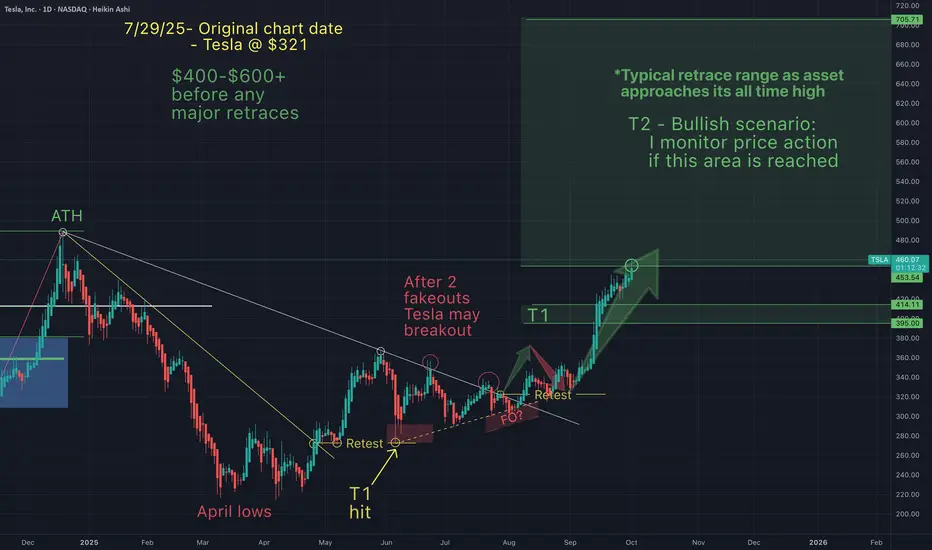
Tesla - NEW ALL TIME HIGH INCOMING (small pullback first?)On July 29th Tesla was around $320 and I suggested that after a long downtrend, Tesla would breakout, retest and continue up ("without any major retraces)", to between $400-$600.
Tesla has now hit my T2 (currently $460) and I am anticipating a small retest before new all time highs in the near term.
Congrats to all of you who have made gains from my charts.
May the trends (continue) to be with you.
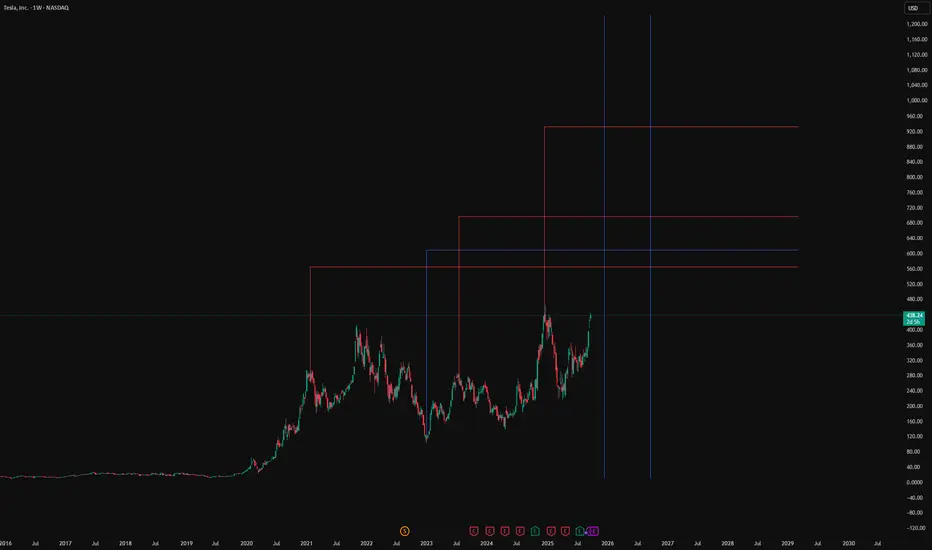
LevelsHere are some future levels of significance for Tesla in its uptrend - there should be significant reactions at these levels.
Introduction to Bond Investing and Its Typesation
Bonds often move inversely to equities. When stock markets are volatile, bonds can provide stability, reducing overall portfolio risk.
2.4 Tax Benefits
Certain bonds, such as municipal bonds in the U.S., offer tax-free interest, making them attractive for investors in higher tax brackets. Similarly, tax-free bonds in India provide interest income exempt from income tax.
2.5 Hedging Against Inflation
While not all bonds hedge against inflation, inflation-linked bonds (like TIPS in the U.S. or Inflation-Indexed Bonds in India) adjust principal or interest based on inflation, protecting investors’ purchasing power.
3. Key Risks in Bond Investing
Despite their reputation as safe investments, bonds carry risks:
Interest Rate Risk: When interest rates rise, bond prices fall, and vice versa. Long-term bonds are more sensitive to rate changes.
Credit Risk: Risk of issuer default, especially in corporate or high-yield bonds.
Reinvestment Risk: Risk that interest income cannot be reinvested at the same rate.
Inflation Risk: Fixed interest payments may lose value if inflation rises faster than expected.
Liquidity Risk: Difficulty in selling bonds quickly at a fair price, especially for low-volume corporate bonds.
Investors must weigh these risks against their income and capital preservation goals.
4. Types of Bonds
Bonds can be classified in multiple ways—by issuer, maturity, interest structure, and risk level. Understanding these types helps investors choose bonds aligning with their investment objectives.
4.1 Based on Issuer
4.1.1 Government Bonds
Issued by central or state governments to finance budget deficits or infrastructure projects. These bonds are considered low-risk. Examples include:
Treasury Bonds (T-Bonds): Long-term securities issued by the U.S. Treasury.
G-Secs (Government Securities) in India: Bonds issued by the Reserve Bank of India on behalf of the government.
Municipal Bonds: Issued by local governments or municipalities; often tax-free.
Features:
Low default risk
Lower yields compared to corporate bonds
Highly liquid
4.1.2 Corporate Bonds
Issued by companies to raise capital for expansion or operations. They typically offer higher yields than government bonds to compensate for higher risk.
Types of Corporate Bonds:
Investment-Grade Bonds: High credit quality (AAA to BBB).
High-Yield (Junk) Bonds: Lower credit quality, higher risk, higher returns.
4.1.3 Supranational Bonds
Issued by international organizations like the World Bank or IMF. Considered safe due to backing by multiple governments.
4.2 Based on Maturity
4.2.1 Short-Term Bonds
Maturity less than 3 years.
Advantages: Low interest rate risk, high liquidity.
Disadvantages: Lower yields.
4.2.2 Medium-Term Bonds
Maturity between 3–10 years. Balance between yield and interest rate risk.
4.2.3 Long-Term Bonds
Maturity above 10 years.
Advantages: Higher yields.
Disadvantages: High interest rate sensitivity, price volatility.
4.3 Based on Interest Structure
4.3.1 Fixed-Rate Bonds
Pay a fixed coupon rate over the bond’s life. Simple to understand, predictable income.
4.3.2 Floating-Rate Bonds
Coupon rate adjusts periodically based on a benchmark rate, like LIBOR or RBI repo rate. Protects against interest rate fluctuations.
4.3.3 Zero-Coupon Bonds
No periodic interest; sold at a discount and redeemed at face value. Profit comes from the difference between purchase price and face value.
4.3.4 Inflation-Linked Bonds
Principal or interest adjusts according to inflation, protecting the investor’s purchasing power. Example: U.S. TIPS or India’s Inflation-Indexed Bonds.
4.4 Based on Risk Level
AAA/Investment-Grade Bonds: Low risk, stable returns.
High-Yield/Junk Bonds: Higher default risk, higher returns.
Convertible Bonds: Can be converted into company stock, offering upside potential with lower interest.
5. How Bonds Are Priced
Bond prices fluctuate in response to interest rates, credit risk, and market demand. The key concepts in bond pricing include:
Par Value: Price at which the bond is issued.
Premium: Price above face value when coupon rates exceed market rates.
Discount: Price below face value when coupon rates are lower than market rates.
Yield to Maturity (YTM): The total return expected if the bond is held to maturity, accounting for interest payments and capital gain/loss.
Example: A 5-year bond with ₹1,000 face value and 8% coupon rate may trade at ₹950 if market interest rates rise to 9%.
6. Methods of Investing in Bonds
6.1 Direct Bond Purchase
Investors buy bonds through brokers or banks. Suitable for large portfolios and those seeking control over bond selection.
6.2 Bond Mutual Funds
Mutual funds pool money to invest in a diversified portfolio of bonds. Benefits include professional management, diversification, and liquidity.
6.3 Exchange-Traded Funds (ETFs)
Bond ETFs track bond indices and trade like stocks on exchanges. Offer liquidity and diversification with lower minimum investment.
6.4 Laddering Strategy
Investing in bonds with different maturities to manage reinvestment risk and maintain steady income.
7. Factors to Consider Before Investing in Bonds
Investment Objective: Income, capital preservation, or growth.
Risk Tolerance: Comfort with interest rate fluctuations and default risk.
Liquidity Needs: Ability to sell bonds without loss.
Economic Outlook: Interest rate trends, inflation, and credit market conditions.
Tax Implications: Consider tax-exempt bonds or tax-deferred accounts.
8. Advantages of Bond Investing
Steady income and cash flow
Capital preservation, especially with government bonds
Portfolio diversification and lower volatility
Tax benefits for certain types of bonds
Access to professional management through funds and ETFs
9. Disadvantages of Bond Investing
Interest rate sensitivity can lead to price volatility
Credit risk in corporate or high-yield bonds
Lower potential returns compared to equities
Inflation can erode real returns
10. Current Trends in Bond Markets
Increasing interest rates impact bond prices negatively.
Rise of green bonds and ESG (Environmental, Social, Governance) bonds for sustainable investing.
Growing popularity of bond ETFs for retail investors.
Central banks actively using bonds for monetary policy interventions.
11. Conclusion
Bond investing plays a critical role in building a balanced investment portfolio. By understanding the types of bonds, their risks, and returns, investors can make informed decisions that align with their financial goals. Whether seeking stable income, capital preservation, or hedging against market volatility, bonds provide an essential foundation for both individual and institutional investors.
Successful bond investing requires careful assessment of credit quality, interest rate trends, and diversification strategies. Using a mix of government, corporate, and specialized bonds like inflation-linked securities, investors can optimize returns while minimizing risk.
what is market needs ?market need a huge money to move < money will pass in market pocket to pocket.
each move is not same profit for them they also does not know how much they can earn so to minimize their loss they go for test .in test they have a pool we call it range/side. they feed small institute. they will help them with hedge funds in sharp move /.
when you want to trade . trust in just one trend do not trade by whole moves .

TSLA looking for rejection around 200HMASo, I've been bearish on TSLA around that $400 mark and was waiting for more PA to evolve before calling the shots. It broke down. Quite rapidly actually. Currently looking to see what happens when price floats around that 200HMA in red. Also looking at weekly RSI that broke down the centre of the channel. If RSI on weekly cannot reclaim above centra at 50 and price has a hard time returning above 200HMA, I'll be looking for another leg down on HTF. I'm looking at weekly timeframe here so be mindful about that. I'm fluid. For me, price doesn't have to get a clean rejection for me to make up my mind. Although, that would make life easier, I'll also look at how price behaves around a certain price level. What I mean by that is: I don't care whether the price will go higher than that 200HMA in daily candles. I care about weekly closes and formations around that area.

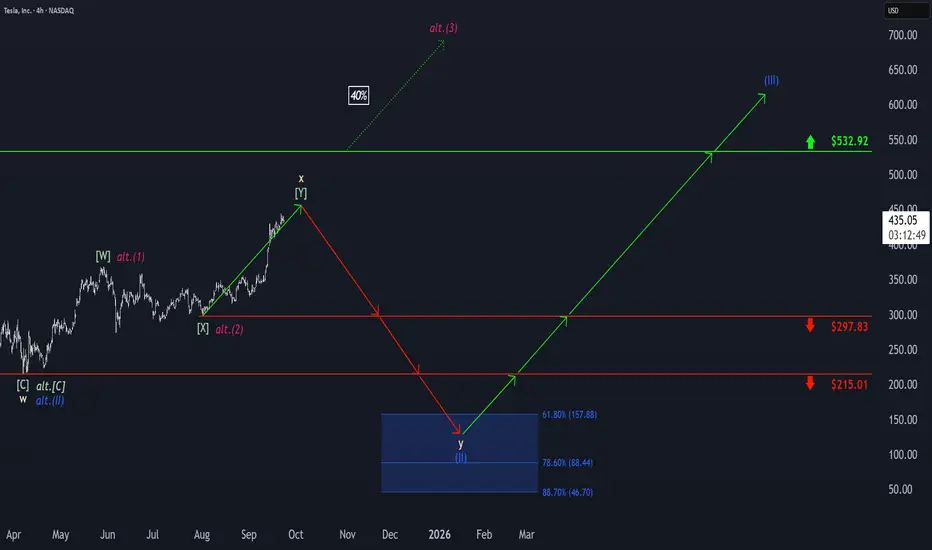
Tesla: Upward Momentum PersistsTesla’s upward momentum has persisted, with the beige wave x still having some room to run. However, we expect the corrective top to form well below resistance at $532.92, which should then trigger the final selling phase within the broader correction. Ultimately, wave y is projected to approach our blue Target Zone between $157.88 and $46.70, completing the large blue wave (II) in that range. Afterward, we anticipate a new wave (III) uptrend. That said, there remains a 40% probability that price may not reach the blue zone, as wave alt.(II) could have already completed at $215.01. In this scenario, TSLA would already be developing a magenta upward impulse and could break above the $532.92 level directly and sustainably.
Tesla: Robotaxi Hype and Breakout WatchNASDAQ:TSLA surged nearly +10% today, driven by growing anticipation around the upcoming robotaxi unveiling on August 8.
Investors are positioning early, speculating this innovation could open new revenue streams for Tesla and redefine mobility.
📊 Technical Setup:
• Price broke out of local resistance near $330
• Approaching major resistance at $370–371 (Bollinger Band + prior support)
• If $370 is broken and held, the stock could enter a new trading range: $370–$440
• RSI and Stochastic are heating up, but no signs of reversal yet
⚙️ Robotaxi Catalyst:
• Elon Musk confirmed the Robotaxi event set for August 8
• Analysts speculate this could boost valuation through AI and self-driving revenue potential
• Option volume and retail interest are rising fast
📌 Levels to watch:
• Breakout level: $370
• Target: $440
• Support zone: $330
• Invalidation: Close below $310
👀 Watch for pre-event momentum. A break above $370 could trigger a squeeze.

$TSLA: Breakout Wave Dimensions🏛️ Research Notes
Apart from known compression patterns for Tesla, there is another squeeze happening on smaller scale:
That area will be processed to derive the chart-based levels and see how market reacts to them.
Triangle
Breakout Expansion

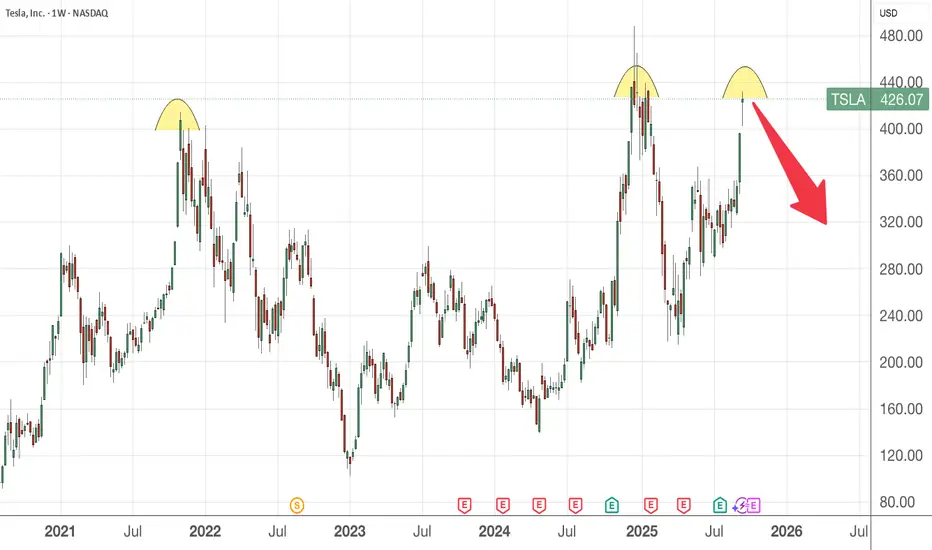
Is it time for TSLA to come down?First thing first, I do not own nor trade this stock. So do take it with a pinch of salt.
From the weekly chart, it seems to display a triple top formation which is bearish in nature. However, market is irrational and though it is highly overvalued, it could still continue to rally if the demand from buyers is there.
SL above 480 and aim for profit target at 299
Tesla, BearishIf the price breaks the 15m Low .. Then i boldly hold a sell after the retest
... Anyways , Happi Trading

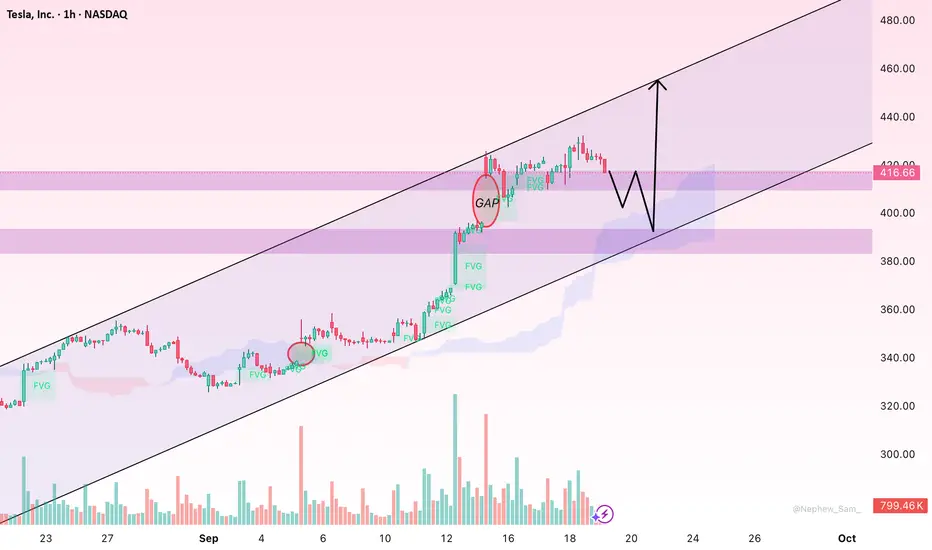
TSLA: Mild Pullback but Uptrend Remains IntactHello everyone,
Tesla’s share price (TSLA) slipped slightly today, closing at 416.66 USD, down 5.78 USD or 1.37% compared to the previous session’s high. After a strong rally earlier, the market is now watching closely to see whether Tesla can sustain its upward momentum or enter a deeper correction.
The main driver of this dip has been profit-taking after the stock approached the 430 USD level, creating selling pressure. Alongside this, Tesla’s prior upward moves have left several Fair Value Gaps (FVGs), which may serve as support zones if price revisits them, helping traders identify potential entry levels. In addition, trading volume has picked up significantly in recent sessions, showing strong inflows and active participation from major investors.
Looking ahead, despite the current mild pullback, Tesla shares are expected to extend their uptrend if they can hold above the 416 USD support. This is a crucial threshold—if it holds, price could revisit 430 USD and potentially move toward 440 USD in upcoming sessions.
The reasoning lies in the sustained capital inflows, the supportive role of FVG zones, and the Ichimoku cloud structure, which continues to back the bullish trend as long as price stays above it.
So, what’s your view? Will Tesla keep pushing higher toward 430–440 USD, or is a deeper retracement likely?
$TSLA - Bullish Flag Setup $510A Bullish Flag is setting up nicely on TSLA. If price breaks out of the flag, a measured move equaling the pole length would put its price objective roughly between $500-510.

$TSLA: Let The Rally Speak For Itself - 9/16/2025Based on the analysis, it’s confirmed that NASDAQ:TSLA has initiated a new rally following the completion of a lengthy and complex corrective structure at $288.
The stock bounced twice off the 50-week moving average, signaling strong support as the correction neared its end.
Due to the depth and complexity of the structure, Wave 3 is expected to unfold with high momentum, potentially delivering an explosive rally. Key upside targets are displayed in the chart — we’ll be watching closely to see how price reacts at those levels.
📚 Note: The internal structure and labeling were intentionally left visible in the chart for educational purposes. This is especially useful for traders interested in Modern Trading Algorithms and their structural variations.
Happy Trading, and let the rally speak for itself. 🚀
