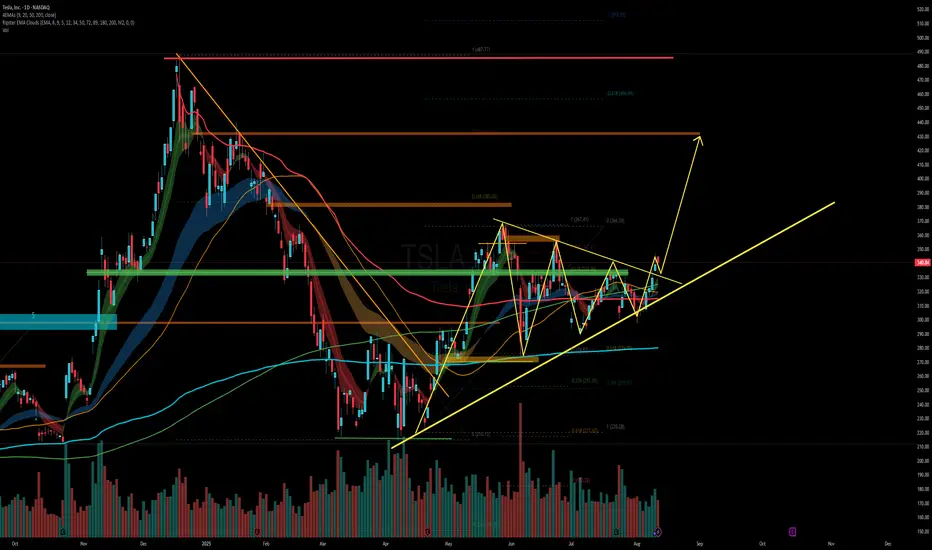
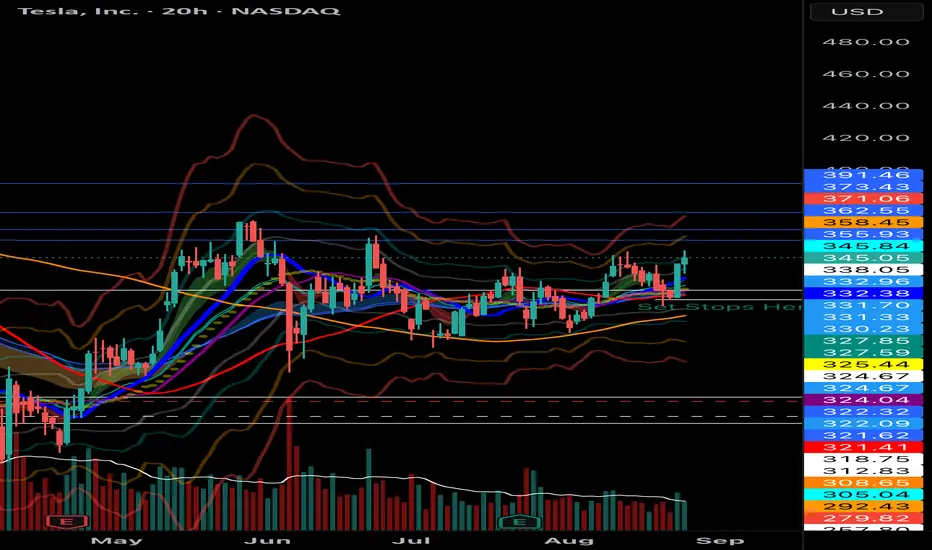
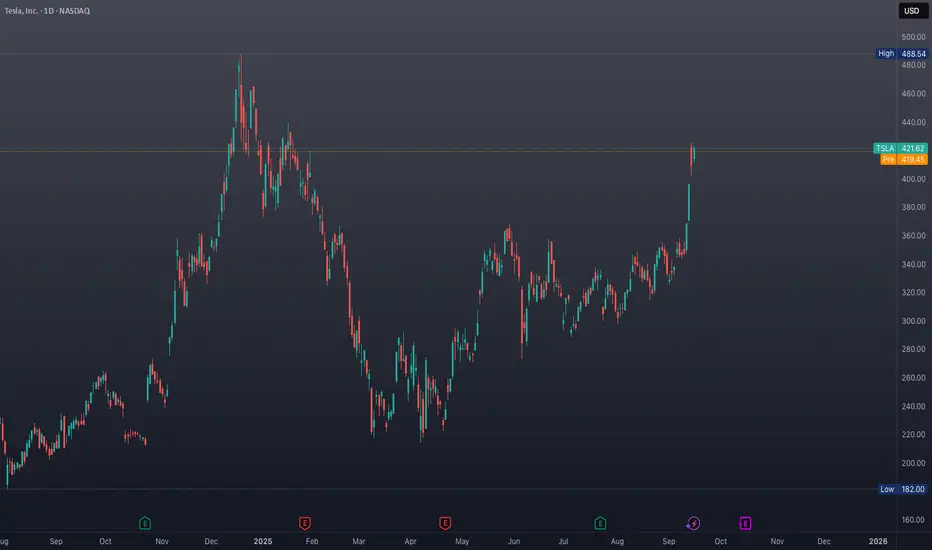
Can $TSLA push to new highs?TSLA looks like it's still bullish as it retested this support level and is now pushing back above it.
I think it's possible that we see a large move, potentially up to the $600 levels, but I've marked off key resistances to the upside as well incase we stop before that.
Let's see how it plays out over the coming weeks.
TL01 trade ideas

Major Global Shipping Hubs and Ports1. The Importance of Global Shipping Hubs
1.1 Gateways of Trade
Ports act as gateways for imports and exports, handling goods ranging from crude oil, grains, and automobiles to high-value electronics.
1.2 Nodes in Global Supply Chains
They serve as critical nodes in intermodal logistics, linking ships, railways, and trucking systems.
1.3 Economic Drivers
Ports stimulate economic growth by creating jobs, attracting industries, and boosting regional trade.
1.4 Strategic Geopolitical Assets
Some ports lie at chokepoints like the Strait of Malacca or the Suez Canal, giving them immense geopolitical significance.
2. Criteria for a Global Shipping Hub
A shipping hub is not just a large port—it must have:
High throughput capacity (container traffic measured in TEUs).
Strategic geographic location (close to major trade routes).
Connectivity (shipping alliances, inland transport, and logistics networks).
Advanced technology (automation, digital tracking, AI logistics).
Economic and geopolitical stability.
3. Asia: The Heart of Global Shipping
Asia dominates maritime trade, hosting the world’s busiest container ports due to its role as the global manufacturing hub.
3.1 Port of Shanghai, China
World’s busiest port since 2010.
Handles over 47 million TEUs annually.
Located at the Yangtze River Delta, serving China’s industrial powerhouse.
Features automated terminals and deep-water berths at Yangshan.
Connects to Europe, North America, and Asia-Pacific markets.
3.2 Port of Singapore
Often called the “World’s Busiest Transshipment Hub.”
Handles around 37 million TEUs per year.
Strategic position on the Strait of Malacca, linking East Asia with Europe, Middle East, and Africa.
Known for world-class efficiency, automation, and innovation.
PSA Singapore is building the Tuas Mega Port, which will consolidate all terminals by 2040.
3.3 Port of Ningbo-Zhoushan, China
Largest in terms of cargo tonnage (not just containers).
Integrates industrial hinterlands of Zhejiang province.
Strong in handling bulk commodities like coal, iron ore, and crude oil.
3.4 Port of Shenzhen, China
Adjacent to Hong Kong, serving Guangdong’s manufacturing hubs.
One of the fastest-growing container ports, with multiple terminals run by different operators.
3.5 Port of Hong Kong
Once the busiest port in the world, now overshadowed by mainland Chinese ports.
Still an important transshipment hub due to free port policies.
3.6 Busan Port, South Korea
Northeast Asia’s major transshipment hub.
Handles over 22 million TEUs annually.
Connects Korean industries with China, Japan, and global markets.
3.7 Port of Dubai (Jebel Ali), UAE
The largest port in the Middle East.
Gateway for trade between Asia, Africa, and Europe.
Known for logistics free zones, attracting multinational companies.
4. Europe: The Gateway Between East and West
Europe’s ports are essential for connecting Asia with the Atlantic economies.
4.1 Port of Rotterdam, Netherlands
Europe’s largest port, handling over 14 million TEUs annually.
Strategic location on the Rhine-Meuse-Scheldt Delta, providing inland access to Germany, France, and Central Europe.
Famous for automation, deep-water berths, and large oil refineries.
4.2 Port of Antwerp-Bruges, Belgium
Europe’s second-largest port.
Strong in handling chemicals, breakbulk, and containers.
Proximity to Rotterdam creates a Northern Range cluster.
4.3 Port of Hamburg, Germany
Germany’s largest port and Europe’s “Gateway to the East.”
Plays a major role in trade with China and Eastern Europe.
4.4 Port of Valencia, Spain
Spain’s busiest container port, serving as a hub for Mediterranean shipping.
Strong links to Latin America and North Africa.
4.5 Port of Piraeus, Greece
Acquired majority stake by China’s COSCO Shipping.
Serves as China’s gateway into Europe via the Belt and Road Initiative.
5. North America: Trade Powerhouses
5.1 Port of Los Angeles, USA
Largest container port in the U.S., handling 9–10 million TEUs annually.
Works in tandem with Port of Long Beach, forming the San Pedro Bay Port Complex.
Gateway for U.S.–Asia trade.
5.2 Port of Long Beach, USA
Known for green initiatives like electrified cranes and low-emission operations.
Together with LA, handles nearly 40% of U.S. imports.
5.3 Port of New York and New Jersey, USA
Largest East Coast port, handling cargo for the dense Northeast market.
Strong in logistics connectivity via rail and trucking.
5.4 Port of Savannah, USA
Fastest-growing U.S. container port.
Investment in deepening channels and expanding terminals.
5.5 Port of Vancouver, Canada
Canada’s largest port, linking Asian imports with North America.
Handles bulk commodities like grain, coal, and potash.
6. Latin America and Africa
6.1 Port of Santos, Brazil
Largest port in South America.
Handles Brazil’s soybean, sugar, and coffee exports.
6.2 Port of Colon, Panama
Located near the Panama Canal, serving as a key transshipment hub.
6.3 Port of Durban, South Africa
Africa’s busiest port.
Handles automotive exports and imports.
6.4 Port of Tanger Med, Morocco
One of Africa’s fastest-growing ports.
Strategic position near the Strait of Gibraltar, linking Europe and Africa.
7. Strategic Chokepoints and Their Ports
Some hubs gain importance due to chokepoints in global trade routes:
Suez Canal (Egypt): Port Said and Port Suez.
Panama Canal (Panama): Colon and Balboa.
Strait of Malacca: Singapore and Port Klang.
Gibraltar: Tanger Med.
These chokepoints are critical because blockages (like the Ever Given incident in the Suez Canal) can disrupt global supply chains.
8. Emerging Mega-Ports
8.1 Tuas Mega Port, Singapore
Will be the largest fully automated port by 2040.
8.2 Gwadar Port, Pakistan
Part of China-Pakistan Economic Corridor (CPEC).
Provides China direct access to the Arabian Sea.
8.3 Chabahar Port, Iran
Supported by India to bypass Pakistan for trade with Afghanistan and Central Asia.
9. Challenges Facing Global Ports
9.1 Congestion
Ports like Los Angeles and Shanghai often face severe backlogs, causing delays.
9.2 Environmental Concerns
Pressure to adopt green shipping practices and reduce emissions.
9.3 Geopolitical Tensions
Trade wars, sanctions, and conflicts can disrupt port operations.
9.4 Infrastructure Strain
Need for constant upgrades to handle growing container sizes (mega-ships with 24,000+ TEU capacity).
9.5 Digital Transformation
Integration of AI, blockchain, and IoT to streamline operations.
10. The Future of Global Shipping Hubs
Automation & Smart Ports: Drones, AI, and autonomous cranes.
Sustainability: Green hydrogen, shore power, and emission-free logistics.
Resilience: Ports diversifying supply chains to reduce risks from disruptions.
Regional Growth: Africa and South Asia may emerge as new port powerhouses.
Conclusion
Major global shipping hubs and ports are the lifelines of world trade, connecting producers and consumers across oceans. Asia dominates container handling, Europe acts as the West’s gateway, and the Americas provide vital import-export channels. Meanwhile, Africa and the Middle East are rising as strategic hubs.
These ports are not just infrastructure—they are economic engines, geopolitical assets, and technological pioneers. As global trade evolves, these hubs will adapt, expand, and innovate, ensuring the continuous flow of goods that sustains modern economies.
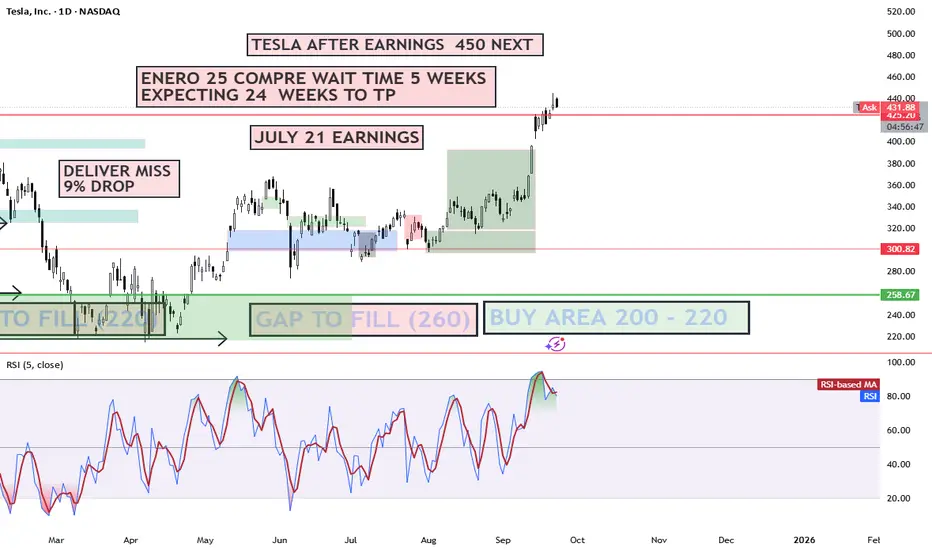
TESLA 500 BY EOY OR 2026 Why Tesla (TSLA) Could Hit $450 Then $500 by EOY 2025 or 2026: Key Catalysts Tesla's hovering around $315 today (as of Sept 23, 2025), down ~20% YTD amid sales dips, but the setup for a rebound to $450 (43% upside) and $500 (59% upside) is primed by execution on autonomy, EVs, and energy. Here's the bull case, blending fundamentals and forecasts:Robotaxi & FSD Rollout Momentum: Tesla's Cybercab unveil in Oct 2025 could catalyze a surge, with unsupervised Full Self-Driving (FSD) v13 hitting highways by year-end. ARK Invest's base case eyes $4,600 by 2026 (driven 60%+ by autonomy), but even conservative models like CoinCodex forecast $453 avg in 2026, with highs to $664 on ride-hailing revenue potentially adding $10T market value.
2 sources
Piper Sandler just hiked their PT, calling TSLA the "top idea" for AV investing.
EV Delivery Rebound & Affordable Models: Post-2025 sales weakness (1.8M deliveries est.), expect 2.3M+ in 2026 with Model 2 launch (~$25K EV) ramping production to 3M+ annually. This counters China/EU headwinds, recaptures 20%+ US market share, and boosts EPS to $0.49 next quarter—fueling a $450 breakout per LongForecast's Q3 2026 path.
2 sources
Morningstar sees a 2026 revival echoing 2016's Model 3 surge.
Energy Storage Boom: Megapack deployments exploding (Q2 2025: 9.4 GWh), with 50%+ YoY growth projected through 2026, diversifying revenue to 15%+ of total. This hedges EV volatility, pushing margins to 20%+ and supporting $500 on 11% revenue growth to $130B.
Optimus Humanoid Robot Sales: External sales kick off late 2025/early 2026, targeting $20K/unit with factory pilots scaling to millions. This could add $1T+ valuation long-term, per ARK, but even modest adoption lifts sentiment to $500 by EOY 2026.
2 sources
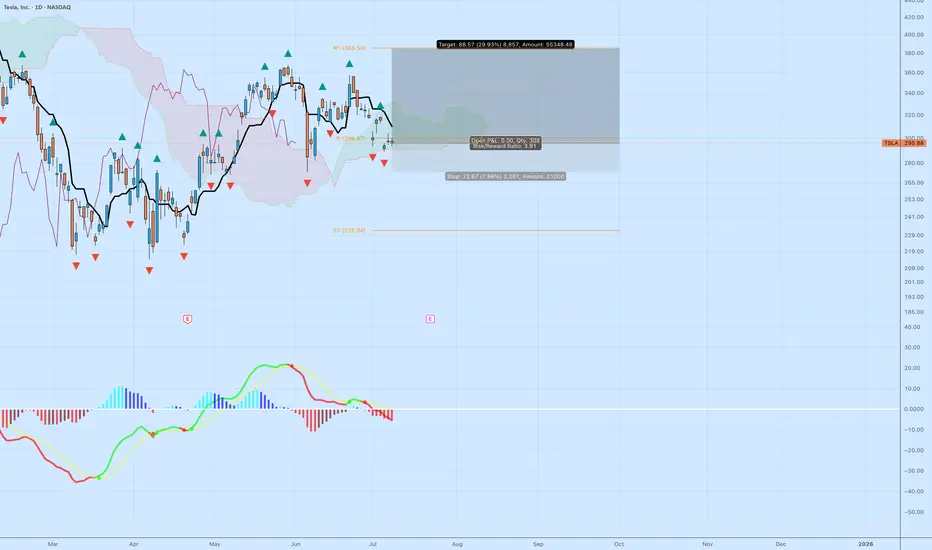
TSLA: High R/R Bounce Play Off the Cloud EdgeTesla NASDAQ:TSLA is sitting at a decision point — testing the edge of the Ichimoku cloud while momentum resets. The setup isn’t confirmed, but the risk/reward is compelling for those watching structure.
🔍 Technical Breakdown
Cloud Support: Price is holding right at the top of the cloud. A breakdown would signal trend weakness, but for now, it's a potential bounce zone.
MACD: Momentum has cooled off, but no bullish crossover yet. Early signs of a flattening histogram could suggest a pivot.
Structure: Horizontal support near $292–295 has held multiple times. If this zone holds again, the upside target opens up quickly.
🎯 Trade Specs
Entry: $296.88
Target: $385.50 (+29.93%)
Stop: $274.21 (–7.66%)
Risk/Reward: 3.91 — solid asymmetry
💡 Trading Insight:
This isn’t about calling bottoms — it’s about defining risk. When price compresses at known support, and you’ve got a 3.9 R/R profile, you don’t need to be right often to be profitable.
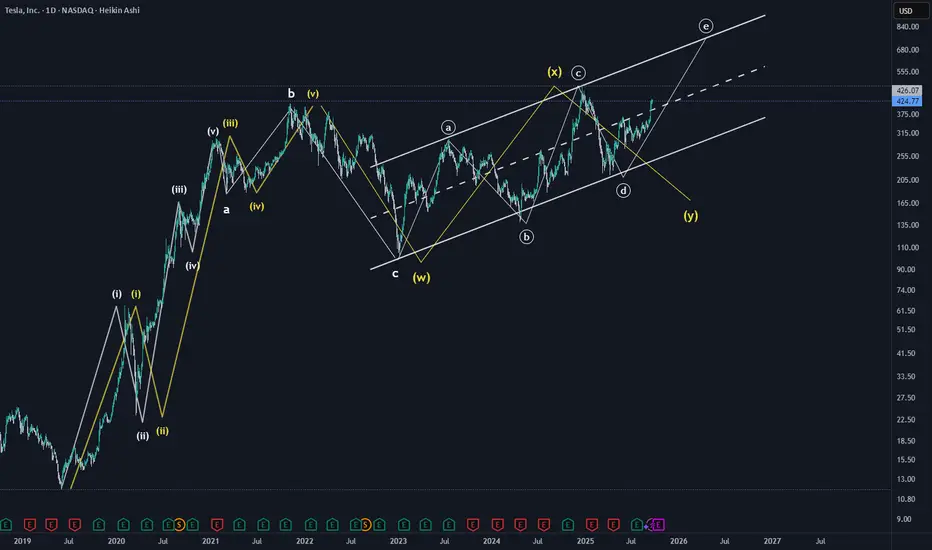
Bullish and Bearish Macro wave patternsThis chart provides a bullish and bearish wave pattern for Tesla. Even though the recent move was very impulsive, both bullish and bearish scenarios are equally possible. This is because the impulsive move seems to be wave C of either X wave or ending diagonal (E of ABCDE).
White represents Bullish scenario and Yellow represents bearish scenario.
Minimum Target reached for the C wave.
Note
**Disclaimer** : All details shared here is for educational purpose only. Please do your own research and consider appropriate risk management before making short term or long-term investment decisions.
Approach Market always with probabilities and make sure risk management in place.
Request your support by like, comment and follow
Ok TSLA.... holding or pullback?TSLA rocked & today it printed a dark cloud candle. Pullback perhaps?
Tesla typically can rally when things look bleak for the rest of the market. However, after that billion dollar move up, maybe we have a pull back before earnings. Or will we range?
<420/420 maybe retest the gap?
That's what I'm looking for.

TSLA Volatility Contraction Pattern (VCP) LONG When TSLA breaks above 350 and closes, the price will launch to $390 very quickly.
A VCP is a technical pattern, showing lessening declines in a range bound formation. A bull flag showing higher-lows is the best, as seen with TSLA.
Volatility is going to breakout sharply to the upside. If you TSLA above 350 just buy and hold, you’re too late trying to get a better deal.
🚀🚀🚀🌖
TSLA Breakout Watch for Sept 18 – Bulls Testing Key Supply LevelHere’s my fresh read on Tesla heading into Wednesday’s session
1️⃣ Market Structure & Price Action
* Clean breakout attempt: TSLA pierced the descending trendline drawn from last week’s highs and closed around $429, holding above the 9 EMA and reclaiming short-term momentum.
* Support shelf: $421–422 zone (prior supply) flipped to support. This is the first line of defense on any early dip.
* Upside pivot: Price is grinding along an ascending intraday trendline that points toward the $435–440 area if momentum keeps up.
2️⃣ GEX (Options Flow) Insight
* Call dominance: Call flow is heavy with ~90% call premium, IVR ~19.6 (low), and IVx ~65.3 (normalizing).
* Big call walls: $432.5 and $436 show strong gamma with 67%+ call concentration, which can attract price if bulls stay in charge.
* Put defense: Major put support sits at $412–417.5. A break below $412 would flip sentiment and invite a fast move to $400.
3️⃣ Trade Thoughts
* Bullish swing / scalp: Buy pullbacks into $423–426 with a stop under $421. Targets $435, stretch $440+.
* Bearish fade: Only if TSLA loses $421 and the hourly closes below it. First target $409, extended $400.
4️⃣ Option Angle
* With call interest stacked and IV still moderate, short-dated call spreads or debit spreads around $430/$440 look attractive for a measured upside shot.
* Aggressive traders could sell puts below $410 for premium, but that’s only if you’re comfortable owning shares on a breakdown.
5️⃣ Personal Take
I like the constructive action. Tesla cleared a multi-day squeeze and is running with the broader tech bid. As long as $421 holds, the path of least resistance is up. I’m watching volume on any morning retest—if buyers show up, I’ll lean long.
Disclaimer: This commentary is for educational discussion only and not financial advice. Always do your own research and manage risk before trading.

My Journey to Building the Adaptive Opening EdgeMy Journey to Building the Adaptive Opening Edge
Like many of you aspiring traders, I was once chasing shortcuts.
I wanted to get rich quick, to find the easiest way out.
Over 10 years ago, I first learned about trading through my mom. I got curious, started exploring, and went on a hunt for the “holy grail.” The history is always the same — I blew up account after account before I finally turned profitable.
The Missing Puzzle
I realized the key wasn’t some secret indicator or magic formula. It was me.
I needed to work on my fundamentals, my psychology, and my discipline.
At the same time, I felt there was a gap in the market — no tool truly fit the trading philosophy I was developing. I wasn’t looking for certainty; I wanted a way to stack probabilities and build expectancy.
Building the Signal
So I invested in myself.
📚 I spent hours in libraries.
💻 I learned coding and logic.
🧩 I started piecing together the type of tool I wished existed.
That’s how the Adaptive Opening Edge was born.
It wasn’t about predicting the future. It was about building a system that:
Risks a fixed % per trade
Avoids overnight risk entirely
Is robust (not overfit, not curve-fitted)
Focuses on expectancy, not win rate
From Testing to Trading
I backtested, forward tested, and finally went live.
I fine-tuned the code, but never broke its logic to “force” more wins. I needed it to be durable — able to handle randomness without collapsing.
For the first time in my trading career, I saw an equity curve I could trust.
The Real Breakthrough
The breakthrough wasn’t just the signal.
It was the combination of:
A robust tool (Adaptive Opening Edge)
The discipline to follow rules without deviation
The patience to let the law of large numbers play out
Trading stopped being about outcome.
It became about process.
Losses stopped hurting — they were just part of the data. Wins stopped exciting me — they were simply the advance payments of my expectancy.
Where I Am Today
I no longer chase predictions.
I don’t need the holy grail.
I’ve built a signal that reflects the way I believe trading should be:
Probability-driven
Rules-based
Consistent over the long run
That’s why I share my trades live on YouTube — every entry, every stop, every exit, no filters.
Final Note
The Adaptive Opening Edge isn’t about being right 100% of the time.
It’s about playing the same game the casinos play — exploiting a small, consistent edge over hundreds of hands.
If you want to learn more about the signal, buzz me.
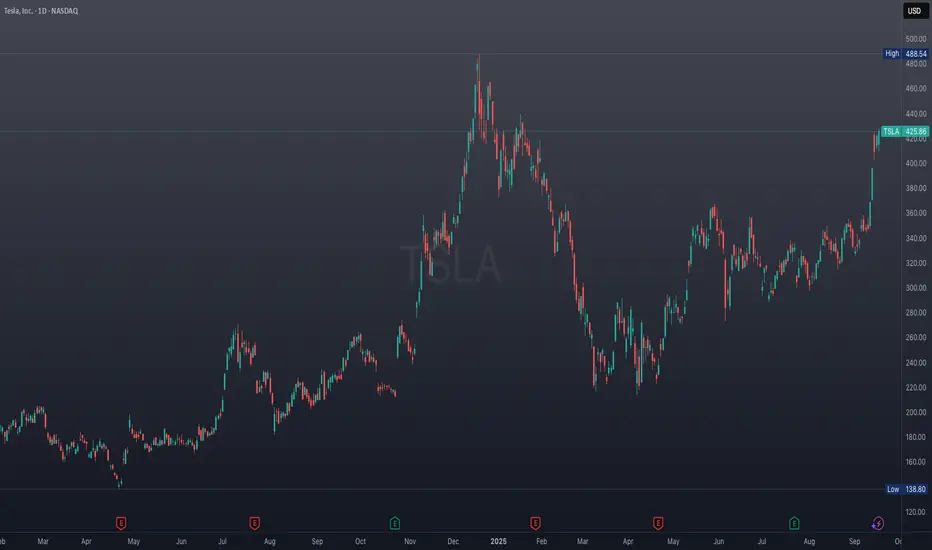
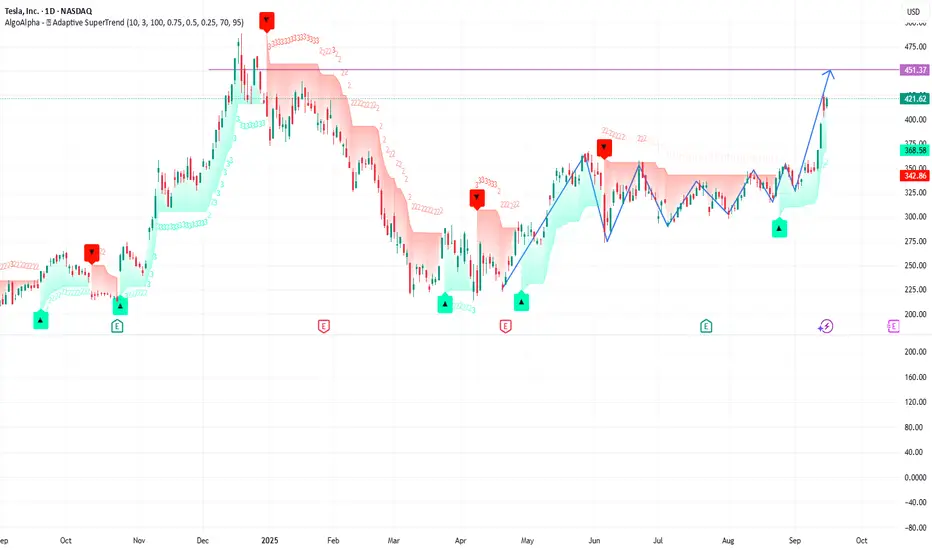
HOW MUCH HIGHER CAN TESLA GO? (September 17, 2025)Since my last video Tesla stock is up over 25% in the past week and we are breaking a very key Fibonacci levels.
In this video, we look at a higher timeframe charts to determine if Tesla can keep pushing towards $600 and $1000 in the coming months ahead given how much it is outperforming everything else in the stock market

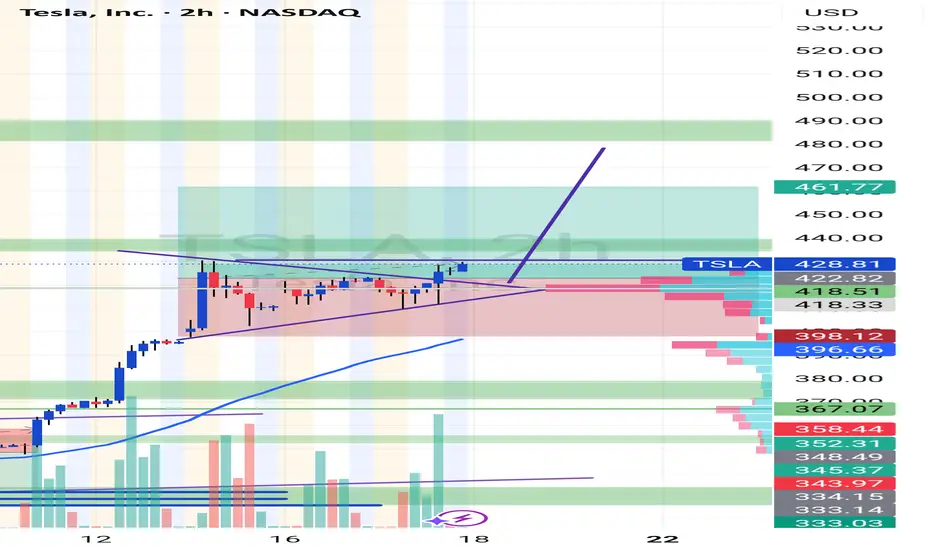
Bullish pennant pattern! This is what I'm looking at on the 2hr chart! It has finally broken out of this bullish pennant that was formed Monday, my price target now is somewhere 478/480 in the next few days! Will see ... this is NOT financial advice! Just sharing my personal analysis! That's all, Thanks!
Tesla - Technicals are pretty clear!🚨Tesla ( NASDAQ:TSLA ) respects the triangle:
🔎Analysis summary:
Ever since Tesla was listed on the Nasdaq, we saw perfect cycles playing out. Since 2021, Tesla has once again been consolidating within a bullish triangle pattern. Therefore with the recent bullish break and retest, it becomes more and more likely that Tesla will break out soon.
📝Levels to watch:
$400, $250
SwingTraderPhil
SwingTrading.Simplified. | Investing.Simplified. | #LONGTERMVISION

Every counter has a sweet spot. Every counter has a sweet spot. The only question: are you trading it at the right time?
Most traders obsess over what to trade, but few stop to ask when to trade it.
Timing is the difference between a setup that compounds consistently… and one that bleeds capital.
That’s exactly why I built thenexxtradealpha — Adaptive Opening Framework.
It’s designed to identify the optimal timeframe for any counter, so you’re not second-guessing whether you should be looking at the 5-minute, 15-minute, or daily chart.
The framework adapts to the counter itself — helping you trade in alignment with its natural rhythm, not against it.
Because once you know the right time, you stop forcing trades…
And start trading with precision.
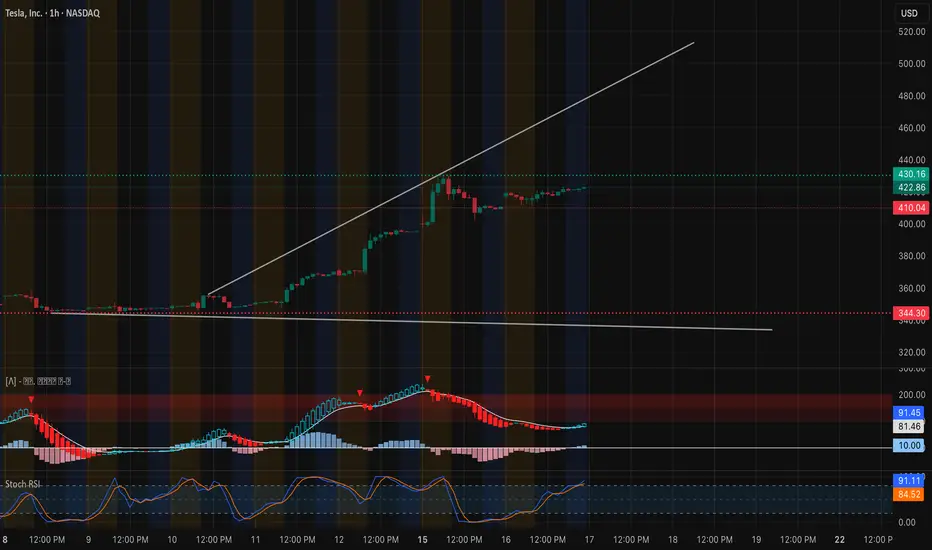
TSLA: Pausing at Key Zone – Swing & Scalp Setups for Sept 171-Hour Chart Technical View
Tesla’s rally from sub-$350 to the $420 area is now consolidating. After an explosive breakout on Sept 12–13, the 1-hour candles are moving sideways in a tight $410–$430 box. MACD has cooled from overbought and is starting to curl back up, while Stoch RSI is hovering in a neutral zone—showing that momentum is recharging, not reversing.
* Immediate Support: $410 (critical breakout retest)
* Major Support: $344 (key demand and high-volume node)
* Near-Term Resistance: $430–$440 (current supply zone)
* Upside Magnet: $450 and $484 if $440 clears with volume
EMA alignment (9 above 21) still favors the bulls, and price continues to respect the uptrend line from the early September pivot.
GEX & Options Flow
Options data underline strong bullish hedging pressure:
* Call Walls: $430 (2nd call wall), $440 (highest positive NET GEX / gamma resistance), $450 next target.
* Put Walls: $407.5 (1st defense), then $385 and $322.5.
* GEX Bias: Calls dominate with 92.8% call-weighted exposure. IVR at 20.1 (IVx ~65.9)
suggests decent option premiums but not extreme volatility pricing.
This configuration typically supports dip buying and favors upward grind, provided $410 stays intact.
Trade Thoughts & Suggestions
* Swing Idea: Accumulation on 1-hour closes above $410 with a stop below $400, aiming for $440–$450, and possibly $484 on continuation.
* Scalp Idea: Intraday traders can fade extremes inside the $410–$430 range, or take a momentum scalp if $430 breaks on strong volume.
* Bearish Scenario: A decisive break under $400 could unwind gamma support and invite a test of $385 and $344.
Quick Take
TSLA is digesting sharp gains in a healthy range. Strong call gamma at $430–$440 is both a near-term lid and a potential springboard. For Sept 17, look for continuation plays if $430 is taken out with conviction.
Disclaimer: This analysis is for educational purposes only and does not constitute financial advice. Always do your own research and manage risk before trading.
#TSLA Analysis, Elon breaks the Key level ^.^^Elon pours Big Money $$$ into TSLA stock recently causing Rally!
Price has gone up significantly, I don't think it will drop below $400 any time soon.
Strong Greenbar breaks out from the wedge with large volume increases.
Short sellers are getting squeeze out.
More investors are coming to catch smokey train.
Price Target next $480.
Come and join the Rally.
TSLA breaking out a rangeI think TSLA is moving up
The 1D timeframe show us how it was on a range and a few days ago started to go up
Next lvl should be 450, but also can go to 480
What do you think?
Bullish or bearish?
Do you see the bull flag?
Also the size and shape of candles remember me to a bullish movement.
When you see candlesticks all the day, everyday, you can see a pattern!
Lol
I am bullish on TSLAI have not changed my buy bias for this baby.
II will continue adding TSLA to my portfolio with $360 and $400 as my medium-term take profits.
Share your thought.
If you found this helpful, like, follow and share

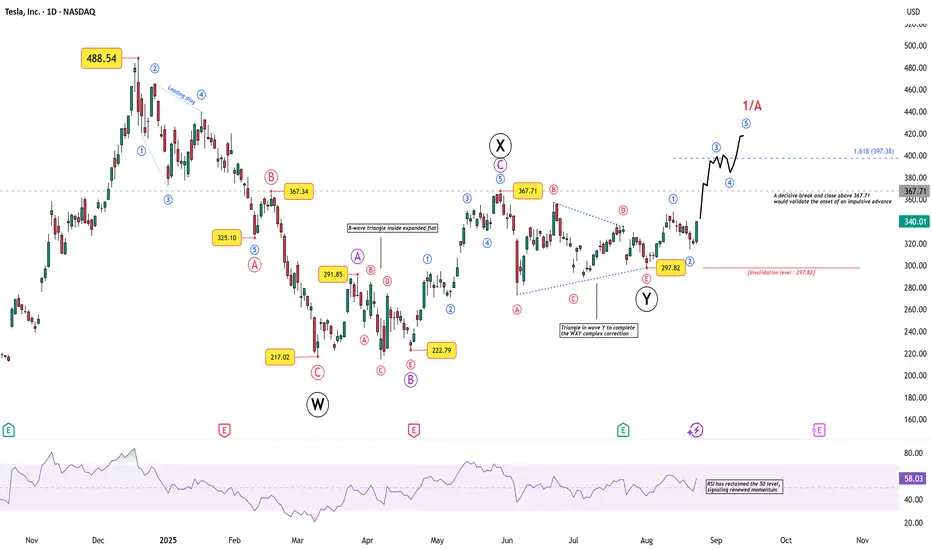
Tesla’s Breakout Test: Impulse or Fakeout?Tesla’s recent price action is stirring interest again, not just for retail traders but also for chart technicians who track Elliott Wave structures across global equities.
After a deep corrective phase that carried price down from 488.54 to 217.02 , Tesla has been carving out a multi-layered corrective structure. Here’s the breakdown:
Wave W completed into 217.02 , marking a sharp low.
This was followed by a complex X wave , which included an expanded flat where the B-wave unfolded as a triangle — a rare but valid corrective formation.
Wave Y then ended with a contracting triangle, neatly completing the W–X–Y correction near 297.82 .
From that point, Tesla appears to have begun an impulsive sequence:
Wave 1 and 2 are already visible, with the 297.82 low as the key invalidation level.
A decisive break and close above 367.71 would confirm the onset of Wave 3, targeting 397.38 (1.618× Wave 1).
Momentum is supporting the structure: RSI has reclaimed the 50 level, hinting at renewed strength.
What Next?
If the count holds, Tesla could be in the early stages of a larger impulsive rally, with Wave 1/A projecting toward the 400–420 zone . However, traders should remember that breaking below 297.82 invalidates the impulsive outlook and revives the broader corrective scenario.
Disclaimer: This analysis is for educational purposes only and does not constitute investment advice. Please do your own research (DYOR) before making any trading decisions.
Tesla breakout set up 2 potential moves for Tesla on 15 min chart should happen around the retail data release in the US.
Yes, Elon Musk Buys $1 billion of Tesla Stock - $TSLAYes, Elon Musk bought approximately $1 billion worth of Tesla stock on September 15, 2025. We had a nice Fib retracement buy zone on this one around $214-$235 levels. We got in late ourselves and got in at $340. As a value play, this stock still trades at premium valuations, hovering near $410 per share with a trailing P/E above 200x—far higher than both traditional automakers and most growth tech peers.
Risks remain significant. Competition from Chinese rivals, ongoing price cuts that pressure vehicle margins, and regulatory challenges in key markets raise questions about how sustainable current profitability will be. For trading purposes, I would never short the stock, but buy oversold dips and swing trade it.
--------------------------------------------------------------------------------------
Disclaimer:
I do not provide personal investment advice and I am not a qualified licensed investment advisor. I am an amateur investor.
All information found here, including any ideas, opinions, views, predictions, forecasts, commentaries, suggestions, or stock picks, expressed or implied herein, are for informational, entertainment or educational purposes only and should not be construed as personal investment advice. While the information provided is believed to be accurate, it may include errors or inaccuracies. I will not and cannot be held liable for any actions you take as a result of anything you read here.
Conduct your own due diligence, or consult a licensed financial advisor or broker before making any and all investment decisions. Any investments, trades, speculations, or decisions made on the basis of any information found on here, expressed or implied herein, are committed at your own risk, financial or otherwise.
Feel free to give us a follow and shoot us a like for more analysis updates.

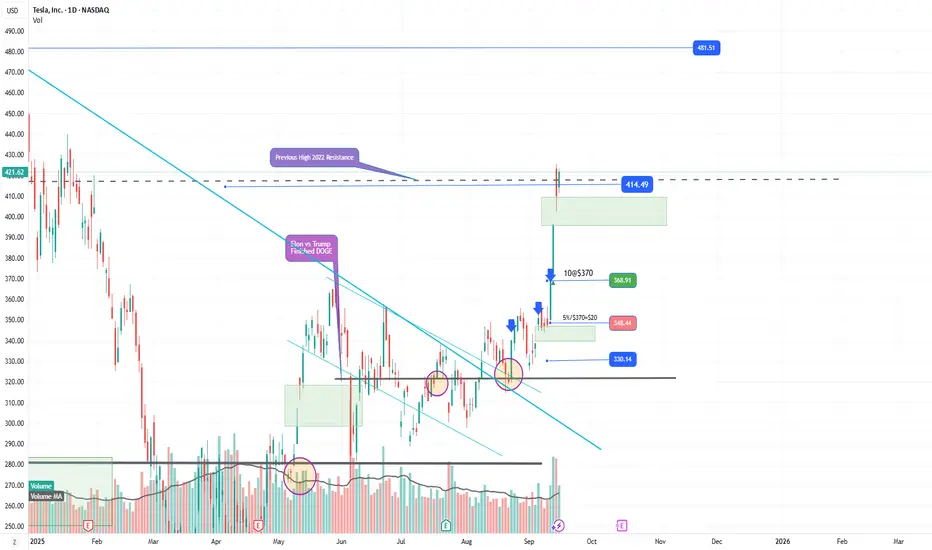
Tesla (TSLA) Stock Price Rises Above $400Tesla (TSLA) Stock Price Rises Above $400
As the chart shows, Tesla (TSLA) stocks are displaying strong market momentum. In particular, the price:
→ is above the psychological level of $400;
→ has reached its highest levels since late January;
→ has gained around 25% since the beginning of September.
Why Is TSLA Rising?
The main news driving the price surge was a media report that Elon Musk had purchased $1 billion worth of Tesla stock. The market interpreted this as commitment and confidence in the company’s future from its founder, which sharply increased demand for the shares.
Other factors contributing to TSLA’s rise include:
→ Expectations of a Federal Reserve interest rate cut to stimulate the economy. This makes growth stocks such as Tesla more attractive to investors.
→ Reduced tensions between Elon Musk and President Trump’s administration. This removes some of the political risks that had weighed on the stock.
Technical Analysis of TSLA Stock
In our August analysis of the TSLA chart, we:
→ noted that the price had broken through the upper boundary of a broad contracting triangle with its axis around $317;
→ suggested that a correction might follow after the rally in early August.
Since then:
→ the price made a minor pullback before reversing upwards (as shown by the arrow);
→ the bullish trend resumed, providing anchor points to construct a rising (blue) channel.
Thus, the chart confirms:
→ a shift in sentiment in favour of buyers;
→ an improving fundamental backdrop (as highlighted in the news) and growth prospects linked to robotaxis and other innovations.
From a bullish perspective, the breakout of $355 followed by accelerated growth points to strong demand.
From a bearish perspective:
→ the RSI indicator has spiked into overbought territory;
→ the price is near the upper boundary of the rising channel;
→ the seven-month high could prompt profit-taking by investors – already reflected in yesterday’s pullback.
Taking this into account, we could assume that while the long-term outlook remains optimistic, a correction is possible, for example:
→ towards the 50% retracement level of the A→B impulse;
→ into the price expansion zone (a bullish imbalance signal, as described by the Fair Value Gap pattern in the Smart Money Concept methodology).
This article represents the opinion of the Companies operating under the FXOpen brand only. It is not to be construed as an offer, solicitation, or recommendation with respect to products and services provided by the Companies operating under the FXOpen brand, nor is it to be considered financial advice.

TSLA 1H + GEX Game Plan for Tue, Sep 16TSLA Cooling After a Monster Run — Will 410 Hold or Is 430 Next? ⚡️
Market Structure (1-Hour View)
* Sharp run-up: TSLA ripped from mid-300s to a peak around 430 and is now consolidating in a broad rising channel.
* Trend support: Current pullback is testing a rising channel floor near 405–410.
* Momentum: MACD still in a bearish cross with fading histogram; Stoch RSI is climbing out of oversold — early sign of a potential rebound.
Key Levels to Watch
* Resistance: 410.8 (current pivot), 420.0–422.0, and 430.4 (recent high / gamma wall).
* Support: 402.2, 395.9, then deeper supports near 346.1 and 340.0 if momentum collapses.
GEX Read (Sep 16)
* Highest positive NETGEX / Call resistance: 430.4
* 2nd Call Wall: ~420–422 area.
* HVL / gamma pivot: 356–357.
* Put walls: 320 and 305.
* Options sentiment: Calls >100% (very call-heavy), IVR ~20, IVx ~65.9 — big bullish skew but with elevated implied volatility.
Implication:
* Dealers may keep TSLA pinned around 400–420 for balance.
* A strong reclaim of >420 with volume invites a retest of 430.4 and possibly higher.
* Lose 402 and a slide to 395–390 is possible.
Trade Scenarios
1) Bullish Continuation
* Trigger: 1H close >412–415 with uptick in volume.
* Entry: 414–415 on retest.
* Targets: 420 → 430.4.
* Stop: Below 408.
* Options: 420/430 call debit spread expiring this week.
2) Range Fade
* Trigger: Failure to clear 415 with repeated rejection wicks.
* Entry: 413–414 short.
* Targets: 402 → 395.9.
* Stop: Above 417.
* Options: 410P or 415/402 put spread for quick fade.
3) Deeper Pullback
* Trigger: Clear 1H break <402 with retest fail.
* Entry: 401–402 short.
* Targets: 395 → 390, with a stretch toward 356–357 (HVL) if heavy selling accelerates.
* Stop: Back above 406.
Options: 400/390 put spread for a measured pullback.
Scalping & Swing Notes
* First test of 410–412 will set the early tone; quick rejections there can produce a 5–10 point scalp.
* If we gap near 400, watch for a sweep into 395 then bounce back toward 410.
Risk & Management
* Keep sizing conservative: TSLA’s elevated IV means sharp intraday swings.
* Scale out partials at first target and tighten stops if momentum accelerates in your favor.
This analysis is for educational purposes only and does not constitute financial advice. Always trade with a plan and manage risk carefully.

TSLA - is it the time for Fireworks ?TSLA - huge base, many breakout failures due to news.
Let's see if this time it sustains this bullish move.