DYDXUSDT UPDATE#DYDX
UPDATE
DYDX Technical Setup
Pattern: Bullish Falling Wedge Pattern
Current Price: $1.92
Target Price: $2.40
Target % Gain: 25.22%
EURONEXT:DYDX is breaking out of a falling wedge pattern on the 1D timeframe. Current price is $1.92 with a target near $2.40, showing about 25% potential ups

#DYDX/USDT Breakout from Falling Wedge |
#DYDX
The price is moving within a descending channel on the 1-hour frame, adhering well to it, and is heading for a strong breakout and retest.
We have a bearish trend on the RSI indicator that is about to be broken and retested, which supports the upward breakout.
There is a major support are
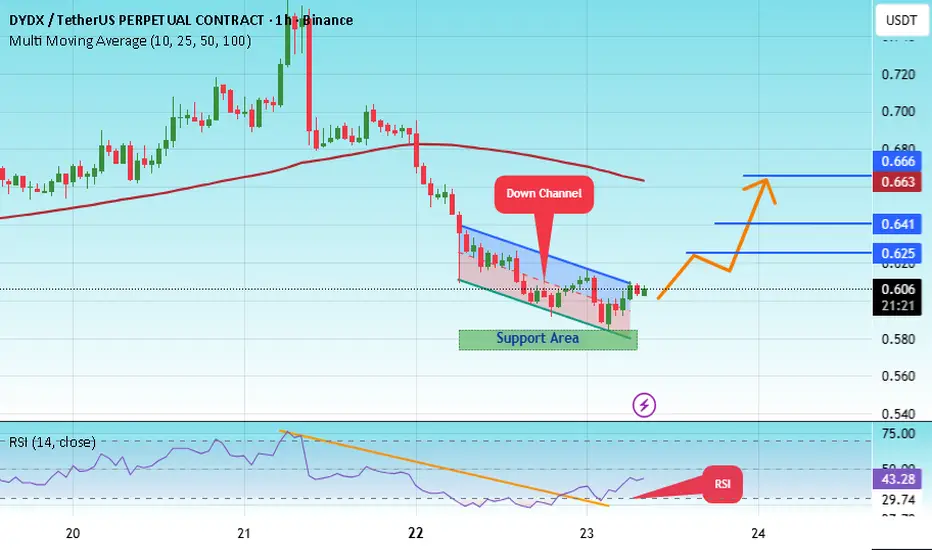
#DYDX/USDT Breakout from Falling Wedge |#DYDX
The price is moving within a descending channel on the 1-hour frame, adhering well to it, and is heading for a strong breakout and retest.
We have a bearish trend on the RSI indicator that is about to be broken and retested, which supports the upward breakout.
There is a major support area

DYDX -98% Secondary trend Holders reset. Inverse H&S 09 15 2025Logarithm 3 days. In the capitulation zone on the super negative, a reversal pattern of an inverted head and shoulders is formed. Its implementation of goals is to enter when the price overcomes the resistance of the pattern.
Main trend. -98%.
DYDX Main trend. 30 08 2024
15 09 2025
Manipul

DYDX Main trend 30 08 2024Logarithm. Time frame 1 week. Horizontal channel. Beginning of entry into the capitulation zone (under channel support). Formation of a locally descending wedge, in the final phase of formation (volatility narrowing).
Line chart.
Secondary trend. Wedge.

DYDX Secondary Trend. Capitulation Zone. Wedge. 30 08 2024Logarithm. Time frame 3 days.
Line chart.
Main trend and this secondary trend zone in it.
DYDX Main trend 30 08 2024

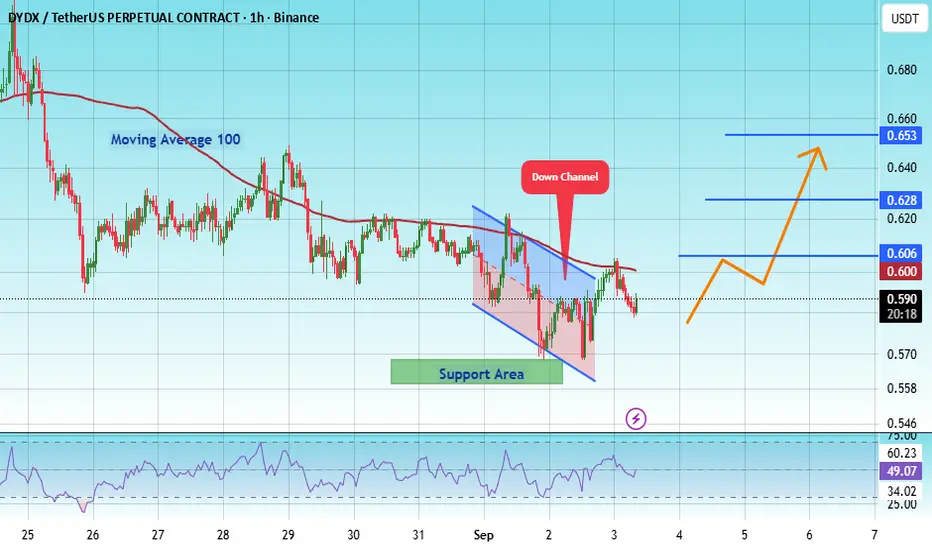
#DYDX/USDT Breakout from Falling Wedge | #DYDX
The price is moving within a descending channel on the 1-hour frame, adhering well to it, and is heading for a strong breakout and retest.
We have a bearish trend on the RSI indicator that is about to be broken and retested, which supports the upward breakout.
There is a major support area
DYDXUSDT UPDATE#DYDX
UPDATE
DYDX Technical Setup
Pattern : Bullish Falling Wedge Pattern
Current Price: $0.6186
Target Price: $0.78
Target % Gain: 25.35%
Technical Analysis: DYDX has broken out of a falling wedge on the 4H chart, confirming bullish momentum. The structure shows strong breakout with potential c

DYDXUSDT chart analysisDydx has reached a key support , which holds the potential for upward move from this area. It is suitable for long-term buying.
Disclaimer: This is not financial advice. Please do your own research before making any investment decisions.

#DYDX/USDT#DYDX
The price is moving within an ascending channel on the 1-hour frame, adhering well to it, and is on track to break it strongly upwards and retest it.
We have support from the lower boundary of the ascending channel, at 0.612.
We have a downtrend on the RSI indicator that is about to break a

See all ideas
Summarizing what the indicators are suggesting.
Oscillators
Neutral
SellBuy
Strong sellStrong buy
Strong sellSellNeutralBuyStrong buy
Oscillators
Neutral
SellBuy
Strong sellStrong buy
Strong sellSellNeutralBuyStrong buy
Summary
Neutral
SellBuy
Strong sellStrong buy
Strong sellSellNeutralBuyStrong buy
Summary
Neutral
SellBuy
Strong sellStrong buy
Strong sellSellNeutralBuyStrong buy
Summary
Neutral
SellBuy
Strong sellStrong buy
Strong sellSellNeutralBuyStrong buy
Moving Averages
Neutral
SellBuy
Strong sellStrong buy
Strong sellSellNeutralBuyStrong buy
Moving Averages
Neutral
SellBuy
Strong sellStrong buy
Strong sellSellNeutralBuyStrong buy
Displays a symbol's price movements over previous years to identify recurring trends.