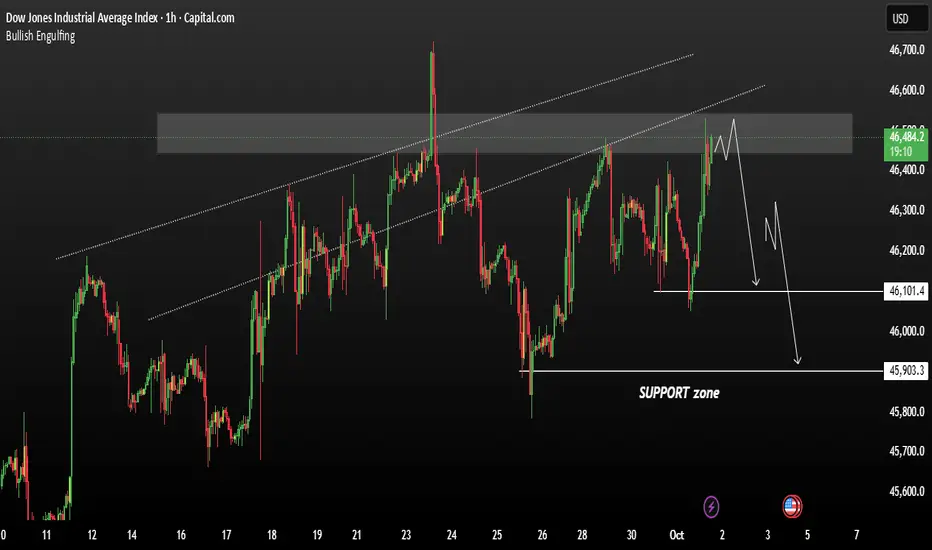
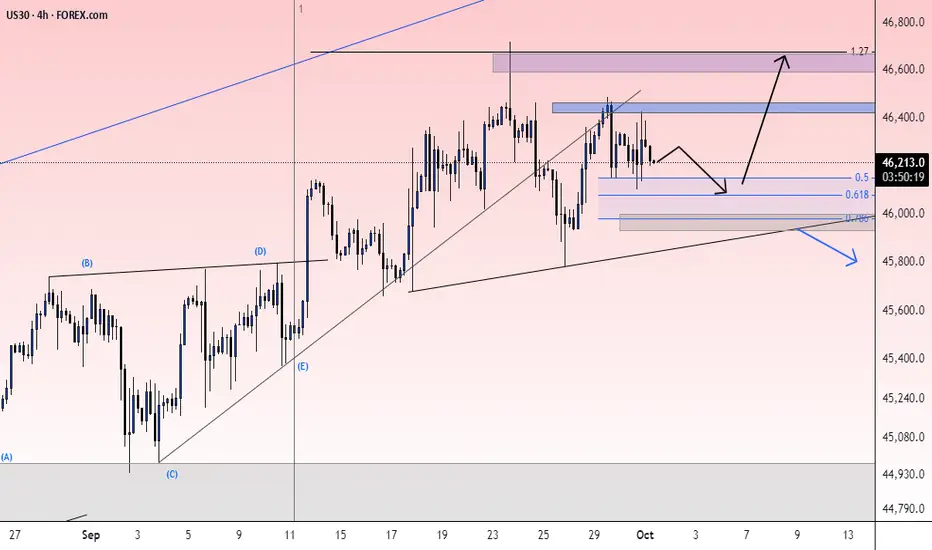
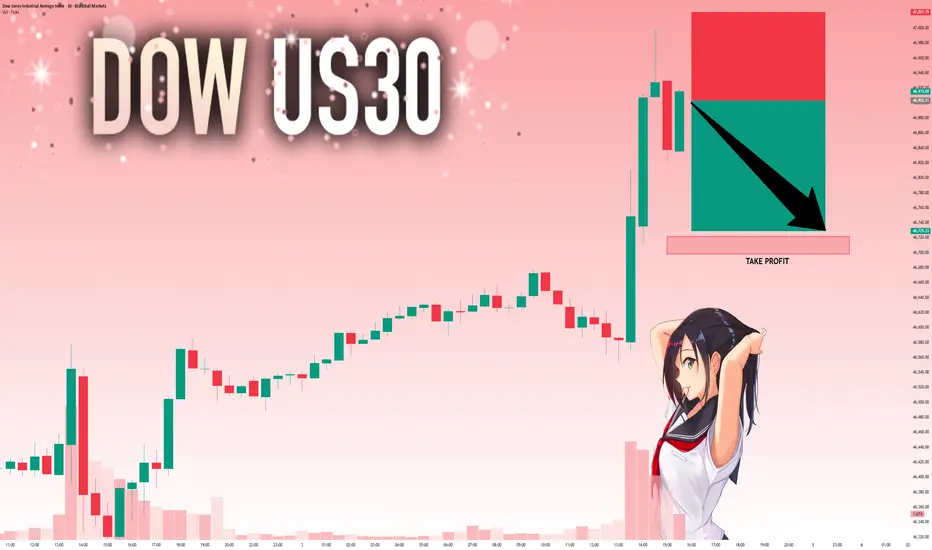
US30 currently consolidating near a key resistance zone US30 is currently consolidating near a key resistance zone likely around the yearly high / major supply level. This resistance has already been tested once previously, where price reversed downward sharply — showing sellers are active here The current sideways movement suggests the market is indecisive or absorbing liquidity before a larger move. If bearish momentum builds, potential support zone we could expect downside target 46,100 – 45,900 falling Range.
You may Find more details in the chart.
Trade wisely Best Of Luck.
Ps. Support with like and comments for better analysis Thanks for Supporting.
DJCUSD trade ideas
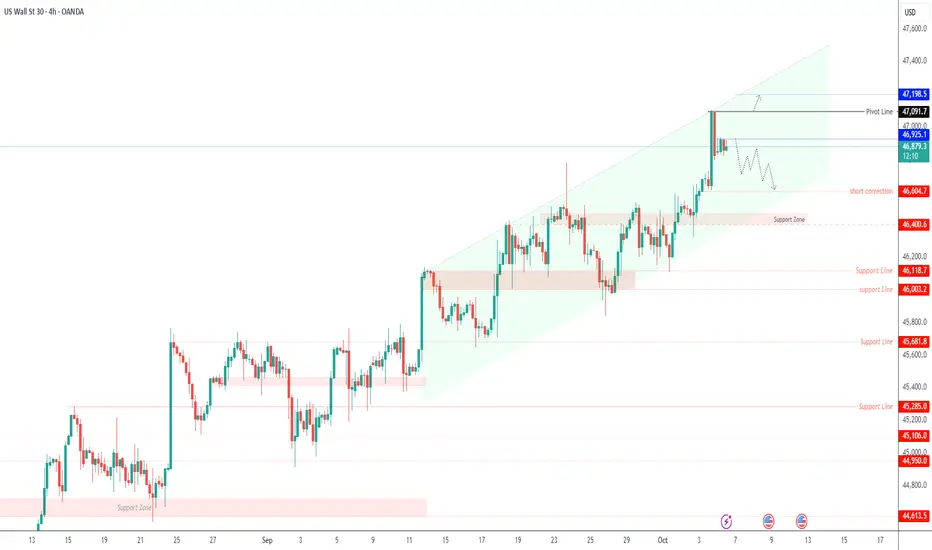
US30 – Short-Term Correction Expected After Record HighUS30 – Overview
The Dow Jones reached a new record high, but now shows signs of a short-term correction before the next move.
A minor pullback toward 46,680–46,610 is possible before the next directional breakout.
Technical Outlook
A break below 46,400 would confirm a shift to a bearish trend, with potential downside continuation.
On the other hand, a confirmed break above 46,925 would reinforce the bullish momentum, targeting 47,090 → 47,200 in extension.
Pivot: 46,925
Support: 46,680 – 46,600 – 46,400
Resistance: 47,090 – 47,200 – 47,350
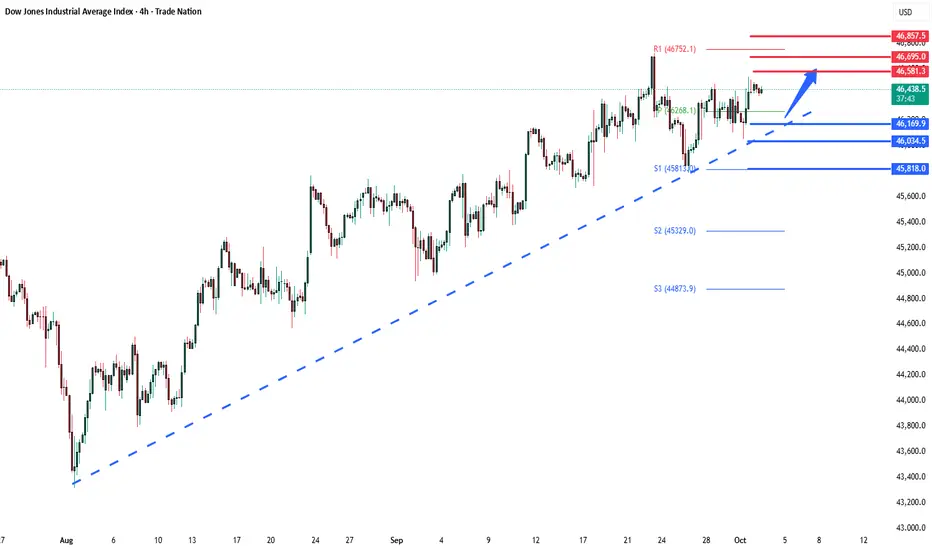
Dow Key Trading LevelsKey Support and Resistance Levels
Resistance Level 1: 46580
Resistance Level 2: 46690
Resistance Level 3: 46850
Support Level 1: 46170
Support Level 2: 46040
Support Level 3: 45800
This communication is for informational purposes only and should not be viewed as any form of recommendation as to a particular course of action or as investment advice. It is not intended as an offer or solicitation for the purchase or sale of any financial instrument or as an official confirmation of any transaction. Opinions, estimates and assumptions expressed herein are made as of the date of this communication and are subject to change without notice. This communication has been prepared based upon information, including market prices, data and other information, believed to be reliable; however, Trade Nation does not warrant its completeness or accuracy. All market prices and market data contained in or attached to this communication are indicative and subject to change without notice.
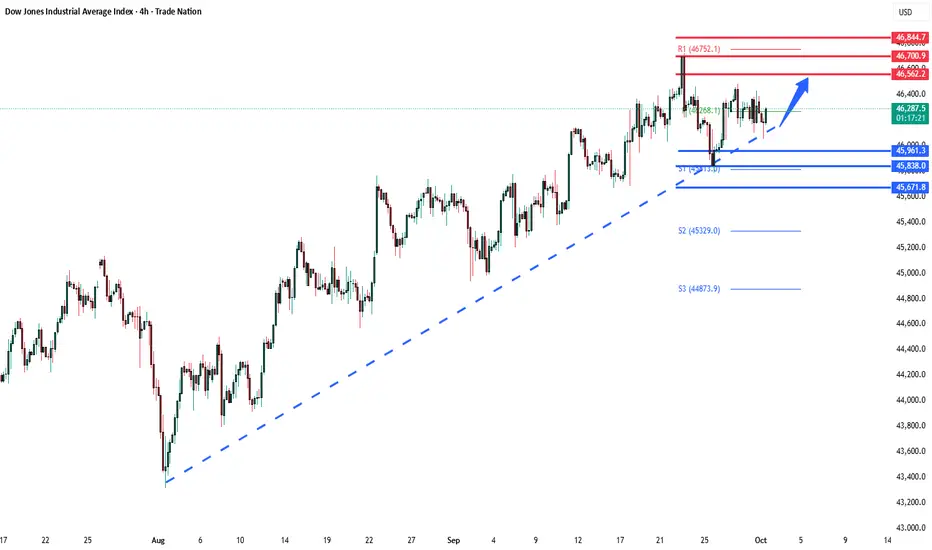
DowJones Key Trading levelsKey Support and Resistance Levels
Resistance Level 1: 46560
Resistance Level 2: 46700
Resistance Level 3: 46850
Support Level 1: 45960
Support Level 2: 45840
Support Level 3: 45670
This communication is for informational purposes only and should not be viewed as any form of recommendation as to a particular course of action or as investment advice. It is not intended as an offer or solicitation for the purchase or sale of any financial instrument or as an official confirmation of any transaction. Opinions, estimates and assumptions expressed herein are made as of the date of this communication and are subject to change without notice. This communication has been prepared based upon information, including market prices, data and other information, believed to be reliable; however, Trade Nation does not warrant its completeness or accuracy. All market prices and market data contained in or attached to this communication are indicative and subject to change without notice.
Watch the Dow Industrial TrendlinesNext week 10/06/25 to 10/10/25 could see the convergence of two long- term Dow Jones Industrial Average (DJI) trendlines.
The trendline connecting the DJI January 2022 and December 2024 peaks is near the current DJI level.
Sometime prior support trendlines can become resistance.
The trendline connecting the bottoms made in October 2023, August 2024, and January 2025 converges with the peaks trendline next week!
The area of DJI 47,200 to 47,400 could be important resitance.
Watch the DJI trendlines!

US30 1H🔹 Overall Outlook and Potential Price Movements
In the charts above, we have outlined the overall outlook and possible price movement paths.
As shown, each analysis highlights a key support or resistance zone near the current market price. The market’s reaction to these zones — whether a breakout or rejection — will likely determine the next direction of the price toward the specified levels.
⚠️ Important Note:
The purpose of these trading perspectives is to identify key upcoming price levels and assess potential market reactions. The provided analyses are not trading signals in any way.
✅ Recommendation for Use:
To make effective use of these analyses, it is advised to manually draw the marked zones on your chart. Then, on the 15-minute time frame, monitor the candlestick behavior and look for valid entry triggers before making any trading decisions.

check the trend It is expected that the correction process at the specified support levels will end and then we will witness a change in trend.
If the support range is broken, the continuation of the downward trend is likely.
Dow Oversold bounce back?Key Support and Resistance Levels
Resistance Level 1: 46560
Resistance Level 2: 46700
Resistance Level 3: 46850
Support Level 1: 45960
Support Level 2: 45840
Support Level 3: 45670
This communication is for informational purposes only and should not be viewed as any form of recommendation as to a particular course of action or as investment advice. It is not intended as an offer or solicitation for the purchase or sale of any financial instrument or as an official confirmation of any transaction. Opinions, estimates and assumptions expressed herein are made as of the date of this communication and are subject to change without notice. This communication has been prepared based upon information, including market prices, data and other information, believed to be reliable; however, Trade Nation does not warrant its completeness or accuracy. All market prices and market data contained in or attached to this communication are indicative and subject to change without notice.

US30 - Bullish PUSHI definitely see US30 fighting to crash. But I do see another push to the upside.
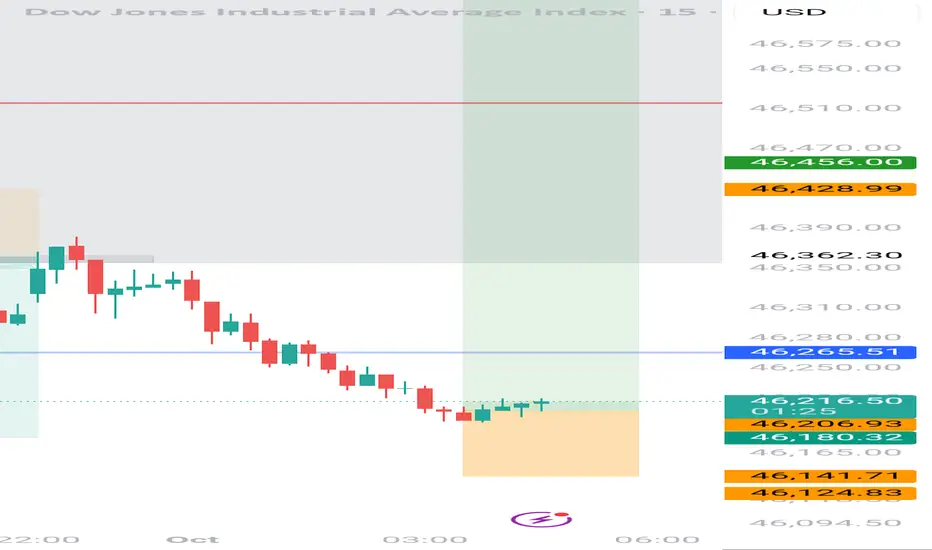
Us30 Trade Set Up Sep 30 2025Price is making HH/HL now so structure is bullish. I will want to see a close above the 15m FVG for price to go higher into the 4h FVG and higher to PDH
www.tradingview.com

US30 - TRADER EDGE
🎯 KEY PIVOT ZONE
SUPPLY ZONE: 46,380-46,440
➡️4 POC lines converge with prominent VRVP node forming major resistance
➡️Dense volume accumulation zone with multiple failed breakout attempts
➡️Price currently BELOW pivot - bearish structure intact
📊 PRICE TARGETS-
UPSIDE TARGETS ⬆️
T1: 46,380-46,440
T2: 46,540-46,600
DOWNSIDE TARGETS ⬇️
T1: 45,920-45,980
T2: 45,640-45,700
⚡💎⚡ EDGE - HIGHEST PROBABILITY PLAY
Short from 46,320-46,380 rejection targeting 45,920-45,980 then 45,640-45,700
🔍 PRE-ENTRY CONFIRMATION SIGNALS
✅ Price rallies to 46,340+ showing bearish reversal pattern (shooting star/bearish engulfing)
✅ Rejection wick forms at supply zone with failure to sustain above 46,360
✅ Volume surge on reversal candle confirming selling pressure activation
📈 TRADE SETUP
🔴PRIMARY BIAS: BEARISH
Short Setup:
Entry: 46,340-46,370 after confirmations
Stop Loss: 46,465
🎯Target 1: 45,920-45,980
🎯Target 2: 45,640-45,700
Risk/Reward: 1:3.8 / 1:6.5
🔄 BIAS FLIP CONDITIONS
🟢TURNS BULLISH IF:
Decisive break and 2H close above 46,450
Volume expansion exceeds 1.5x recent average on breakout
Successful retest of 46,400-46,420 as new support floor
⚡Then Target:
🎯46,540-46,600
🎯46,700-46,760
⚠️ RISK MANAGEMENT:
Max Risk: 110 points per contract
Position Size: Risk 1-2% of account capital
Time Stop: Only trade within NYSE's peak volume segments
US30 buy order (5.72 RR)
Even though price did make a lower high , it has a higher low and when when price will reaches my order it means that bulls will be in charge of the market
Bullish price action will be validated when price reaches my level (higher highs , higher lows)
I will be targeting the new high made on Tuesday
Price went on a 2 day selloff after the new high
I have been waiting all week long for a trade (distracting myself with stocks ideas, need to stay in my jurisdiction)
The only clear setup I have seen this week
Price is creating a higher low on the 4h
Canceling order if price closes below 45 842.6 before triggering my order

US30 : BULLISH PATTERNI am going to wait until it mitigate my continuation demand area ... And HoLD !
I will see how it goes . Happi Trading
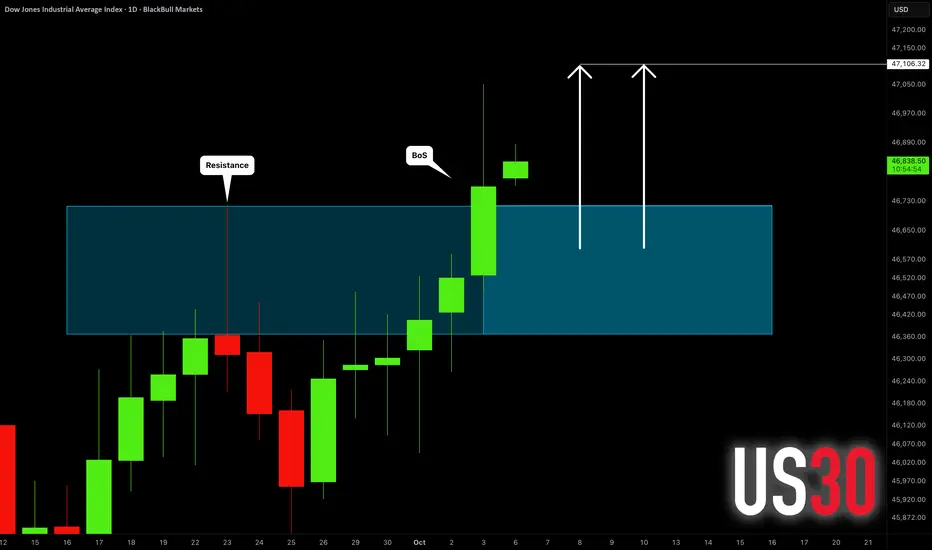
DOW JONES INDEX (US30): Another BoS Confirmed
US30 updated the all-time high on Friday, breaking and closing
above a major daily horizontal resistance cluster.
It opens a potential for more growth now.
Next resistance is 47100.
❤️Please, support my work with like, thank you!❤️
I am part of Trade Nation's Influencer program and receive a monthly fee for using their TradingView charts in my analysis.
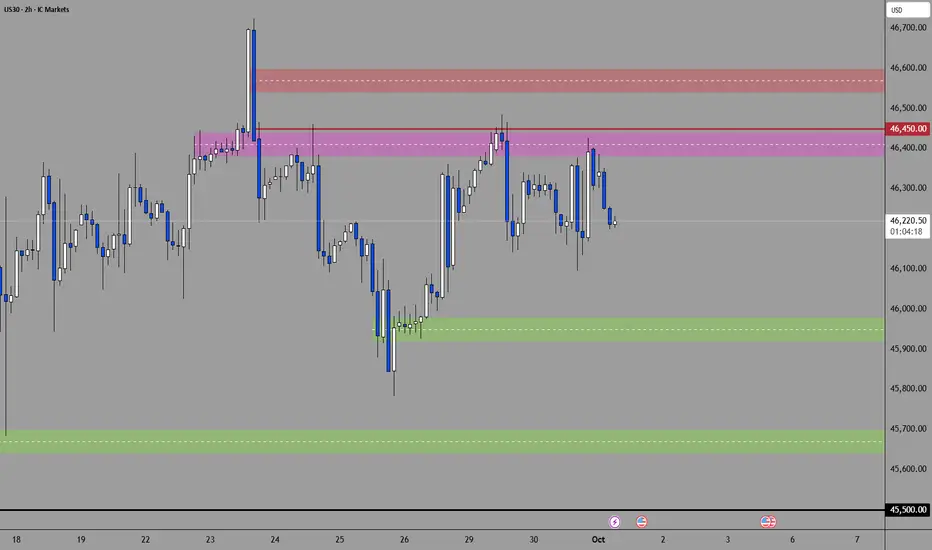
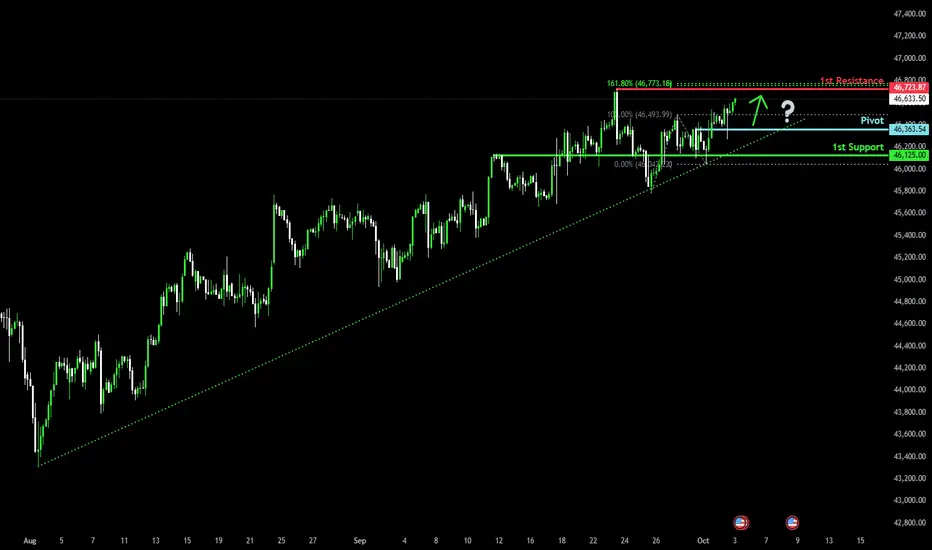
Bullish momentum to extend?Dow Jones (US30) has bounced off the pivot and could rise to the 1st resistance whch acts as a swing high resistance.
Pivot: 46,363.54
1st Support: 46,125
1st Resistance: 46,723.87
Disclaimer:
The above opinions given constitute general market commentary, and do not constitute the opinion or advice of IC Markets or any form of personal or investment advice.
Any opinions, news, research, analyses, prices, other information, or links to third-party sites contained on this website are provided on an "as-is" basis, are intended only to be informative, is not an advice nor a recommendation, nor research, or a record of our trading prices, or an offer of, or solicitation for a transaction in any financial instrument and thus should not be treated as such. The information provided does not involve any specific investment objectives, financial situation and needs of any specific person who may receive it. Please be aware, that past performance is not a reliable indicator of future performance and/or results. Past Performance or Forward-looking scenarios based upon the reasonable beliefs of the third-party provider are not a guarantee of future performance. Actual results may differ materially from those anticipated in forward-looking or past performance statements. IC Markets makes no representation or warranty and assumes no liability as to the accuracy or completeness of the information provided, nor any loss arising from any investment based on a recommendation, forecast or any information supplied by any third-party.
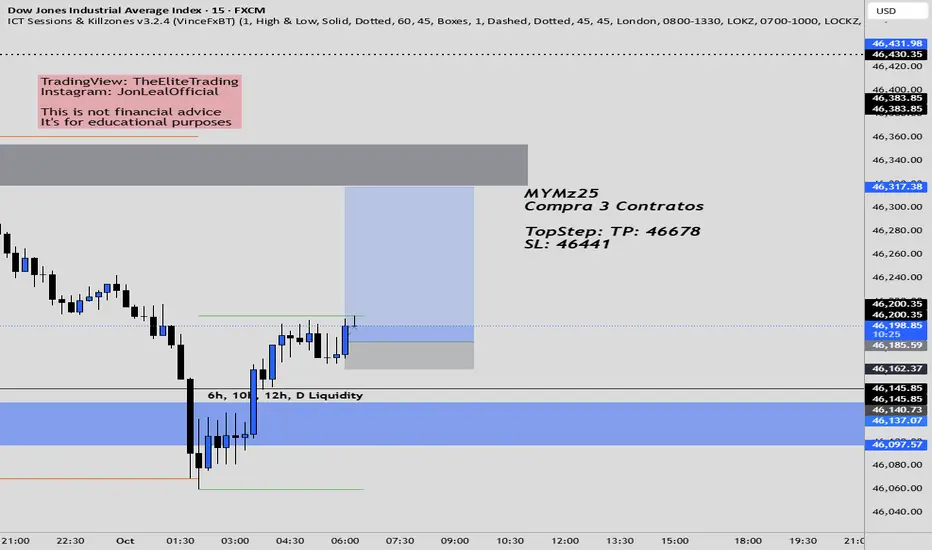
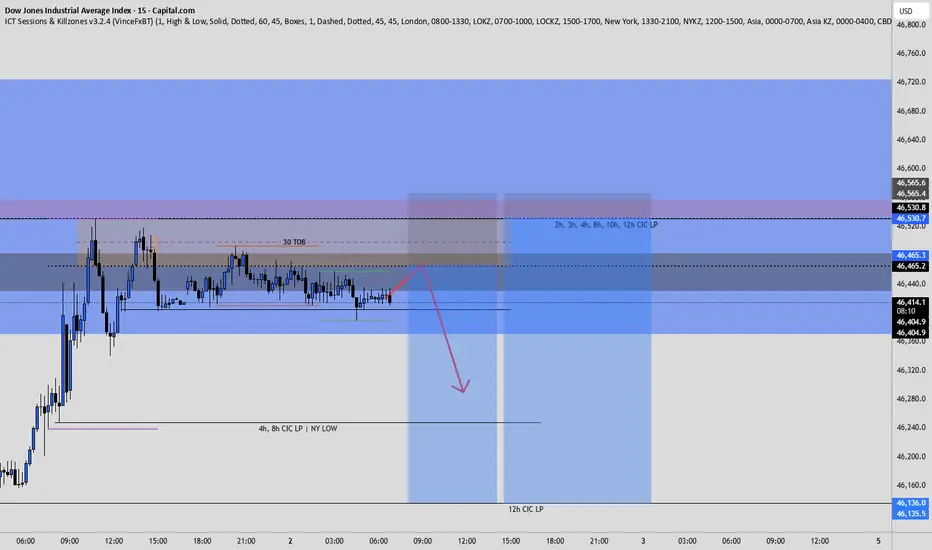
US30 ShortElite Analysis
Price is acquiring liquidity inside Daily and 4H structured liquidity zone
We are looking for price to come up, react off a FVG and liquidity marked out by various time frames
Targeting lower liquidity pools
Looking to SHORT US30Thou we are in a Bullish Trend and All time High which might be difficult to time or predict the local top or major Resistance level, however IMO we have been moving up with a Rising Wedge Pattern on the daily which symbolize a potential "Massive Pullback"


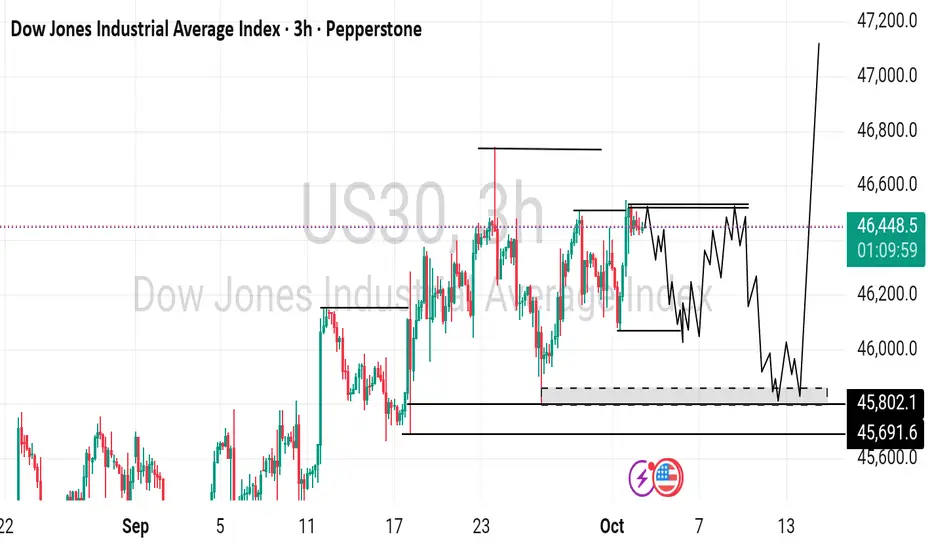
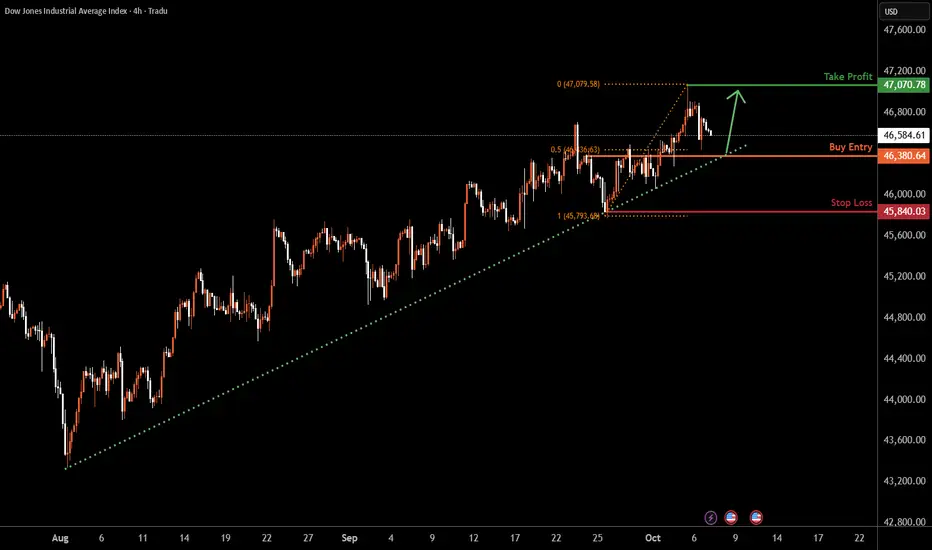
US30 H4 | Continuation Of Bullish MomentumBased on the H4 chart analysis, we could see the price fall to the buy entry at 46,380.64, whichis a pullback support that aligns with the 50% Fibonacci retracement and could bounce from this level to the upside.
Stop loss is at 45,840.03, which is a pullback support.
Tak eporfit is at 47,070.78, which is a swing high resistance.
High Risk Investment Warning
Trading Forex/CFDs on margin carries a high level of risk and may not be suitable for all investors. Leverage can work against you.
Stratos Markets Limited (tradu.com ):
CFDs are complex instruments and come with a high risk of losing money rapidly due to leverage. 65% of retail investor accounts lose money when trading CFDs with this provider. You should consider whether you understand how CFDs work and whether you can afford to take the high risk of losing your money.
Stratos Europe Ltd (tradu.com ):
CFDs are complex instruments and come with a high risk of losing money rapidly due to leverage. 66% of retail investor accounts lose money when trading CFDs with this provider. You should consider whether you understand how CFDs work and whether you can afford to take the high risk of losing your money.
Stratos Global LLC (tradu.com ):
Losses can exceed deposits.
Please be advised that the information presented on TradingView is provided to Tradu (‘Company’, ‘we’) by a third-party provider (‘TFA Global Pte Ltd’). Please be reminded that you are solely responsible for the trading decisions on your account. There is a very high degree of risk involved in trading. Any information and/or content is intended entirely for research, educational and informational purposes only and does not constitute investment or consultation advice or investment strategy. The information is not tailored to the investment needs of any specific person and therefore does not involve a consideration of any of the investment objectives, financial situation or needs of any viewer that may receive it. Kindly also note that past performance is not a reliable indicator of future results. Actual results may differ materially from those anticipated in forward-looking or past performance statements. We assume no liability as to the accuracy or completeness of any of the information and/or content provided herein and the Company cannot be held responsible for any omission, mistake nor for any loss or damage including without limitation to any loss of profit which may arise from reliance on any information supplied by TFA Global Pte Ltd.
The speaker(s) is neither an employee, agent nor representative of Tradu and is therefore acting independently. The opinions given are their own, constitute general market commentary, and do not constitute the opinion or advice of Tradu or any form of personal or investment advice. Tradu neither endorses nor guarantees offerings of third-party speakers, nor is Tradu responsible for the content, veracity or opinions of third-party speakers, presenters or participants.
US30: Strong Bearish Sentiment! Short!
My dear friends,
Today we will analyse US30 together☺️
The recent price action suggests a shift in mid-term momentum. A break below the current local range around 46,903.31 will confirm the new direction downwards with the target being the next key level of 46,721.37 and a reconvened placement of a stop-loss beyond the range.
❤️Sending you lots of Love and Hugs❤️
Us30 Trade Set Up Oct 1 2025price swept PDL and flew up so i will wait to see a sweep of 15m SSL followed by 1m IFVG/CISD to target PDH or a sweep of BSL/Asia highs followed by a pullback into internal FVG to then go higher
www.tradingview.com

Wyckoff Distribution schematicsThis count is based on my assumptions so anything can happen not a trading or financial advice just for educational purposes only kindly do your own ta thanks trade with care good luck.
