DJCUSD trade ideas
Last Day Of The Month ,But...Today was A Clear TGIF And The Last Day Of The Month, But CSID Or Inversed FVG Closed Above Is A Great Long Position To The Office Low Resistance Liquidity

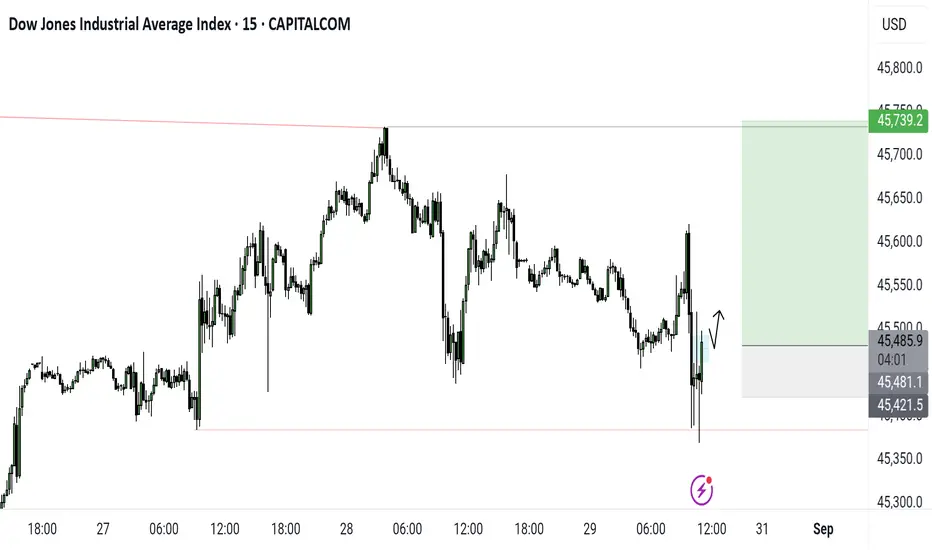
LONG ON DJ / US30 READINGContinuation after a short PullBack On H1 timeframe
Another Entry can be done on the current Trend Line to the upside.
After a Breakout to the upside which is still valid for a Buy trade
Entry Price .... 45,487.26
DJ / US30... 45,487.26
S/L ...45,400.00
T/P ...45,650.0
Also looking at a final touch to 46,000.0 LEVEL.
And More
Dow Jones Index Analysis (US30 / Dow Jones)The index is currently trading in an overall uptrend, showing a rebound from the recent support zone at 45,440.
🔺 Bullish Scenario:
If the price holds above 45,440, it could push the index towards 45,700, and then open the way to 46,000.
🔻 Bearish Scenario:
If the price breaks below 45,440 and holds beneath it, the index may head to test the 45,200 level.

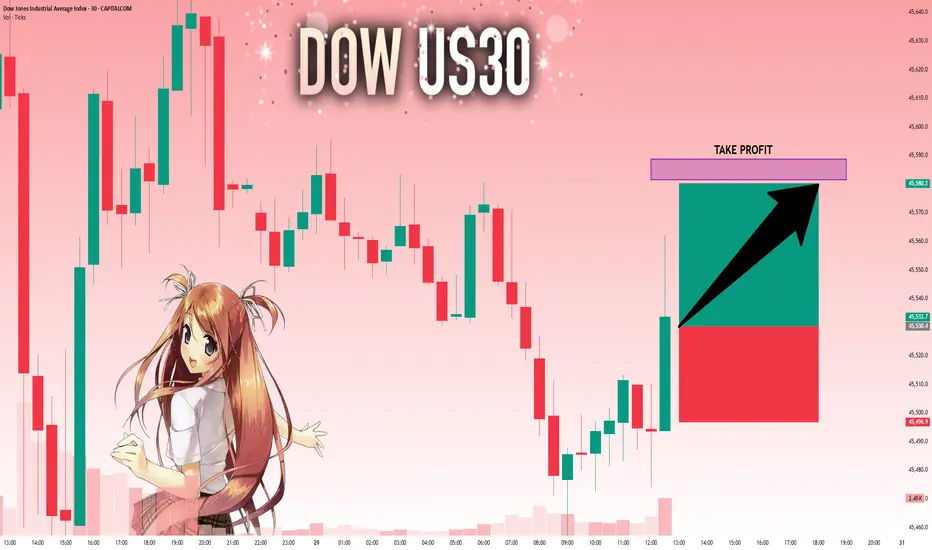
US30: Bulls Are Winning! Long!
My dear friends,
Today we will analyse US30 together☺️
The price is near a wide key level
and the pair is approaching a significant decision level of 45,530.4 Therefore, a strong bullish reaction here could determine the next move up.We will watch for a confirmation candle, and then target the next key level of 45,581.4 .Recommend Stop-loss is beyond the current level.
❤️Sending you lots of Love and Hugs❤️
#DJI30 hits record highs: The index just made history!On August 22, 2025, the #DJI30 surged past 45,700, setting a new all-time high. The rally was fueled by growing expectations of a Fed rate cut, with cheap money once again making stocks attractive. Strong earnings reports from industrial and banking sectors, along with new White House infrastructure investment plans, added to the bullish sentiment. A solid labor market and resilient consumer activity continue to ease recession fears, prompting capital to flow out of volatile assets and into blue-chip stocks. As a result, #DJI30 posted a powerful breakout and reinforced its role as a key barometer of U.S. economic strength.
Why the #DJI30 rally may still have room to run:
Easing Fed policy: Lower rates and controlled inflation create favorable conditions for borrowing and investing.
U.S. infrastructure expansion: Government spending on transport, energy, and digitalization supports real-sector companies — the core of #DJI30.
Strong corporate earnings & dividends: Many Dow components offer reliable dividends, making the index attractive amid broader market volatility.
Shift from risky assets: Funds and individual investors are rotating out of crypto and growth stocks into more stable “industrial giants.”
U.S. geopolitical resilience: Despite global tensions, the U.S. remains a “safe haven” for investors, boosting demand for American equities.
The continued rise of #DJI30 is underpinned by robust corporate profitability and the overall resilience of the U.S. economy. The latest earnings season confirmed the strength of major industrial and financial players, while easing inflation and expectations of a Fed rate cut provide a supportive backdrop. #DJI30 remains a reliable gauge of market stability and investor risk appetite worldwide. According to FreshForex, this opens a window of opportunity for long positions on #DJI30.

Us30 Trade Set Up Aug 28 2025FX:US30
www.tradingview.com
Price has made HH/HL on the 1h so if price can remain above HL and the 1h FVG i can see it testing BSL before coming down but if price can close under HL and invert 1h FVG i will look for sells down to SSL and PDL

US30: Target Is Down! Short!
My dear friends,
Today we will analyse US30 together☺️
The recent price action suggests a shift in mid-term momentum. A break below the current local range around 45,632.8 will confirm the new direction downwards with the target being the next key level of 45,563.0 and a reconvened placement of a stop-loss beyond the range.
❤️Sending you lots of Love and Hugs❤️


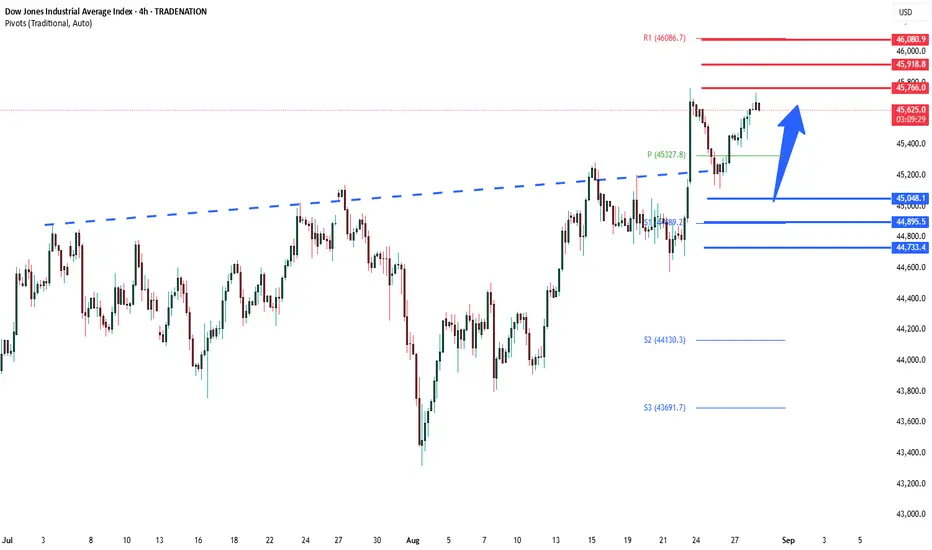
DowJones Key Trading LevelsKey Support and Resistance Levels
Resistance Level 1: 45766
Resistance Level 2: 45920
Resistance Level 3: 46080
Support Level 1: 45050
Support Level 2: 44900
Support Level 3: 44730
This communication is for informational purposes only and should not be viewed as any form of recommendation as to a particular course of action or as investment advice. It is not intended as an offer or solicitation for the purchase or sale of any financial instrument or as an official confirmation of any transaction. Opinions, estimates and assumptions expressed herein are made as of the date of this communication and are subject to change without notice. This communication has been prepared based upon information, including market prices, data and other information, believed to be reliable; however, Trade Nation does not warrant its completeness or accuracy. All market prices and market data contained in or attached to this communication are indicative and subject to change without notice.
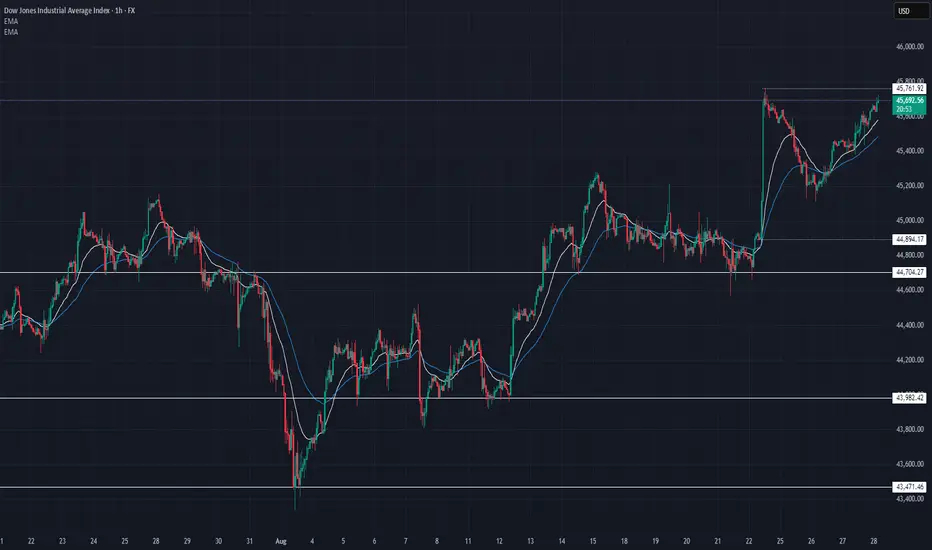
US30 Technical Breakdown – 08/28/2025📍 US30 Technical Breakdown – 08/28/2025
US30 pushed higher overnight, reclaiming 45,600 and now pressing right into 45,761 resistance. Price is trending bullish, with higher lows holding above 45,400 support.
Bulls want a clean breakout above 45,761 for continuation, while bears will try to fade this rally back toward 45,400–45,200.
📊 Current Market Behavior:
📈 Strong uptrend since 45,200 breakout
🔄 Coiling just under 45,761 key resistance
📊 EMAs aligned bullish (trend intact)
⚠️ Overhead supply could trigger a pullback
📌 Key Levels:
🔹 Resistance Zones:
45,761 → Major breakout test
45,900 → Next upside target
46,100 → Expansion level
🔹 Support Zones:
45,600 → Immediate intraday support
45,400 → Key demand + EMA zone
44,894–44,704 → Strong floor
🧠 Bias:
📈 Bullish Intraday
Trend favors buyers above 45,400
Break above 45,761 = upside momentum continuation
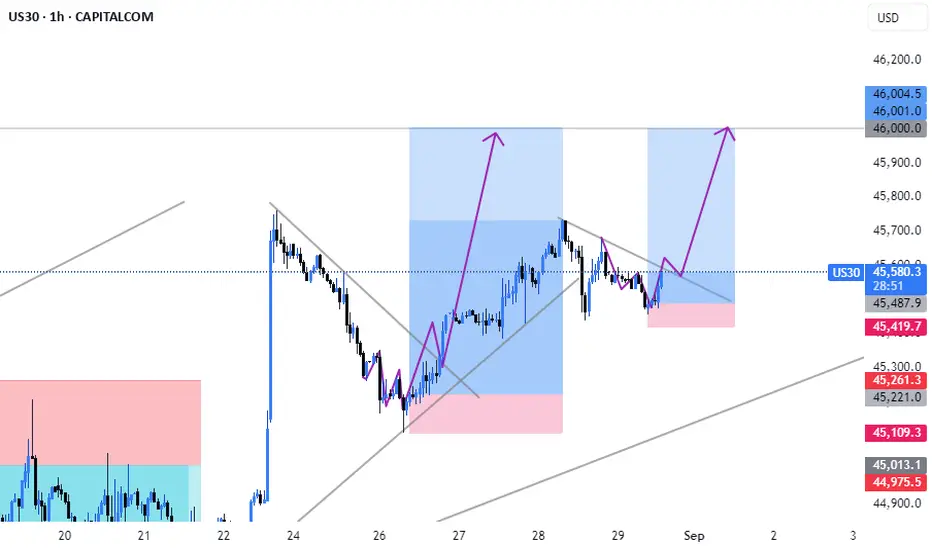
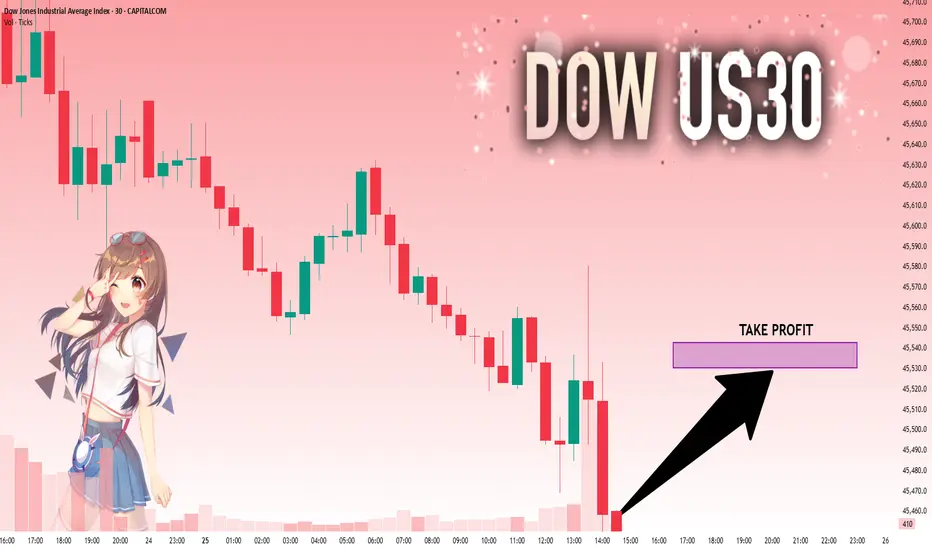
UPDATE ON LONG DJ / US30 READING Continuation after a PullBack On H1 timeframe
Another Entry can be done on the current Trend Line to the upside.
After a Breakout to the upside which is still valid for a Buy trade
Entry Price .... $45,230.00
DJ / US30... $45,230.0
S/L ...$45,100.00
T/P ...$45,320.0
First Take Profit with Price $45,320, has been hit in huge profits
Trade is still running in more profits to hit final target price of $46,000.0
Also looking at a final touch to $46,000.0 LEVEL.
And More
Dow Jones Breaks Out of Inverse Head & Shoulders, Eyeing FurtherThe Dow Jones Index has confirmed a breakout from the classic Inverse Head and Shoulders pattern, signaling a potential trend reversal to the upside. The neckline breakout, supported by rising trading volumes, adds strength to the bullish outlook and paves the way for a more sustained upward move. If the index holds above this key level, further capital inflows could drive the Dow toward higher targets in the medium term.

Short idea.This idea is based on fibonachi indicator. I was waiting for price to come back up and it did sooner than I expected.

Us30 Trade Set UP Aug 27 2025FX:US30
www.tradingview.com
Us30 is approaching a 1h FVG, if it respects it, i will look for internal sweep of SSl followed by 1m-2m IFVG to target higher BSL levels but if price inverts the 1h FVG(closes under 50% of FVG) i will look for sells towards PDL

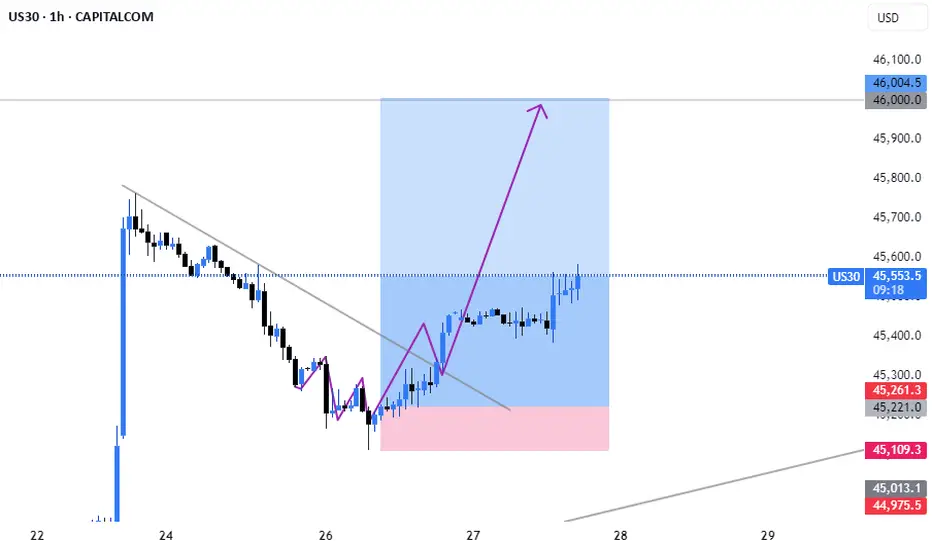
Dow Jones Regains Momentum After Pivot BounceUS30 – Overview
Rebound From Pivot, Testing Higher Levels
The Dow Jones reversed from the 45,110 pivot line mentioned previously and has now stabilized above 45,410, signaling renewed bullish pressure.
🔹 Technical Outlook
As long as price trades above 45,510, the bullish trend is expected to continue toward 45,690.
✅ A breakout above 45,690 would further strengthen upside momentum, with potential to extend higher.
⚠️ However, if the index closes a 4H candle below 45,410, this would confirm a bearish correction toward 45,285.
🔹 Key Levels
Resistance: 45,560 – 45,690 – 45,860
Support: 45,285 – 45,110
✅ Summary:
US30 has regained bullish momentum after rebounding from the pivot zone. Holding above 45,510 keeps the upside intact, but a 4H close below 45,410 would shift the outlook toward a correction.

Dow Jones Index Analysis (US30 / Dow Jones)The index is currently trading in an overall uptrend and recently bounced from the support area at 45,180.
1️⃣ Bullish Scenario:
The index may retest the 45,300 level, and if bullish momentum continues with a breakout above 45,500 and holding above it, the price could head towards 45,700, and later open the way to 46,000.
2️⃣ Bearish Scenario:
If the index breaks below 45,200 and holds beneath it, it may head to retest the 44,900 level.

US30 Technical Breakdown – 08/27/2025📍 US30 Technical Breakdown – 08/27/2025
US30 bounced strong off 44,900 support and ripped back above 45,300, reclaiming momentum after yesterday’s pullback. Currently sitting at 45,421, price is consolidating just under the EMAs and eyeing another push higher.
Bulls want continuation toward 45,600–45,761, while bears need to force price back below 45,200 to regain control.
📊 Current Market Behavior:
📈 Strong recovery bounce from 44,894 support
🔄 Consolidation between 45,200–45,450
📊 EMAs starting to curl bullish again
⚠️ Momentum cautious after sharp rejection from 45,761
📌 Key Levels:
🔹 Resistance Zones:
45,450 → Intraday pivot resistance
45,600 → Pre-breakout supply
45,761 → Major rejection high
🔹 Support Zones:
45,200 → EMA support & intraday demand
44,894–44,704 → Strong support cluster
43,982 → Deeper demand zone
🧠 Bias:
📈 Slightly Bullish Intraday
Above 45,200 keeps upside structure intact
Failure back below 45,200 flips bias bearish

Us30 1500 pips set upFX:US30
www.tradingview.com
was a slow day but out set up played out securing a total of 1500 pips
the target was buy side liquidity

US30: Next Move Is Up! Long!
My dear friends,
Today we will analyse US30 together☺️
The recent price action suggests a shift in mid-term momentum. A break above the current local range around 45,456.4 will confirm the new direction upwards with the target being the next key level of 45,530.6 and a reconvened placement of a stop-loss beyond the range.
❤️Sending you lots of Love and Hugs❤️
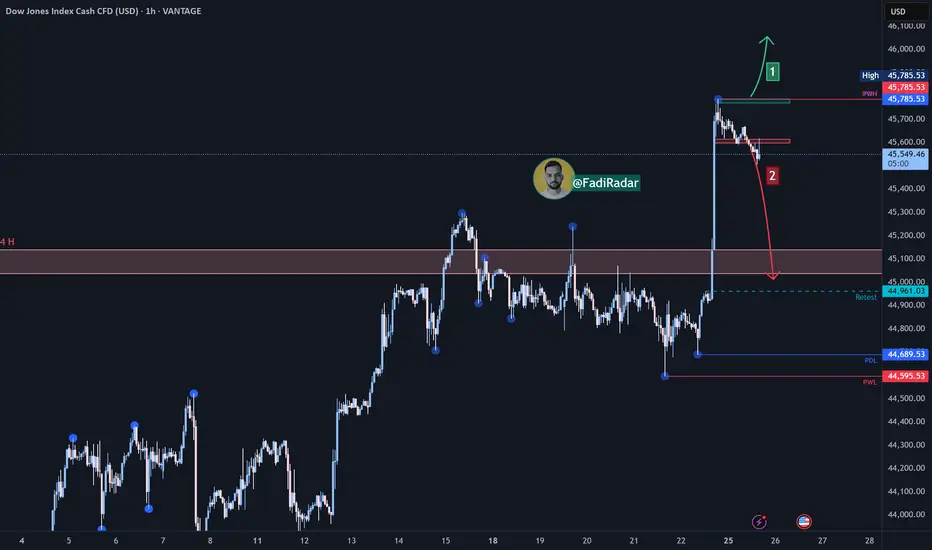
US30 / Dow Jones Technical AnalysisThe Dow Jones index is currently in a general uptrend, with a downward corrective movement on the hourly timeframe.
1️⃣ Bullish Scenario:
If we see bullish momentum and the price holds above 45,700, the index may target 46,000, with continued buying pressure potentially opening the way toward 46,200.
2️⃣ Bearish Scenario:
However, if the price remains below 45,600, this could push the index to test the 44,950 area.
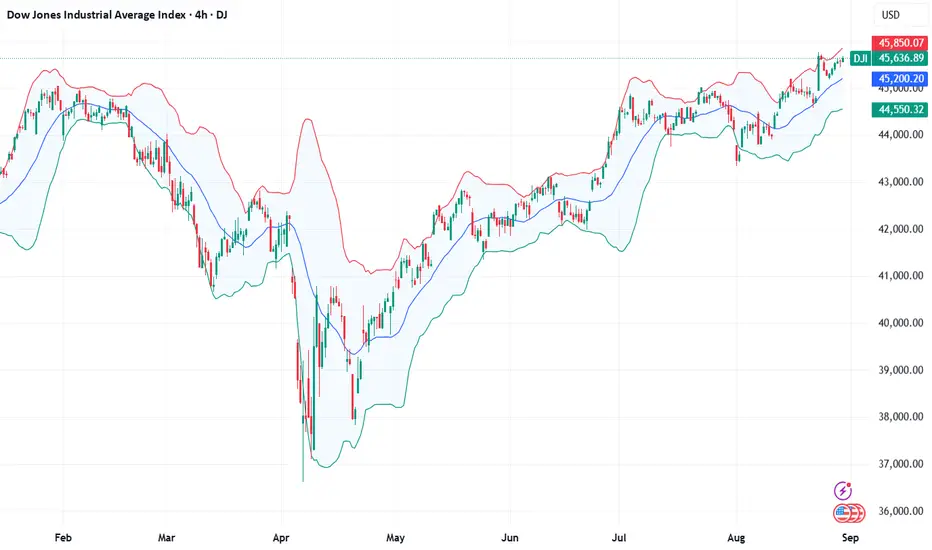
Breaking: Dow Jones's Overbought RSI Signals Correction Risk
Current Price: $45631.74
Direction: SHORT
Targets:
- T1 = $45150.00
- T2 = $44500.00
Stop Levels:
- S1 = $46000.00
- S2 = $46350.00
**Wisdom of Professional Traders:**
This analysis synthesizes insights from thousands of seasoned traders and market experts who closely monitor the Dow Jones. Leveraging collective intelligence, this approach identifies exaggerated momentum trends and potential reversal points. Many professionals agree that while the Dow Jones has gained significant ground, conditions such as overbought RSI and failing momentum indicators suggest a high-probability corrective phase.
**Key Insights:**
The Dow Jones has surged in value over the past weeks amid increased optimism regarding economic resilience and robust earnings reports from major corporates. However, key technical indicators are flashing warning signs. The Relative Strength Index (RSI) shows extreme overbought conditions above 70, historically a precursor to price stagnation or correction. Volume analysis also reveals weakness in buying pressure, further supported by bearish divergence across key oscillators.
The macroeconomic landscape remains a potential catalyst for volatility, with central banks globally hinting at further tightening amid stubborn inflation. Traders are advised to remain cautious as equity indices like the Dow Jones frequently react sharply to rate hikes or hawkish policy outlooks.
**Recent Performance:**
The Dow Jones has rallied more than 8% in the past month, driven by improving sentiment around corporate profitability and relief over lighter-than-expected economic data. However, upward momentum appears to be stalling at key resistance levels, as price activity creates narrowing candles, indicative of indecision. Furthermore, recent sessions have seen increased intraday failures to hold higher price levels, signaling weakening upside conviction.
**Expert Analysis:**
Prominent financial analysts are flagging concerns about the Dow's sustainability in this high-price zone. Market technicians observe multiple bearish technical patterns forming, including divergence on the MACD and a thinning Bollinger Band width indicating lower volatility ahead. These signals, combined with declining buyer enthusiasm, make the current trading environment ripe for a potential pullback. On the fundamental side, persistently elevated interest rates and looming recessionary fears may continue to weigh on valuation multiples.
**News Impact:**
Recent news surrounding geopolitical instability and renewed supply chain disruptions may add pressure on sentiment, fueling a risk-off environment. Additionally, upcoming earnings reports could spark further volatility as the market adjusts to existing macroeconomic headwinds. While some major companies have outperformed expectations, overall guidance leans cautious, emphasizing the need for traders to tread carefully.
**Trading Recommendation:**
Given the overextended technicals and diminishing buying momentum, taking a SHORT position on the Dow Jones presents a sensible choice. Price action and technical indicators suggest a correction phase is plausible, offering opportunities to capitalize on expected downside movements. Setting tight stop-losses around $46350 ensures protection in case the index defies odds and breaches resistance levels further. Maintain vigilance against macroeconomic updates that could cause abrupt sentiment changes.
Do you want to save hours every week? Register for the free weekly update in your language!
